JOLTs: Partly Cloudy, No Lightning – Yet
The JOLTs report for February offers some relief for inflation worries even before the SVB and bank fallout affects the numbers.
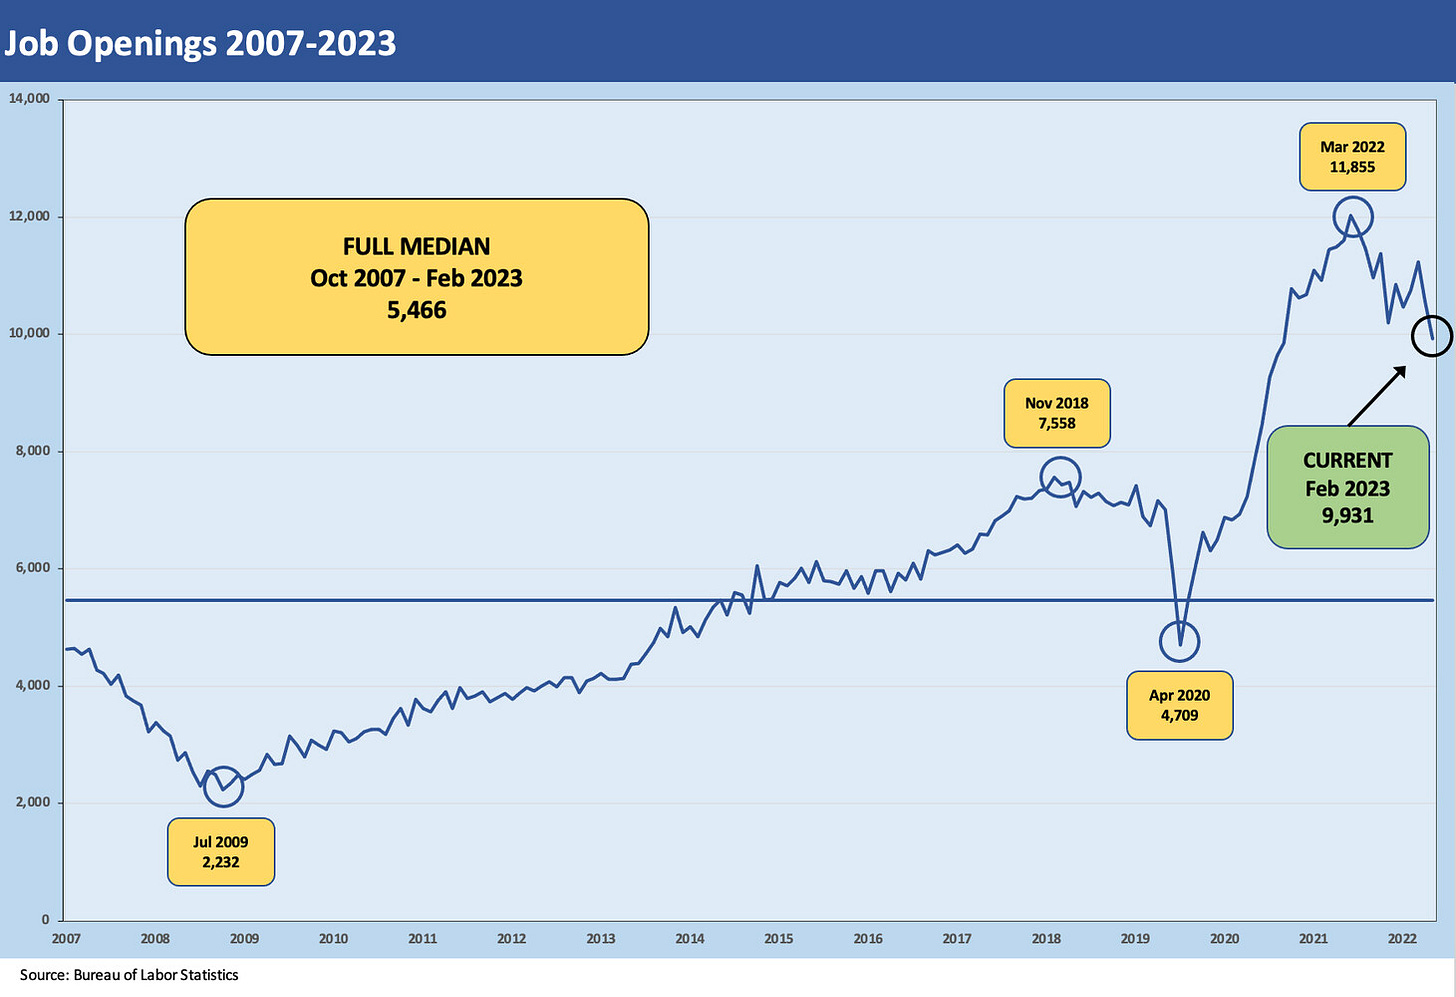
JOLTs show job openings in Feb 2023 sending signals of more declines to come even if from a very high run rate.
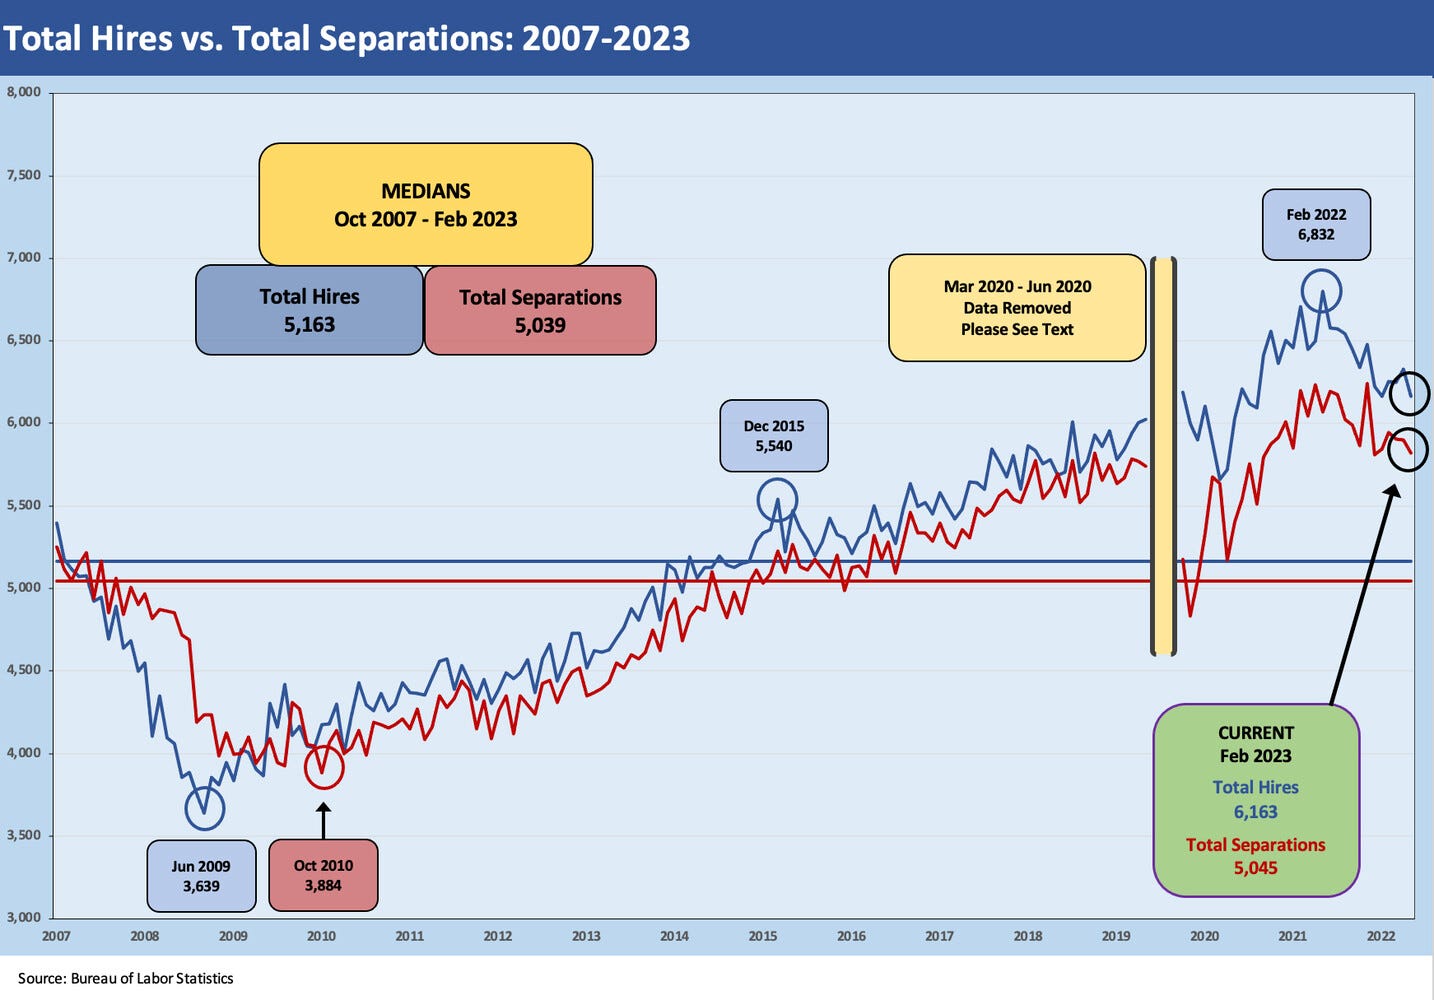
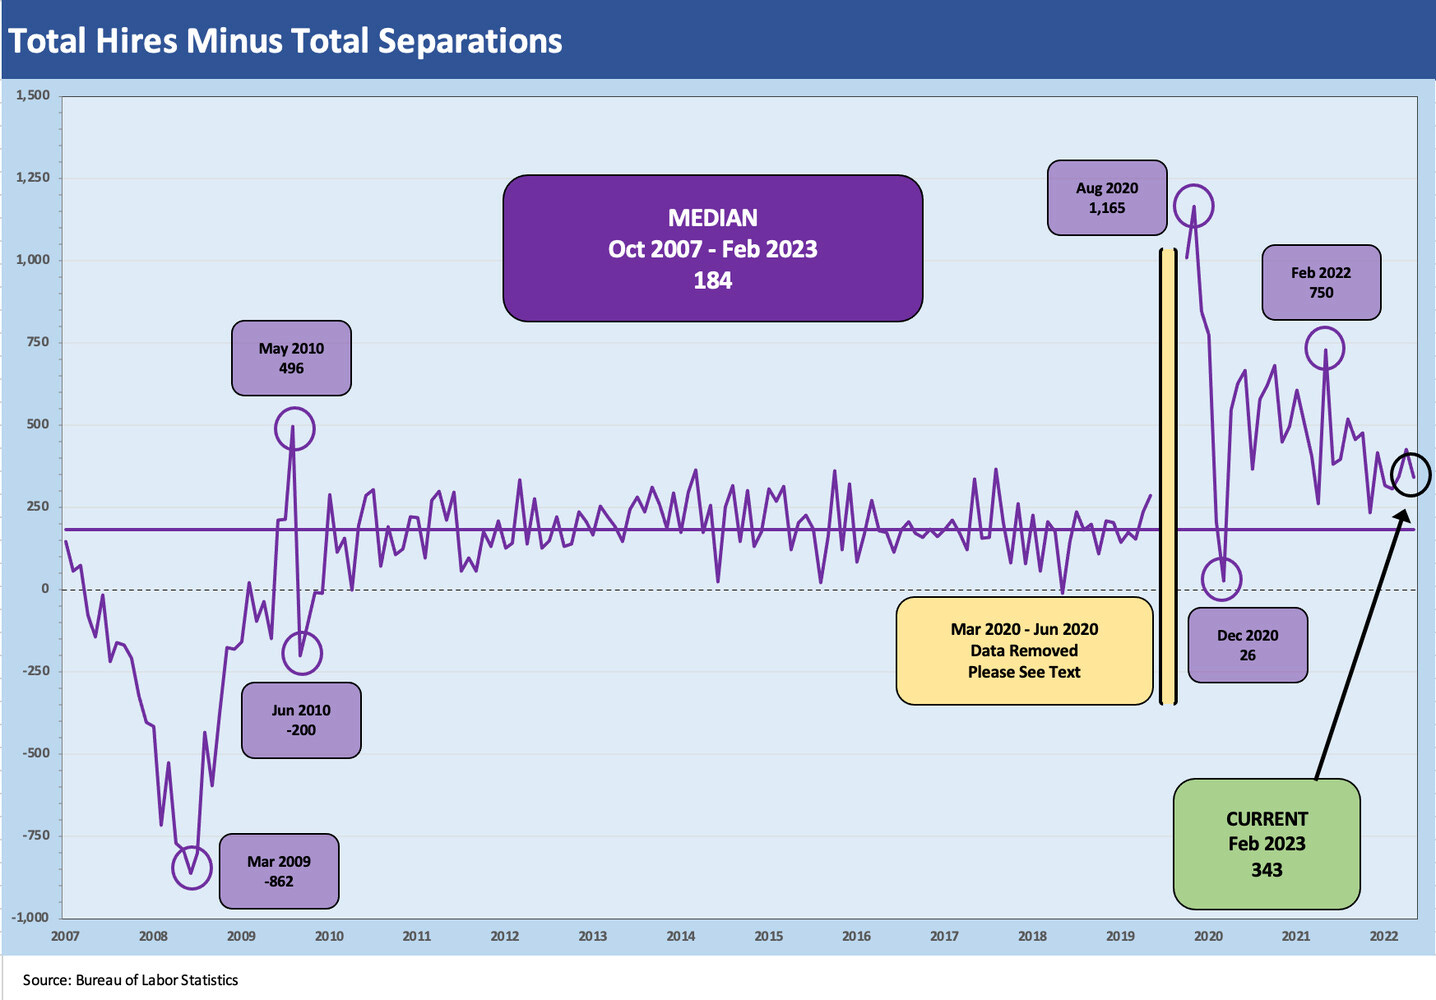
Hires ahead of separations is supportive even as the quits rate moved higher and remains well above the long term median.
The fact that the effects of the bank panic and depositor fears only shows up in March after these numbers will be one to watch when March JOLTs numbers come out later this month.
The JOLTs data is starting to move into a more defensive mode for growth as job openings declined by 632K for Feb 2023. That came in a month that did not even include the effects of the bank deposit panic after the Silicon Valley Bank fiasco. The ensuing headlines got the Bears’ blood up and left many employers reassessing forward prospects.
The -632K decline in job openings still leaves a high absolute level, but the decline has the market’s attention. Job openings of 9.9 million are still running ahead of the 5.9 million unemployed as of Feb 2023 month end with that ratio now at 1.67x. The decline in job openings is a February event, and since then the fears of a recession and credit contraction have risen. Next up is March employment on Friday after initial claims on Thursday.
After some very strong demand side pressures on labor markets still seen in the JOLTs data in recent months, this latest one crossed below the 10 million line (see A Fresh JOLT but No Shock 3-8-23, JOLTS: More Bodies for More Jobs, Demand is Strong 2-1-23). The JOLTs numbers were getting under Powell’s skin for being inflationary before the depositor panic turned risk appetite on its head (see Risk Appetites Get Bloodied 3-15-23, SVB Reprieve: Hail Powell the Merciful 3-12-23). The regional bank noise roiled the UST market as well (see Silicon Valley Bank: How did the UST Curve React? 3-11-23). This latest set of JOLTs numbers will up the ante on the conversation of what the post-SVB and regional bank anxiety numbers might look like during April as more employment stats and economic indicators roll out.
The hires vs. separations were still in the right order for workers with hires at 6.2 million and total separations at 5.8 million. The higher levels of separations as usual were in the services sectors with the usual high turnover in numerous lower paid services jobs. The differential between hires and separations is still well above the long term median as detailed below. Please note we remove the major distortions of the COVID swings, which we've covered in other commentaries.
The asterisk in looking at job openings, hires, and separations (quits or layoffs/discharges) for the highest tallies by line items in a given category is that sometimes the good and bad news both have high numbers given the fluidity of some of the professions and job categories and regional variances.
The quits rate (quits % separations) actually ticked up to 70% in Feb 2023 from 65% in Jan 2023. That is still well above the median of just under 56%. Lower confidence in job safety would make more sense after so many companies ended up worrying about their deposits.


