JOLTS: Job Openings Lose Some Velocity
We look at June JOLTS data with a slight decline in Jobs Openings not much of a sign of loosening with Separations also still in check.
The JOLTS release shows some (very) mild loosening of Job Openings with Openings down, Quits down, but Layoffs flattish even if also still down slightly.
At 9.6 million in Job Openings, that number is still comfortably in excess of the June unemployment ranks of 6.0 million with the July tally due Friday.
The Fed may not have the same velocity on its hikes, but the signals so far on jobs indicate the Fed hikes are not a “wild thing” in terms of the effect on jobs so far.
The employment trend line remains under intense scrutiny as the new economic debate seems to have shifted to the “too strong” topic after a round of very solid numbers last week. The JOLTS numbers come at a 1-month lag, so Friday’s July employment release is more important. That said, the Job Openings in June were only off by 34K. We will see how many more of those jobs were printed in July later this week. The peak Job Openings in March 2022 of 11.8 million have been getting whittled down with steady hiring to record payroll levels in total. Employers have made a much bigger dent than the Fed by hiring so many.
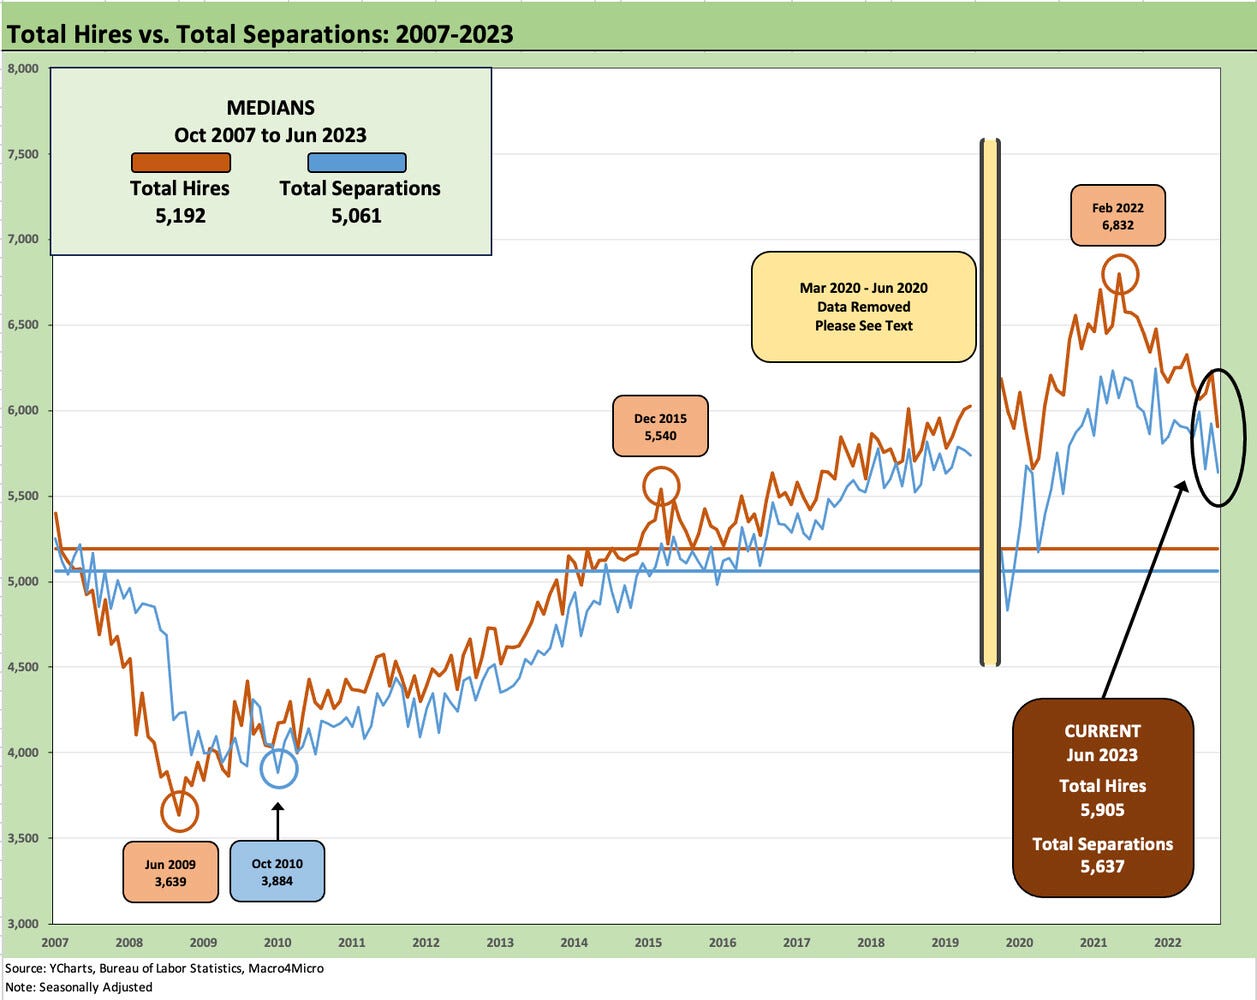
The above chart plots the time series for Total Hires vs. Total Separations, and both are running above long-term medians as noted in the boxes in the chart. We note that the chart removes the peak COVID period to better capture the visuals of long-term trends and not “mess up our chart scale.” We frame those COVID details further below.
The above chart updates the Hires vs. Separations differential. The excess of Hires over Separations at +268K is still running above the long-term median of +185K despite the headline employer layoffs that pop up on the screen periodically. The expanding population would logically indicate growing numbers just to keep pace.
The COVID distortion factor…
We include the boxed commentary below as a reminder of the scale of the employment swings during COVID. This is an excerpt from an earlier commentary that retells the story specifics as a memory jogger.
The numbers from the pandemic are more about how shocking the upheaval was at the time and offers a reminder that those who try to only look at narrow aspects of the inflation causes-and-effects are doing a disservice to how complex the moving parts of supply and demand were during the transition from 2020 into 2021.
With mass layoffs in the immediate aftermath of COVID measured on a depression era scale, the rebound with the reopening and then the vaccine added further to the demand imbalance with the badly damaged global and regional supplier chains. Anyone simplifying the causes to just being about the demand side is either politically axed or mentally impaired (not mutually exclusive on either side of the political spectrum).
The above chart updates the Quits rate as a % Total Separations. We see the Quits number dipping slightly from 68.4% in May, but the job seeker confidence level is clearly still pretty high even if well off the highs. The rate is back to the pre-COVID levels of 2019 but remains well down from the 72.9% high of late 2021.
The willingness of lower-paid workers to jump for a raise can still be high, but the willingness to “Quit first and ask for a job later” might be lower than it was. The willingness to quit in advance does not change the wage pressure associated with the willingness to jump for a high single-digit increase in wages or a boost in benefits. The moderation in the Employment Cost Index on a YoY basis for the June quarter was still well above inflation targets (see Employment Cost Index: Rings of the Redwood 7-28-23). The pressure is still there in the service sector especially.
See also:
Footnotes & Flashbacks: Asset Returns 7-30-23
Footnotes & Flashbacks: State of Yields 7-30-23
Employment Cost Index: Rings of the Redwood 7-28-23
Chasing the Dragon: 2% Handles Beckon for PCE Inflation 7-28-23


