Chasing the Dragon: 2% Handles Beckon for PCE Inflation
The Personal Income & Outlays release leaves the market on the 3.0% fence for Headline PCE inflation peering at the 2% handle just beyond.
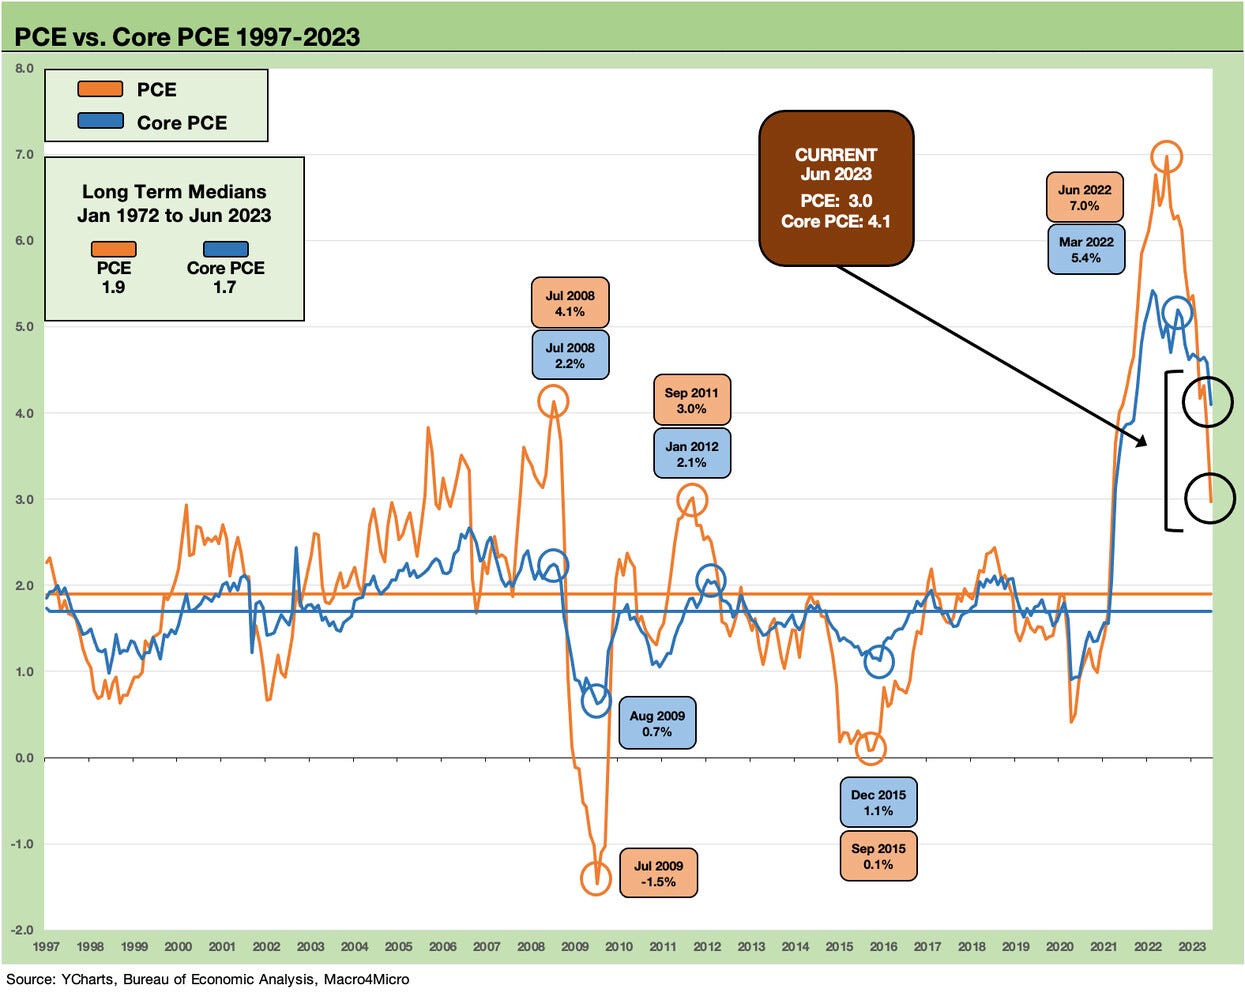
There is always plenty of room to debate near term sources of inflation via wages and Services pricing, but a 3.0% headline PCE is a market friendly perception shaper at a time when inflation has been the main fixation even if Core PCE is moving slower at 4.1%.
The -0.6% YoY Goods trend for Goods contrasts with the stubborn Services number of +4.9% in what is a service economy.
Personal income is still ticking higher at a slower rate than consumption with real disposable income at +4.7% in June vs. real consumption growth of +2.4%.
Savings rates remain in the 4% handle range but ticked down from 4.6% to 4.3%, above the 3% handles of late 2022.
Whether you worship at the altar of CPI (like most of the country) or PCE (like the Fed and a subset of fixed income markets), the news has been steadily positive. A notable exception is the labor-intensive services sector where much of the US record payroll count dwells. The PCE index is where the Fed sets its sundial, so the monthly PCE Index drill is necessarily a priority economic indicator for those in the market.
The PCE price index for June showed a small sequential uptick at the monthly level from 0.1% to 0.2% after revisions, but the YoY number is the headline grabber as the rate declined from the +3.8% headline from last month’s May release (see Good (Mixed) News: Sub-4% PCE Wins 6-30-23) to 3.0% in June. That is the number that gets held up to the 2.0% inflation target even if the “Big Dogs” at the Fed seem to blur their definition of which PCE they target. As noted in the above chart, that 3.0% headline PCE is sharply lower than the June 2022 7.0%. The Core PCE is moving more slowly at 4.1% in June, down from the 2022 peak of 5.4% in Feb 2022.
Below we drop in our long-term time series for headline PCE and Core PCE as an example of the wild swings going back to the stagflation years. The chart tells a story and offers a sense of scale.
The 2% solution for the Fed…
With respect to that 2% target rate, try googling around to see if the 2% Fed target is “Headline” or “Core.” It is not unanimous. It is not a “gotcha” thing but more a reflection of the reality that they like room to maneuver. A quote from an article by one of the big Fed brand names (James Bullard) on the layers of CPI and PCE reads like this: “While each of these measures provides different and important insights into inflation, the FOMC target is nonetheless headline PCE inflation of 2%. And bringing today’s inflation rate back down to that 2% target is the top priority for the FOMC.”
I found others that cited “Core” as the main event for PCE and not “Headline.” For example, a 2022 Reuters article had this to say: “The 2% goal was unscientifically chosen by the Alan Greenspan Fed in the mid-1990s, and core PCE quickly became the favored measure…Former Fed Chair Ben Bernanke said in an interview with Marketplace in May that core "is the inflation rate that they (policymakers) target at 2%." I guess it’s a tossup.
We will just assume it is part of a more subtle gray area to leave room to toggle toward what a policymaker is seeking to see happen on the policy side. It reminds me of when equity analysts use multiple metrics to make a decision on price targets (P/E, EV multiple, sales multiples, book value multiple, termination values, etc.). They often then add in a mix of subjectivity around “What multiple?” For the equity crowd, the toggle helps when axed (or when you need the CFO to return your calls).
For the Fed, it is safe to assume they will keep watching the more worrisome of the metrics subject to their hawkish vs. dovish mentality. As of now, the more worrisome is Core PCE at 4.1%. With the PCE price index for Energy goods and service posting a YoY deflation number of -18.9% for June, the Energy worries are off the front burner and back in the fridge (for now) with labor costs and the flow-through into Services pricing the critical policy focus.
Personal Income vs. Personal Consumption…
As we covered with the 2Q23 GDP release this week (see GDP 2Q23: The Magic 2% Handle 7-27-23), the Personal Consumption Expenditure line will always be the main event in economic growth just on the basis of its 68% share of GDP vs. 17% for Fixed Asset Investment.
The good news for 2Q23 GDP run rates is that all the major fixed asset lines were also positive with the exception of a -4% handle in Residential. Even the -4% handle for Residential was minor in the historical context of housing cycles and reflected a very muted decline (Note: the streak of double-digit declines each quarter in Residential investment from the start of the slide in 2006 through the recession into 2009 was brutal).
On the Personal Income side of the ledger this month, we see a +4.7% increase in Real Disposable Income (Table 10 of the release) with a +2.4% increase YoY in Real Personal Consumption Expenditures. That is a solid Real Disposable Income trend and another “highest of 2023” so far after May had the highest to that point.
That PCE line was +2.1% in Goods with +4.7% in Durable Goods and +0.6% in Nondurable Goods. For Services, we see +2.5% in Real PCE growth YoY. The fact that Goods posted up a -0.6% month for the PCE price index for Goods and +4.9% for Services gets back to the “sticky Services” inflation theme that keeps the hawks tense.
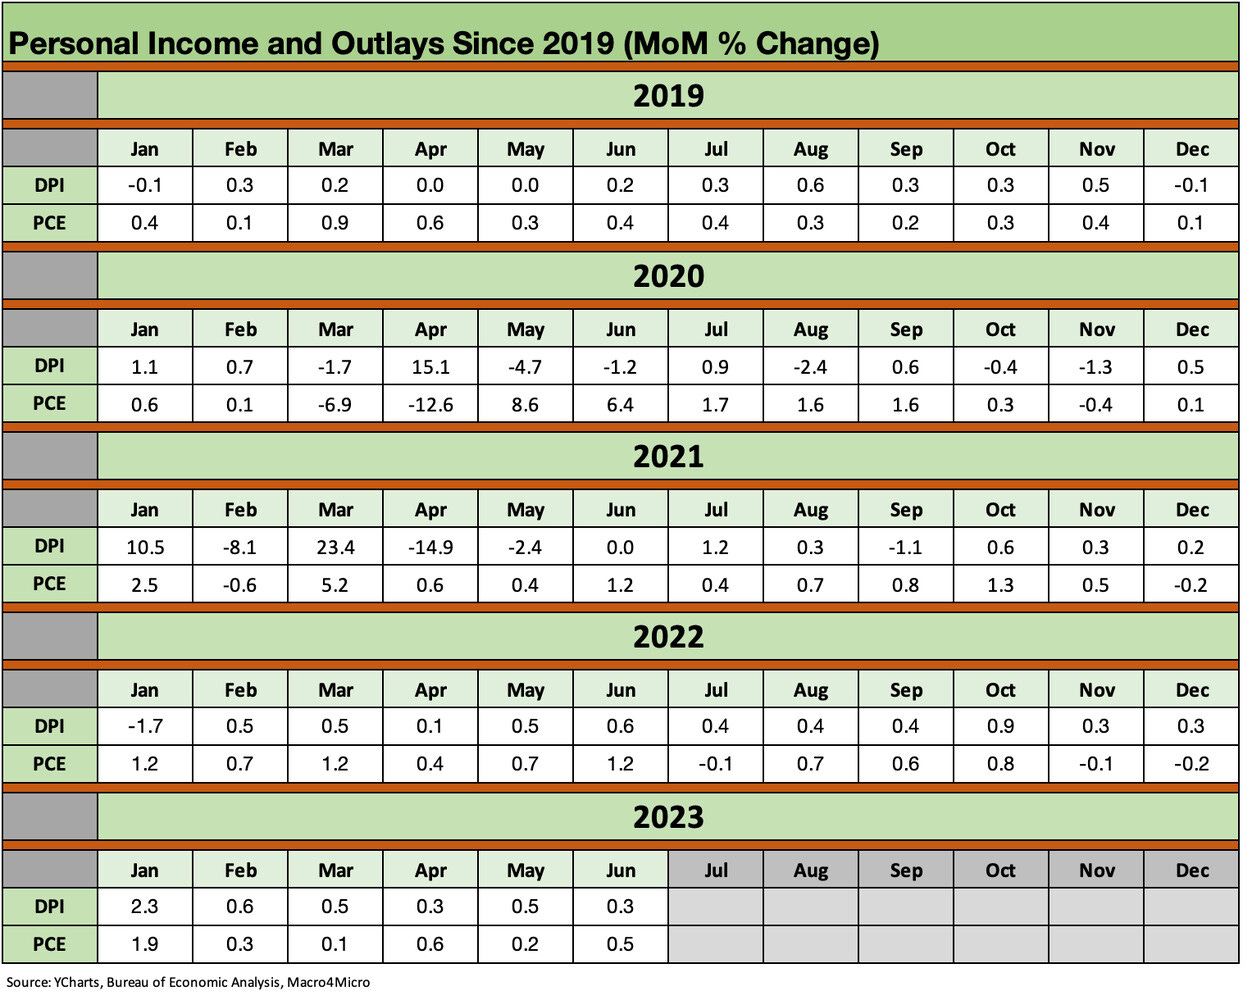
The above chart updates where the market has traveled in income and consumption since 2019. The chart offers a memory jogger on the dramatic swings in Disposable Income and Personal Consumption patterns that include the fiscal stimulus and relief payments and how fiscal actions along the way flowed into the household level. We include some of the wildest swings in the boxes embedded in the chart.
These swings will be part of the political debates in 2024 as they have been across the 2021-2023 period. The spikes and plunges in income and consumption sometimes get targeted as the main event for inflation, but the idea is you have to look at both the highs and lows and then map that over to the supply side of the equation.
Below we wrap with a historical lookback at the monthly Personal Income and Outlays trends back to 2019. The months of 2020 (notably March to June) are interesting and force you to look at what immediately followed in terms of consumption. The months from Jan 2021 to April 2021 make for good debate fodder.
Some obvious topics to ponder:
How do you frame the plunges in income and the spikes during the COVID peaks (notably stimulus and relief payments) in terms of the impact on demand?
In a few months of 2020 and early 2021, was this a case of filling in holes or building mountains of demand?
What was the alternative scenario in the absence of stimulus? Who would “own” the fallout?
How does that demand balance (or not balance) with the distortions of unprecedented supplier chain disruptions?
How to explain the rapid moderation of PCE and even declines in PCE that followed those periods?
The Fed was easing in late 2019 as the economy faltered, so how does that lag factor into the demand side of the additional moves to ZIRP with COVID in March 2020?
With the vaccine available as of Nov 2020, was that a trigger point for demand while supplier chain and freight and logistics were mired in massive disruptions and delivery constraints?
What was the alternative to stimulus and relief in the late 2020/early 2021 period?
How should we view the steep decline in income in Feb, April, and May of 2021 with the interspersed income spikes from relief (Jan 2021, March 2021) followed by a mix of muted PCE lines in 2021 despite a few 1% monthly pops (June, Oct)?
We expect the fine print will fall prey to the usual theme music in an election year. We have looked at some of these topics before (see Inflation Rorschach Test: Looking at Relief and Stimulus 2-7-23), and they always get muddied by repetition of simple cause and effects tailored to each side’s political spin. Whether fiscal or monetary, rooted in the demand side or the supply side, the layers of the challenges can’t get answered with 2 minutes to answer a debate question (If they answer the question at all).


