Footnotes & Flashbacks: Asset Returns 7-30-23
We look at asset class and industry returns as risk keeps winning and duration stalls fixed income.
Equities keep running on good macro news, constructive earnings reports, and the banks rallying off 2Q23 disclosure and Q&A.
Duration is not bringing much joy to fixed income total returns over the trailing 1-month and 3-month periods.
Regional banks make a positive statement again in the return numbers even if some risk aversion to “macro event risk exposure” and push-button deposit risk is hard to shake completely after the March experience and an ongoing interest margin squeeze.
The above chart updates the equity and fixed income asset class subsector returns. We line them up in descending order of YTD total returns with HY leading comfortably in debt and both the NASDAQ and S&P 500 running up the score in equities. Duration has been a headwind for fixed income of late (see Footnotes & Flashbacks: State of Yields 7-30-23).
The very strong numbers posted by the Russell 2000 over the past month stands out at 6.7%. That feeds the theme of the improving breadth of the rally as we also see in some of the benchmark equal weight ETFs that we look at below.
The above chart updates the 1500 and 3000 series stock returns with sustained strength amid all the large cap headlines as well as Russell 2000 headlines now spilling over into the next tier of market caps. The growth stock numbers remain “other worldly” YTD with the recent 3-month and 1-month returns on a similar pace.
Energy has moved back into the positive zone YTD with a banner month near 8% and Financials only slightly behind at 7.5% for the month as those two sectors get into the rotation rebound of the earlier laggards. Real Estate has stayed weak in recent periods. Oil (WTI) crossed $80 this past week and a wider range of banks wrapped a relatively reassuring round of releases (we look at Regionals further below).
ETF returns….
In our next three asset return charts, we cover 1-week, 1-month and 3-month time horizons. We look at 26 different benchmarks and ETFs. We recently added equal-weighed ETFs for the S&P 500 (RSP) and NASDAQ 100 (QQEW) given the market cap weighted distortions in the total returns for those benchmarks driven by the mega-names.
The 1-week time horizon for ETF total returns weighed in at 18 positive and 8 in the negative range. We see 4 of the 8 in the negative zone are fixed income ETFs (GOVT, AGG, LQD, and HYG). Interestingly, the large cap financial and leading banks and financial players in the XLF (e.g., S&P Global) turned in muted numbers and negative numbers on the week while the Regional Bank ETF (KRE) kept cranking.
Energy and Builders stayed strong with Materials and Transport remaining in the Top 10. The BDC comeback has been notable after a sagging period. For BDCs, floating rate asset income and some growing confidence around credit quality in the small and microcap space appears to be catching on in the small cap equity rallies. There are plenty of bears to debate with on such private credit plays, but we are constructive on BDCs as income products that could benefit from a soft landing with short rates staying high.
The 1-month time horizon weighed in at 23-3 positive. We see 3 fixed income ETFs on the wrong side of zero comprising the 3 negative ETFs. Regional Banks, E&P, Energy, Financials, and BDCs round out the Top 5. Financials had a setback this week but looking back a month includes the peak of earnings report days of those large cap financials. Russell 2000 small caps, MLPs, and Builders are next in the ranking and are notable for their less-than-tech-centric flavor. More industries have joined the party.
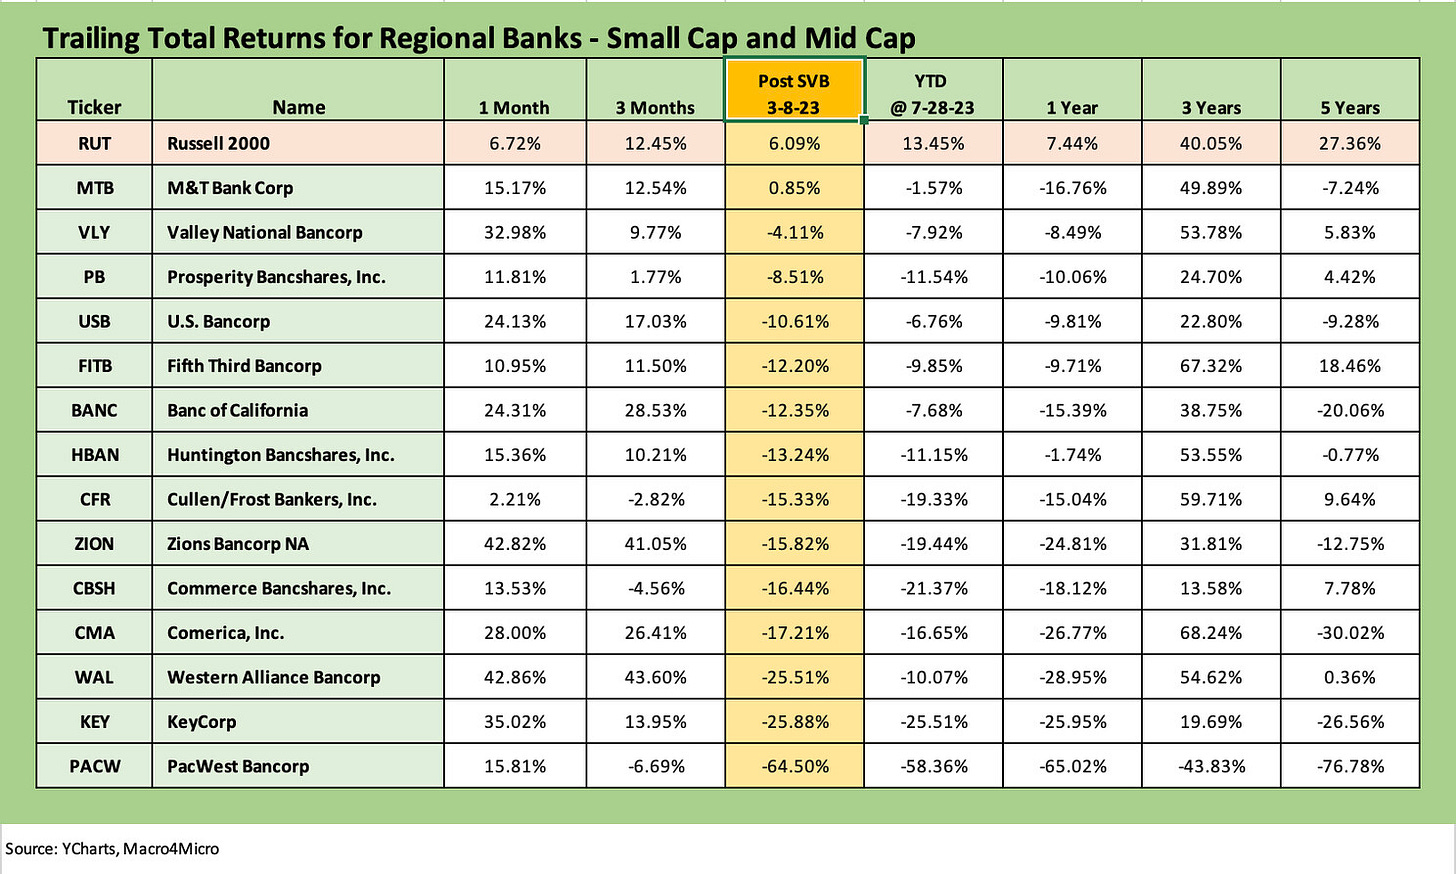
The Regional Banks have had a wild ride, so we update our regional sampler return chart from earlier commentaries. Some of the names that we tracked did not last, but the post-SVB crisis column in the chart tells a story from the March 8, 2023 date. The unraveling began on March 9. The chart lines up the names in descending return order from the SVB date. Almost all are negative since that date with the exception of M&T.
The majority of the names are down in the red with negative double-digit returns. You can start from the post-SVB column and follow each name to the left and the trailing 1-month and 3-month period. The easy conclusion is most names passed muster with the market after earnings day Q&A and via financial filings. That is two quarters of earnings season scrutiny that is helping rebuild confidence.
The 3-month horizon came in at 21-5 with 3 of the 5 on the losing side again tied to high quality fixed income along with 2 defensive sectors (XLP, XLU). With Transport and Builders at #1 and #2, respectively, some level of cyclical comfort zone is in evidence. We then see a mix of tech and growth stories with some Magnificent 7 sectors making the top performer list such as Consumer Discretionary (XLY with Amazon and Tesla) and Communications Services (XLC with Meta, Alphabet, Netflix).
As we detailed already, the Regional Banks ETF (KRE) was also positioned in the upper ranks at #6 in the Top 10 for the trailing 3 months. The E&P ETF (XOP) clawed its way back into a Top 10 position for the rolling 3 months after lagging badly for much of the year. BDCs also continue a rebound at just under the Top 10 ranks ahead of Industrials, the S&P 500, and Midstream Energy (AMLP).
The net takeaway on the asset returns lately is that fundamental risk wins while duration has stalled fixed income alternatives.


