Footnotes & Flashbacks: State of Yields 7-30-23
We look at the yield curve shifts after a banner week of good economic news and the FOMC staying on plan.
The UST curve digested almost across-the-board good news in the GDP release and a steady and constructive week for many bellwethers in 2Q23 earnings season.
PCE inflation planted its feet on the 3.0% line for the Headline PCE number while Core PCE (+4.1%) declined closer to the 4% dividing line.
The curve action has sharpened the duration debate as the market wrestles with the potential for longer end UST rallies vs. the risk of more steepener moves of the sort seen this week.
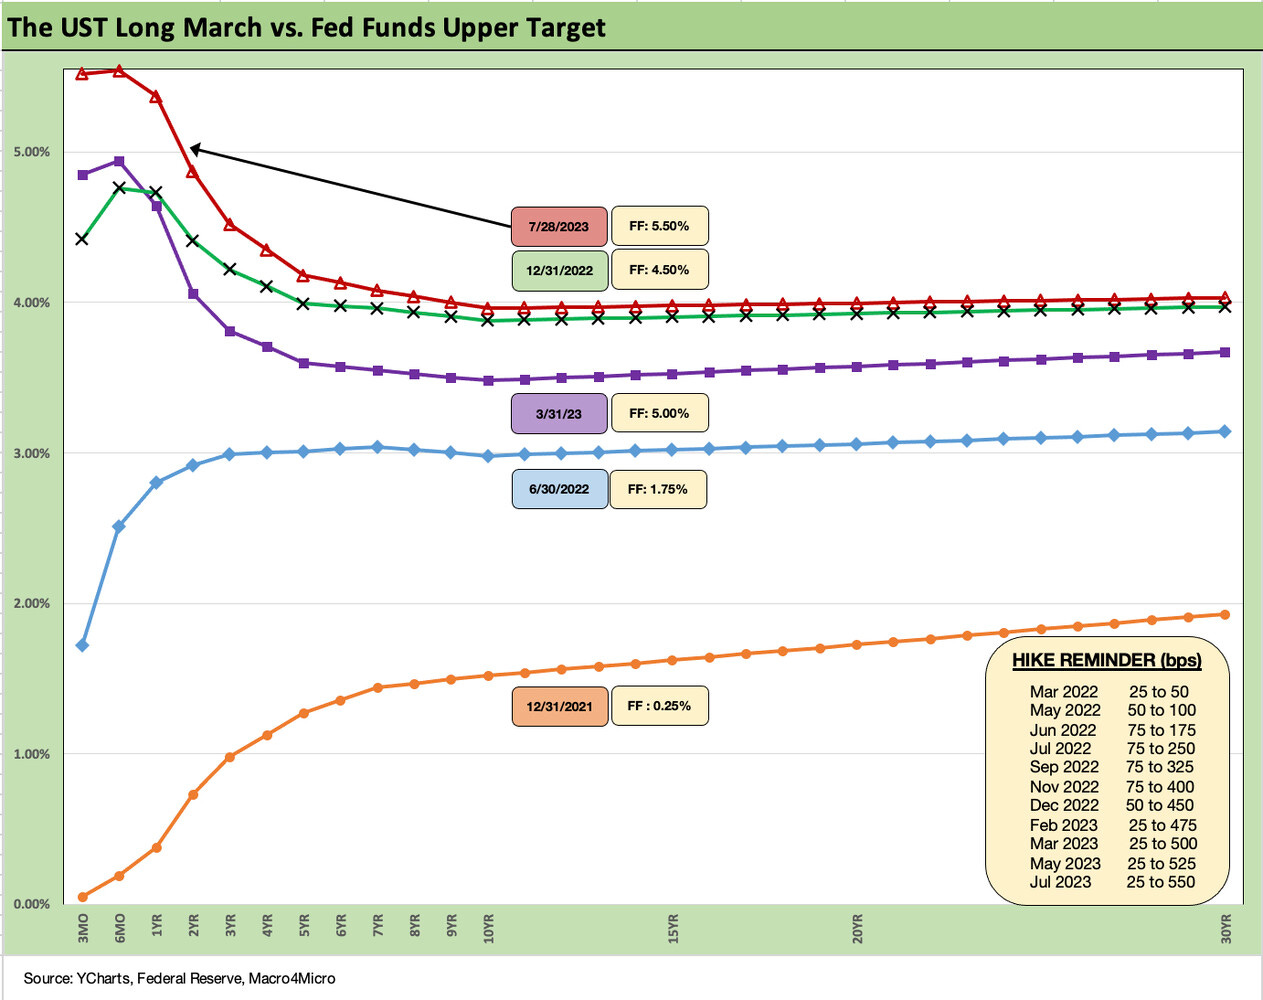
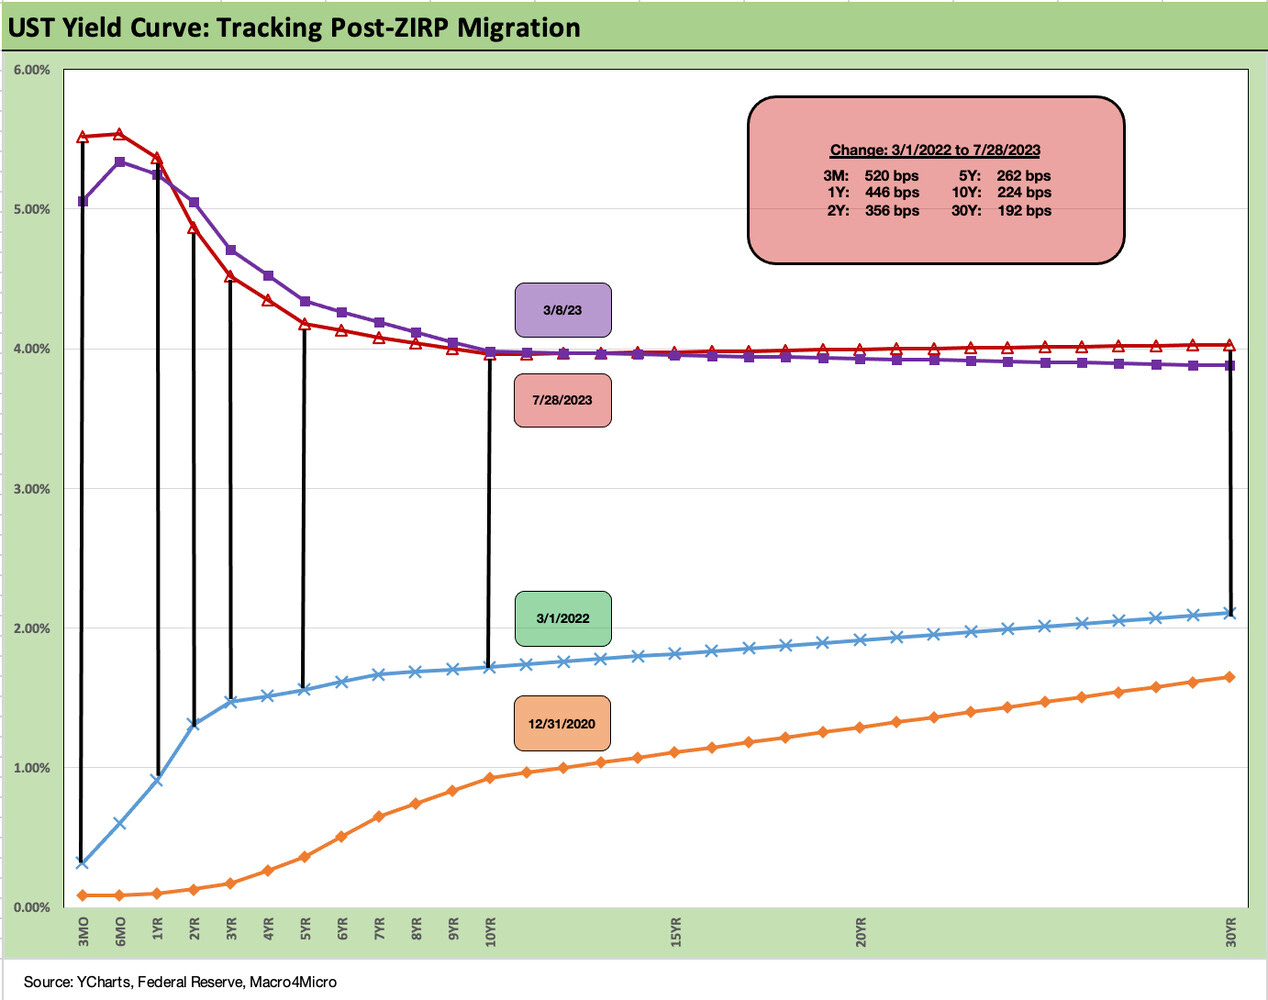
The above chart updates the yield curve migration from the end of 2021 across the end of ZIRP and the tightening year of 2022. We include a Fed action memory jogger in the box on the lower right that breaks out the timeline of Fed hikes including the past week’s 25 bps move to a 5.5% upper target.
The 3M UST had been trading above the upper end of the fed funds target range of 5.25% in May and closed above the new 5.5% upper target to end last week. The UST shifts across 2023 show a continued upward migration on the front end driven by the Fed and then the various shifts along the yield curve as the market drives the longer end.
Flattener vs. Steepener vs. Perma-Inversion…
The expectation of a recession inherent in the UST inversion across 2023 may fade somewhat, and therein lies the rub in such a protracted inversion. If recession is the right call, something in theory is supposed to move on the front end (pause or decline). If “no landing” or a very soft landing is the call, then the bear scenario can play out along the curve. That’s the discussion.
If we see sustained economic strength, the inversion is supposed to move in the direction of a flattening via a steepening (as strange as that sounds). Inflation declines help the bulls while tight labor and economic strength keep asset allocation plans pushing for risk and guarded on UST migration. We think clarity on recession indicators now is some months away. We have been picking IG over HY for total return in FY 2023 with some noise in the fall and early winter, but that call is not working yet.
Steepener for the week….
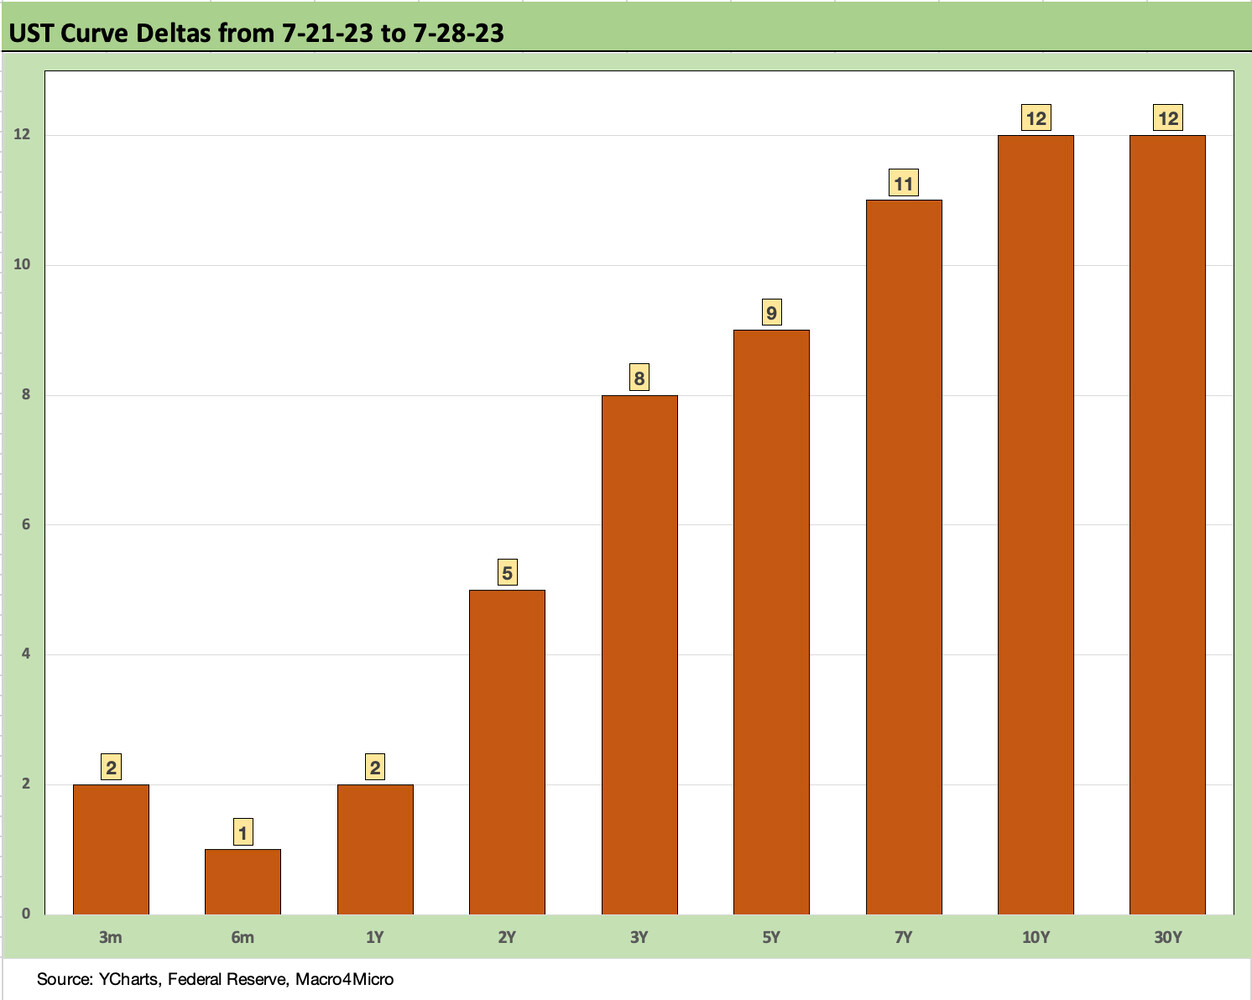
Good news on the economic front brought a modest steepener on the week as we detail below. The FOMC executed on the hike the market had already more than built in, but the other major economic releases delivered better news than the market expected as GDP came in strong on both the PCE and Fixed Asset Investment lines (see GDP 2Q23: The Magic 2% Handle 7-27-23).
Then the PCE inflation index brought goods news (see Chasing the Dragon: 2% Handles Beckon for PCE Inflation 7-28-23) and the Employment Cost Index moderated (see Employment Cost Index: Rings of the Redwood 7-28-23). PCE inflation is now on the 3.0% dividing line and adds to the confidence level on inflation declines (for now).
The series of releases added up to more optimism around growth, inflation slowing more, and some limited reassurance on compensation pressures in a tight labor market. We say “limited reassurance” since Services inflation remains sticky and those that believe growth will hold in 2H23 will have a hard time making the case the employed will not keep looking for raises.
The Employment Cost Index is still well ahead of inflation targets, so the ECI only brought so much to the table for those who might be ready to declare inflation as “game over.” The transmission mechanism from higher wages to Services and Goods pricing is still a mixed battle even with Goods pricing turning negative in PCE YoY. Services is the sticking point. The -0.6% YoY trend for Goods contrasts with the stubborn Services number of +4.9% in what is a service economy.
The union battles have already been headline-grabbers with airlines and pregame noise around the UAW discussions due to be finalized in the early fall. We get JOLTs and monthly employment this week, so there is more labor market and wage inflation inputs due dead ahead. With collective bargaining at only around 6% of the private sector, the bulk of wage inflation still turns more on the heavier weighting of lower wage service jobs. The statistical samples in ECI only tell us so much.
The above chart frames the UST deltas across the curve, and the moves hit duration with a steepening move. Spreads remain tight and coupon income in the broader index benchmarks is still well below current new issue market rates, so the total return repair is slow as we detail in the separate commentary on asset returns.
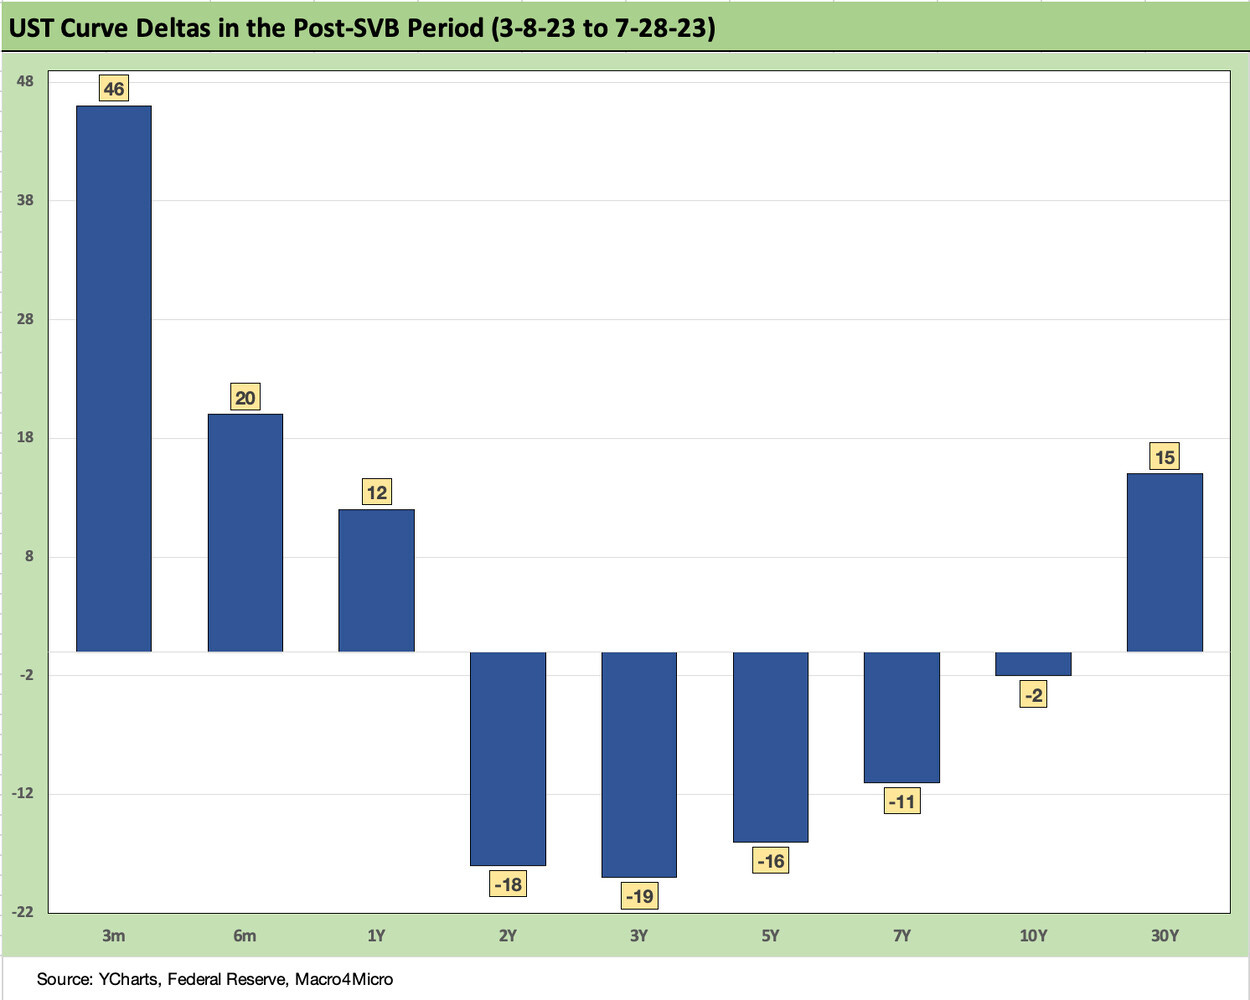
The above chart updates the running UST curve deltas since just before Silicon hit the fan on March 9 ahead of regulatory seizure on March 10. The front end of the UST curve has moved higher with the Fed tightening, and that has the effect of inflating interest margin pressure on the same regional banks that are looking to regain confidence with depositors and in the securities markets. We see modestly lower to slightly lower UST rates since then from 2Y to 10Y.
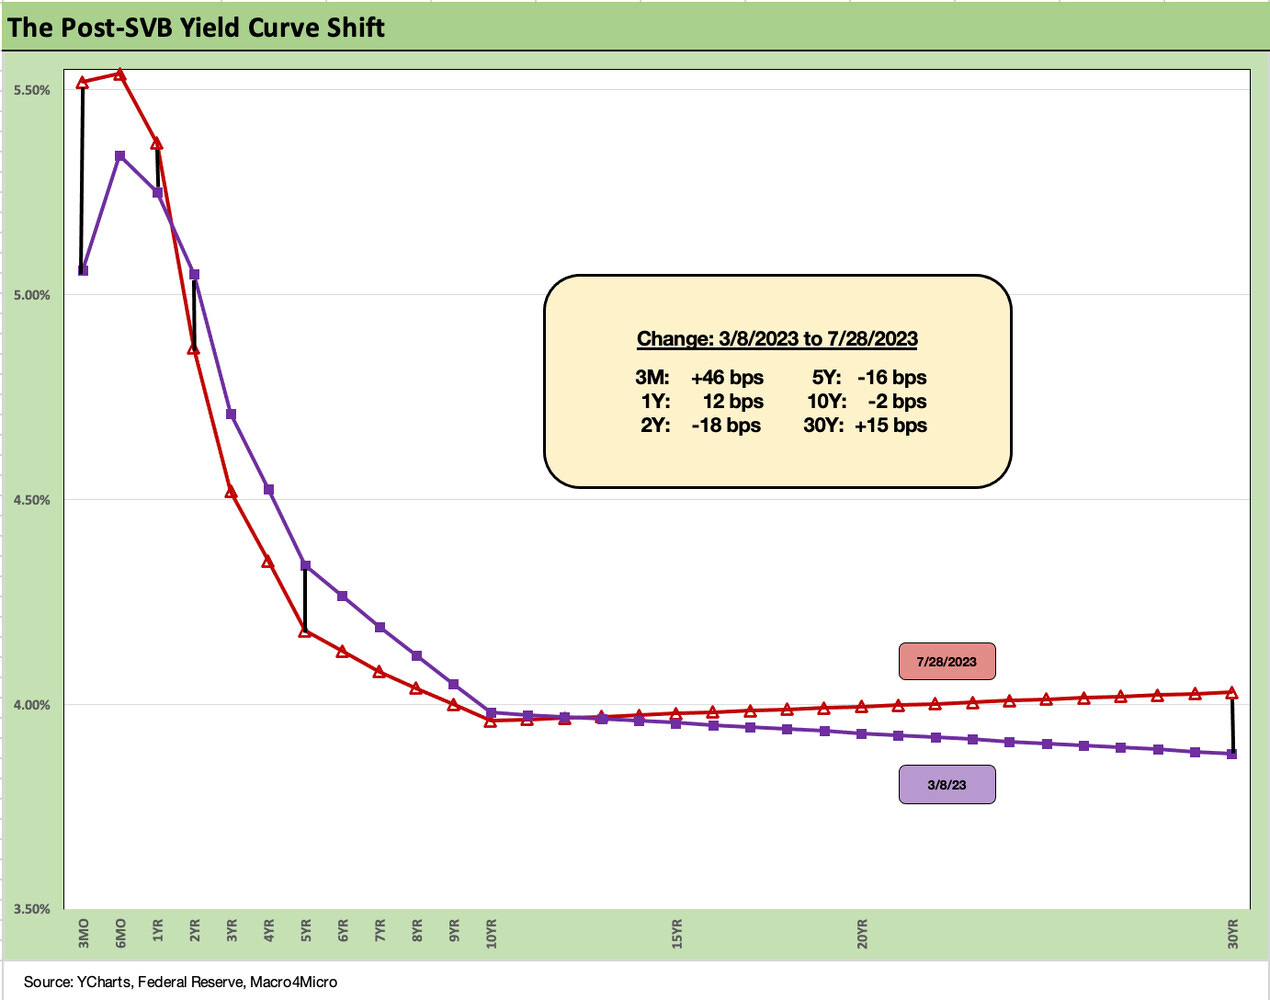
The above chart offers another visual on how the UST curve played out since the onset in March of the regional bank crisis. We see the long end steepening for 30Y UST above the 4% line while the overall UST curve remains highly inverted.
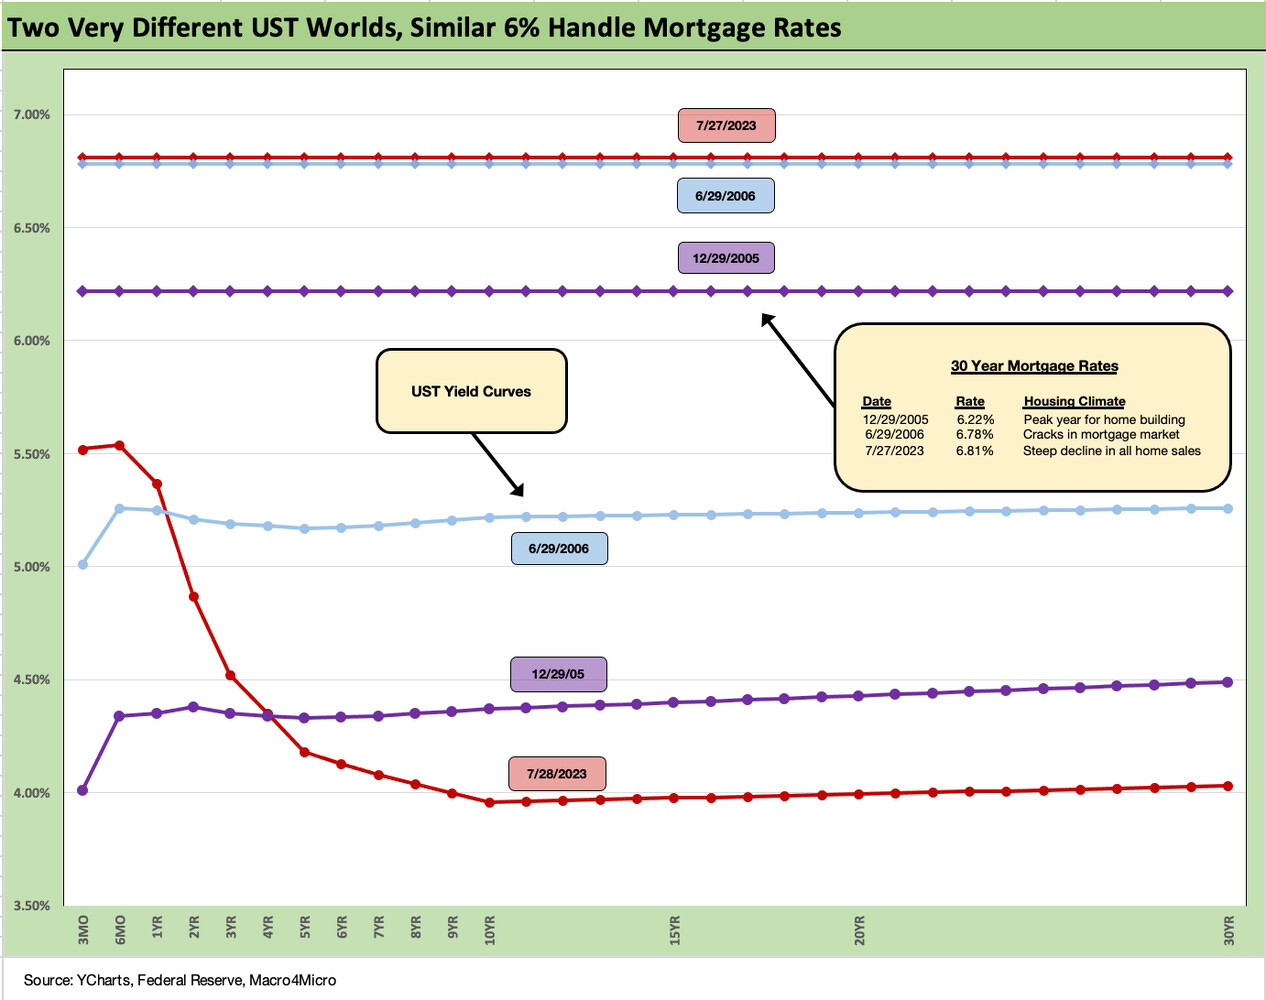
The above chart updates where the Freddie Mac benchmark 30Y mortgage rate stood on its Thursday release relative to the current UST yield curve. As we have covered in past commentaries, the wide mortgage spreads have sent all-in mortgage rates disproportionately higher than what we saw in earlier peak housing markets (e.g., the 2005-2006 housing bubble) when the UST curve was much higher than what we see today. That is why so many strategists seem to be recommending mortgages vs. corporates and UST.
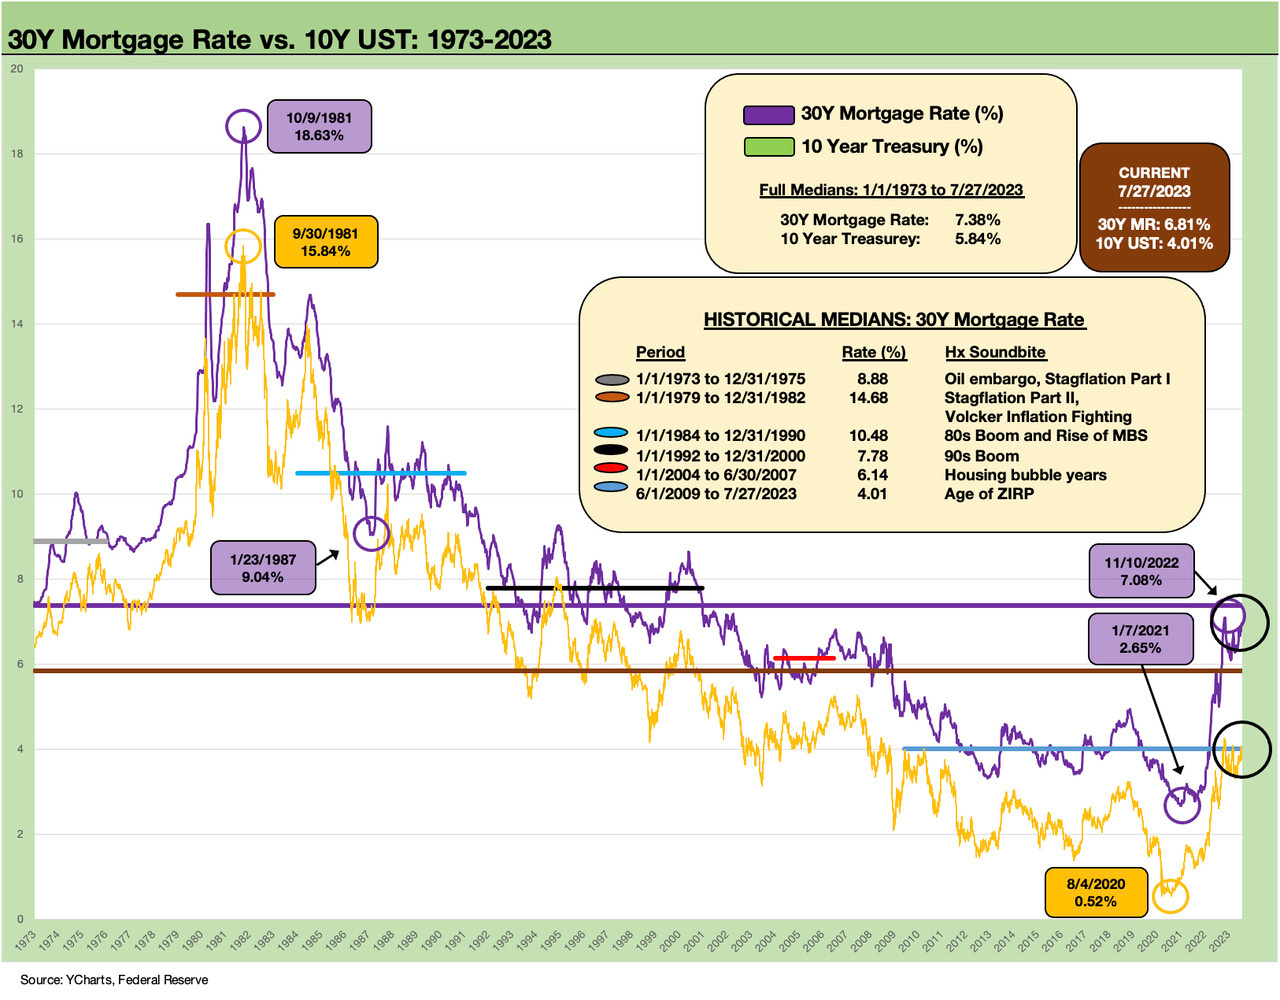
The above chart plots the 10Y UST that drives the 30Y Freddie mortgage markets (the Primary Mortgage Market Survey or PMMS). There has certainly been some wild price action since the 2020 lows of 0.52% on 10Y UST and the Jan 2021 lows of 2.65% on the 30Y Freddie mortgage benchmarks. The 30Y has swung in a 100-bps range YTD 2023 with a 6.0% handle in early Feb 2023 out to over 7.0% with most quotes of late in the high 6% range.
Our takeaway from listening to builders is that more buyers are getting used to 6% mortgage handles and the added incentives including mortgage buy-downs have been very effective. For existing home sellers, the obstacle has been the oft-discussed refinancing barriers for those with low mortgage rates locked in and how that creates a “golden handcuffs” problem (see Existing Home Sales: Bare Cupboards, Hungry Crowd 7-20-23).
As a reminder on how the Freddie benchmark works: “The PMMS is focused on conventional, conforming fully-amortizing home purchase loans for borrowers who put 20% down and have excellent credit… The points quoted in the PMMS represent the average points charged for mortgages offered at the PMMS rate during the survey week, and they have historically averaged around one point.”
The assumed points and quality of the borrower can lead to a range of mortgage quotes on the same day/week away from the PMMS quote. More points translate into lower rates, so those can drive different rate quotes in the market.
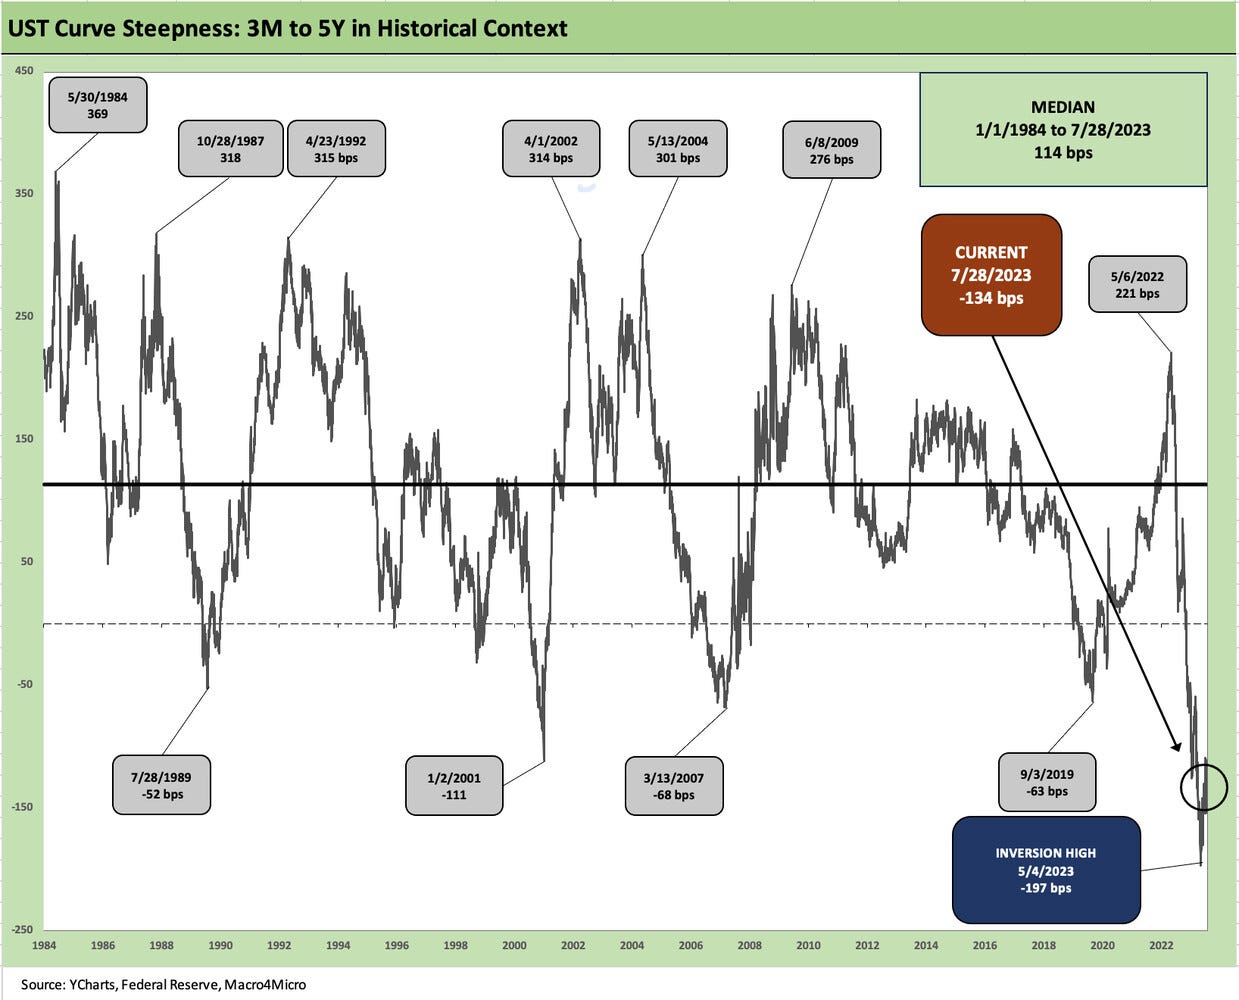
The above chart updates the 3M to 5Y inversion after the latest hike. The -134 bps inversion is well inside the inversion peak of May 2023 when it hit -197 bps. The -134 bps is still higher than all the inversions on the timeline from 1984 including the peak of -111 bps in Jan 2001 just ahead of the onset of a mild recession. On a positive note, this curve ideal for those who cannot make up their mind on the markets right now. Cash at least is not forgone income like in the bad old days of ZIRP.
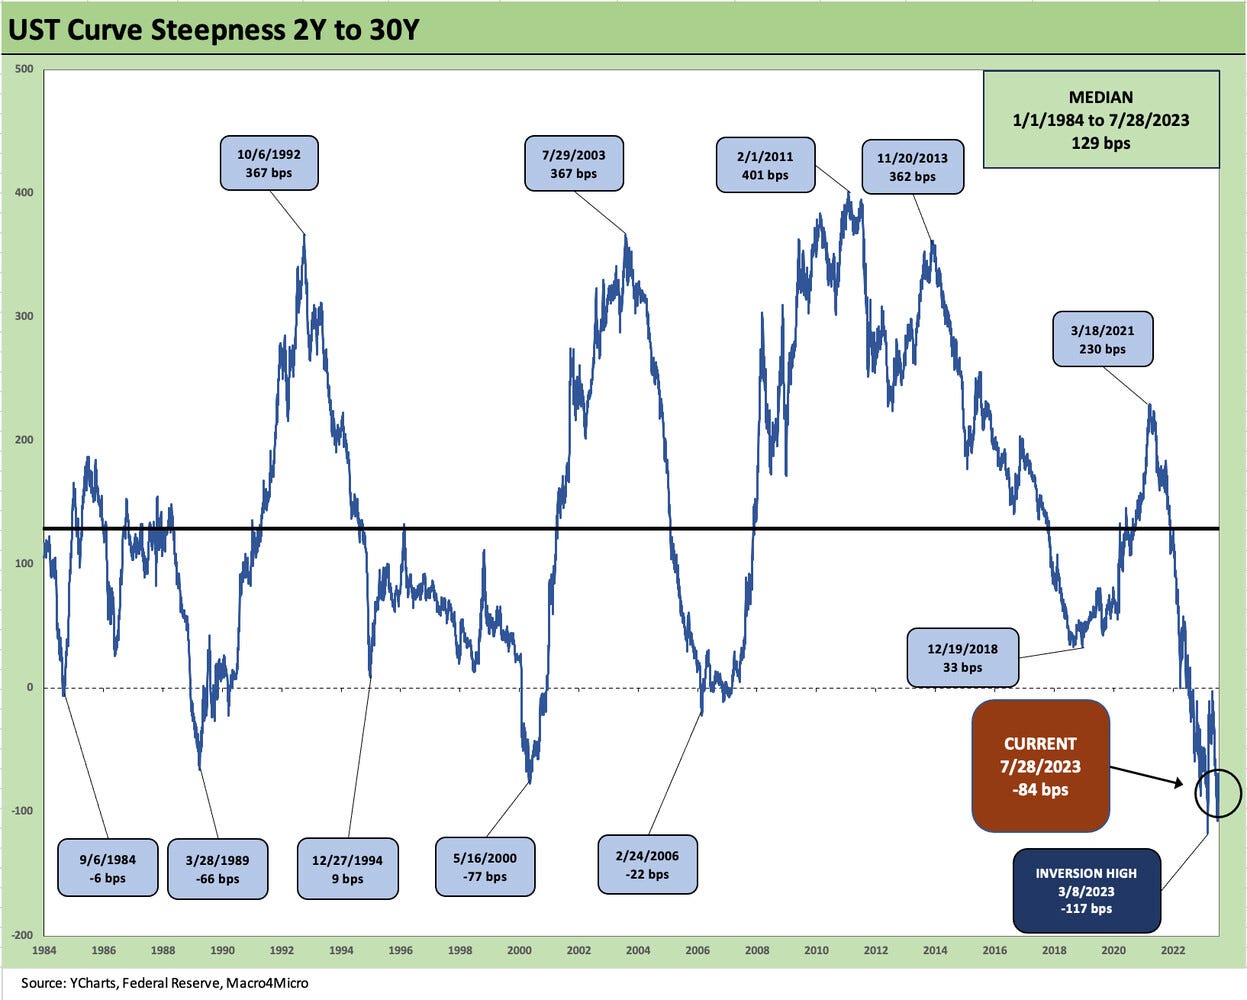
The 2Y to 30Y inversion has also moderated from the peak inversion of March 8, 2023 just ahead of the regional bank meltdown. At -84 bps as of 7-28-23, that inversion is ahead of the earlier cycle peak inversion on the timeline of -77 bps of May 2000 just as the TMT bubble was popping.
We wrap with our post-ZIRP UST migration chart that shows the upward moves of the UST curve since March 1, 2022 ahead of the first Fed hike by mid-month. We also detail the year end 2020 UST curve as a visual on how fast the UST curve headed north even ahead of Fed action on the front end. The post 3-1-22 yield deltas are detailed in the box. That was a lot of duration price pain and total return agony for bond benchmarks in 2022.


