Home Starts, Permits, Construction - Dec 2022
The YoY numbers remain grim, but some mixed relief is showing in sequential trends as mortgage rates decline.
The owners of homebuilder stocks and bonds are likely an intrepid lot if they were in the game during and after the credit crisis, so taking a forward-looking view might come easier for some than others. The data for Dec 2022 displays plenty of grim YoY stats, but the release at least shows some mix of stabilization sequentially with some even better metrics.
We have seen a big 2H22 rally and late year strength in homebuilder securities as value seekers look out over the near horizon. In addition, the cash flow dynamics of homebuilders and high variable cost structures ease more extreme scenarios. The news on volumes will remain ugly for a while in year-over-year comparisons, but a few more months of sequential stabilization would go a long way toward easing the idea that housing is “broken.” That view will ease up on the basic reality that supply-demand favors housing. In addition, having a job in a strong labor market helps you rent or buy when you have to live somewhere. If you need a mortgage, you can’t buy as much house or apartment as you used to, but you may be able to rent more in 2023 than you could afford in 2021.
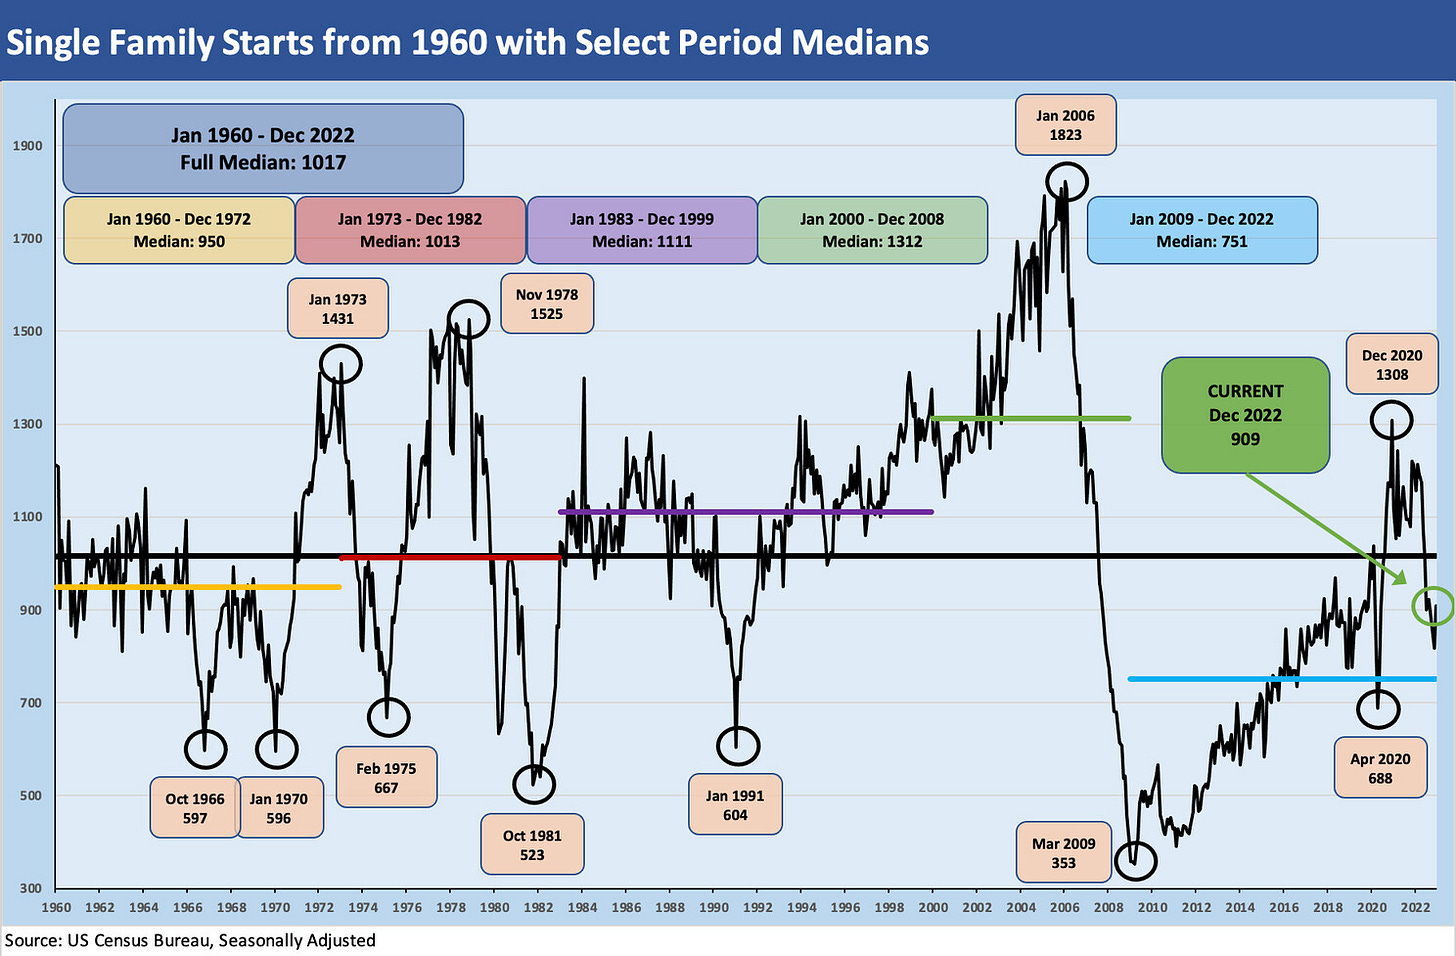
The easy analysis of the latest New Residential Construction release from the Census can focus on the expected brutal YoY declines in starts and permits. That said, some sequential stabilization vs. revised Nov 2022 numbers was also in evidence along with the consistent data highlighting a very high rate of construction activity.
Total permits were down 29.9% YoY seasonally adjusted. Single family permits were down -34.7% and down -6.5% sequentially. Multifamily 5 units or more were down -21.8% YoY but up by 7.1% from Nov 2022. Multifamily permits took a dive in Nov 2022 so the Dec 2022 numbers are still down -10% from Oct 2022.
Total starts were down -21.8% seasonally adjusted and -25.0% for single family. Those sorts of declines will get your attention. The South region as the #1 subgroup (with Texas and Florida) saw single family starts at -25.8% YoY and the troubled West markets -26.4% for single family. The good news was the increase in Dec 2022 of +20.7% in starts vs. the revised Nov number.
The notoriously lumpy Multifamily starts number plunged sequentially by -18.9% along with the -16.3% YoY decline. The fact that permits firmed and starts tanked offers a reminder that the builders play the longer game in a sector with favorable long term fundamentals.
More than a few moving parts in the macro and micro story…
We started posting comments on the housing sector data in Nov 2022 (see Market Menagerie: Homebuilder Fits, Starts, and Permits 11-18-22) as the story lines stayed shrill on the very nasty YoY comp declines. Housing and homebuilding is in a recession now on the mortgage spike shock to affordability, but the market will adjust (home prices and rentals). Homebuilders will plan their community mix and land and development spend according to the reality on the ground as the year plays out.
The builders have seen a lot of tough markets and boom markets before. The freshly printed low coupon mortgages of the COVID refi boom helps ease the pain for most homebuyers of recent years. In looking back across other cycles, the credit excesses of 2004-2006 have little to do with the market backdrop today. The “before the credit crisis” and the transition across the bubble recession is one story. The rebound with COVID, rising demand, and 2% handle 30Y mortgages is another story. The bubble period had a shock tied to the credit-driven nature of demand while the headaches today involve a shock tied to mortgage rates and affordability. The current housing swoon is not a function of a lack of natural demographic demand by a record high number of employed people. That demand story has been a theme on the housing sector as prices soared and demand was off the charts. It seemed like every house that was not on fire would get multiple bids and get sold before the next commercial break. That was not sustainable.
I personally own some homebuilder equities (DHI, LEN) and have a long term view on the sector. Many expect the builders will be major beneficiaries of demographics and the supply-demand imbalances of the market. I started following the sector back around late 2015 just because it was a very interesting sector and a core part of the consumer wealth story. Homebuilding is also a sector that carries a range of cyclical multiplier effects from materials to freight and logistics and other industries including textiles, furniture, appliances, and even pickup trucks. There are some related services industries directly tied to housing such as Real Estate Brokerage and Mortgage Lending among others.
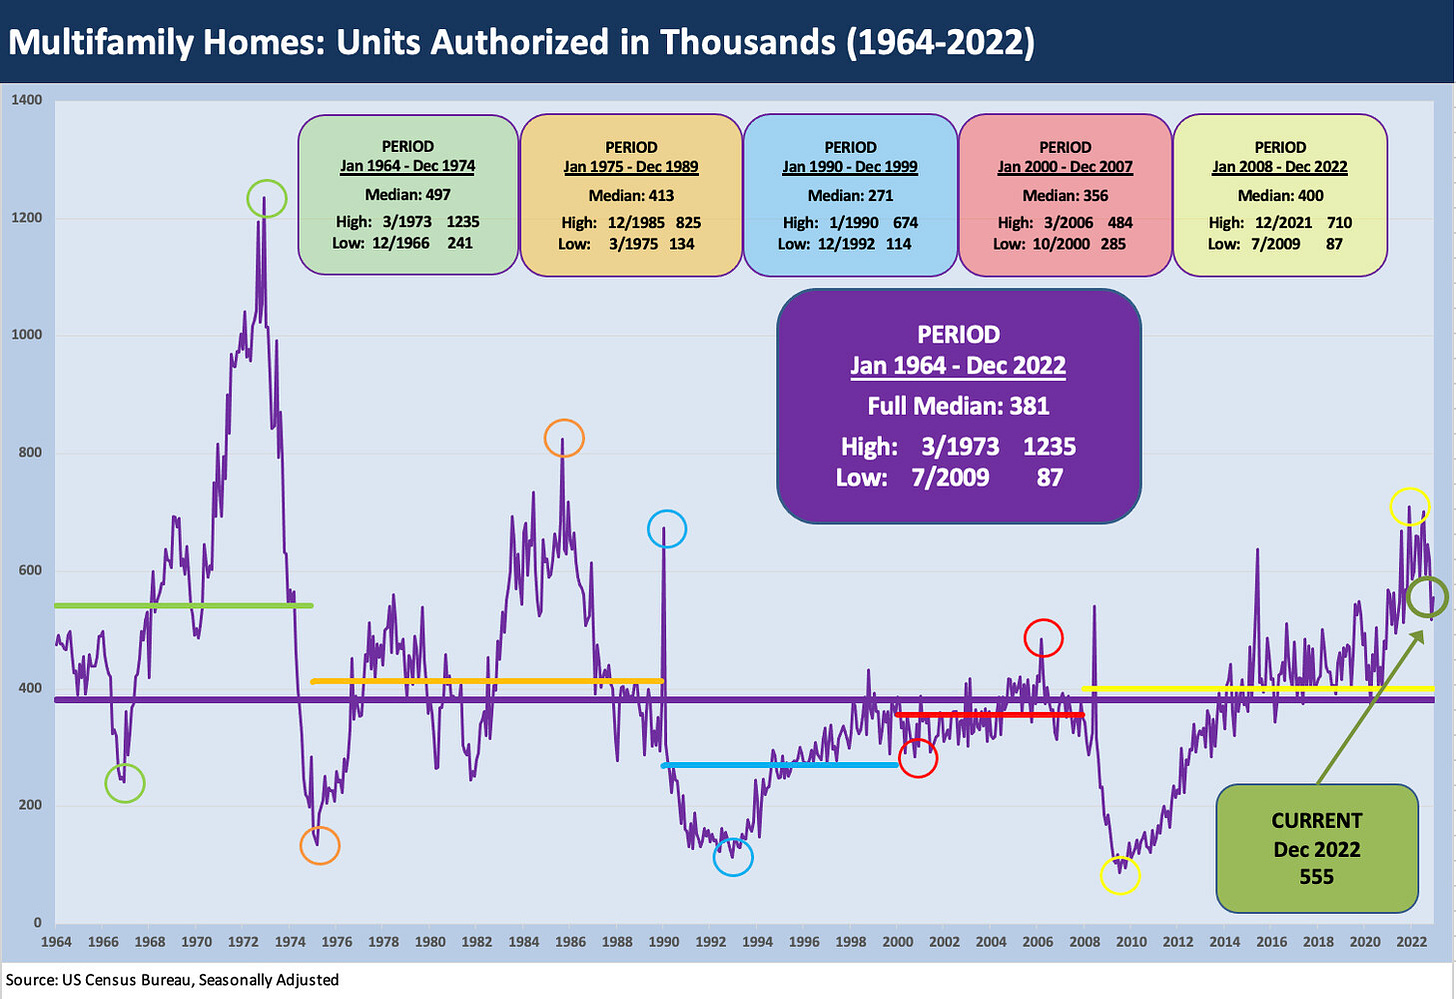
The Multifamily bucket is a very big one these days on a scale not seen since the baby boom demographics helped drive the Go-Go 60s, and then a fresh wave of building into the 1980s boom. The chart above posts the time series and breaks out some highs and lows across some notable time periods all the way back to the LBJ and Nixon years.
We framed some of the trend lines for multifamily last month after permits plunged (see Market Menagerie: Home Starts – Will Housing Nerves Infect Multifamily 12-21-22). This month shows a rebound in permits for 5 units of more. The multifamily activity remains quite high with so many units under construction and the reality of a housing shortage. The debate will rage on around how much rents will need to suffer and to what extent the moving parts in the market will cushion the blows of a theoretical recession.
The checklist of inputs to “solve for X” in multifamily unit demand also as has an “V, W, Y, and Z” collection in the equation. The supply of existing homes for sale on the market is one (that data is updated tomorrow by the NAR). Existing home supply is declining in units but rising on “inventory days/months” given the strain on sales activity with affordability beaten up by the mortgage spike.
The question might be more about seasonal timing and how mortgage rates shake out into the peak building and selling seasons. The rate of production of new homes that are priced on the low end is another variable. The regional balance of jobs and rents (and thus rent vs. buy) might make this whole analysis less correlated across all regions.
The reality of 50-year low unemployment, rising wages, and very high job openings eases some panic. The watchlist on all these factors will keep people on edge as we move into spring. The debate in the market now shows many handicapping hard landing vs. soft landing scenarios or 5% handle fed funds vs. 4% and even 3% handle fed funds to end 2023. In the meantime, those saving their down payments should have some cash to spend short term on a rent decision.
The housing units under construction are plotted above over the time period from the housing boom/bubble of 2004-2006 through Dec 2022. We like to plot the “Not Seasonally Adjusted” for this series since that should more accurately reflect what is happening on the ground. The seasonally adjusted version is at a high of 1,712K, but the not seasonally adjusted numbers are off the highs at 1,680K or the lowest since spring.
The SAAR balance (not shown) for total units was +12.3% YoY while the not seasonally adjusted is +12.0%. Either way, the numbers are very high relative to recent years, and that comprises a hefty mix of economic activity overall in the housing sector. The single-family housing units under construction are also down off the highs of 2022 but are still running quite strong.
Looking out across the year, the cyclical conditions that unfold for the housing market (inflation, mortgage rates, employment, prevailing prices/volumes in new vs. existing homes, rent vs. by economics, variances by regional markets and MSAs) will set the tone on project planning, new community counts, and land spend adjustments.
The fact that the country still sees a material shortfall of supply vs. demand will make the ongoing supply-demand analysis for rental units an interesting exercise. Recent rallies and the outperformance of homebuilder equities came after a smackdown in early 2022 (See Footnotes and Flashbacks 1-16-23), so the market view of sector risk on a forward basis is evolving.


