High Grade Spreads: Defense on the Field
IG spreads are wide to the long-term median in the fall, but the IG-HY OAS differential is still hanging around the median.
In this note, I look at the history for IG Corporate Index spreads. I already posted a detailed look at relative yields for US HY vs. US IG and looked at historical medians across the cycles (see Credit Allocation Decisions: Fish Selectively, Stay Above Water). That followed an in-depth commentary on US HY in multi-cycle context (see Old Time Risk: HY Season Faces Challenges). In this brief piece I update Corporate OAS histories.
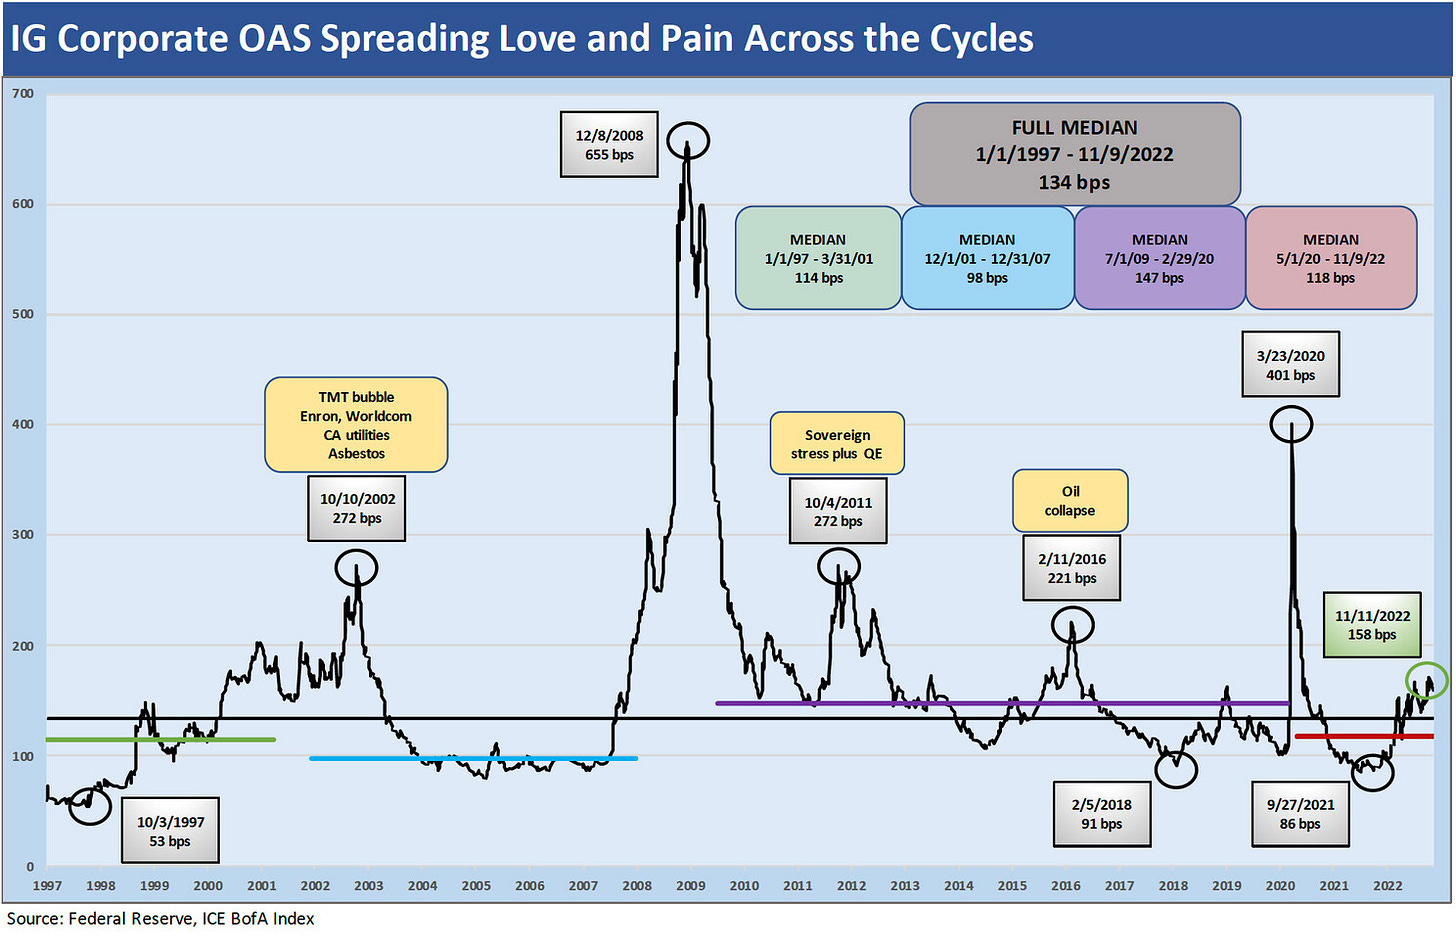
The chart above details the IG corporate OAS (ICE BofA Corporate Index) from 1997 through current times. I cover the main moving parts of the relative value of IG vs. HY in the earlier piece posted today. In the above, current OAS is in the high 150 bps range (+158 bps as of Friday, 11-11-22) vs. a long-term median of +134 bps. The chart frames notable highs and lows in OAS across over 25 years of extraordinary growth, sweeping regulatory change, and a blurring of the banks and brokers ahead of the credit crisis. The crisis drove the eventual disappearance of the bulge bracket broker label “as a thing” after all the mergers and the Lehman Chapter 11. The last two stand-alone legacy bulge bracket members (Goldman, Morgan Stanley) became regulated bank holding companies.
The chart breaks out medians across the timelines using the NBER dated business cycle expansions for a frame of reference. To be clear, the start date in the spreads time series is during 1997 given OAS data availability. The time series does not start with the March 1991 recession trough date that marked the beginning of the 1990s expansion. The post-1980s cyclical downturn started in July 1990 and ended March 1991.
The current OAS of +158 bps to end last week is higher than all the expansion medians with the closest cycle being the median from July 2009 to Feb 2020. The +147 bps median for that period was across a timeline that ended up being the longest postwar expansion (See Expansion Checklist: Recoveries Lined Up by Height). That IG credit cycle was dominated by ZIRP and QE as well as sovereign crisis backdrop that started in spring 2010 (Greece) and peaked in Oct 2011. The IG debt markets will be locked in on any signs of European cracks in the coming winter with high inflation and onerous defense funding commitments that run alongside the need to take geopolitical sides in the war driving much of the household and economic stress. Some nations might falter in that commitment.
IG spreads today are materially wider than the late 1990s stage of the TMT cycle with its +114 bps median. Banks were healthy in the 1990s cycle, but some brokers were facing outsized risks in 1998 when LTCM hit the skids on margin calls, EM contagion was in the headlines, and the Fed briefly eased to deal with it. I cover those periods in other commentaries. The amount of capital pouring into the credit markets during the 1990s as banks entered the bond market ranks as the lead structural factor in the period. Those years also saw soaring derivatives use and steadily rising counterparty risk as banks locked in on the higher margin operations such as CDS. The risk impact of that trend was underestimated in terms of bank interconnectedness risk. That was discovered more painfully during the following cycle.
IG OAS now is also much wider than the abbreviated business cycle seen from 2001 to 2007 with its compressed +98 bps median. That tight OS backdrop came ahead of the systemic crisis when IG spreads saw a very ugly OAS spike with the US and European bank systems under extreme pressure. That period has a checklist of threats that was not a short one and includes refi fears around backup lines for commercial paper and counterparty risks that called into question market risk hedges (See Wild Transition Year: The Chaos of 2007). The cloud over the ABS Commercial Paper market added to the worries around where companies would fund and how secure credit availability would prove to be if banks stayed under systemic pressure. The domino risk factor was high. We know how that crisis ended now. For purposes of the above expansion median, that period after the Dec 2007 recession start date was not factored into the +98 bps expansion median. However, that period was included in the full median of +134 bps.
HY vs. IG Quality Spread Differentials
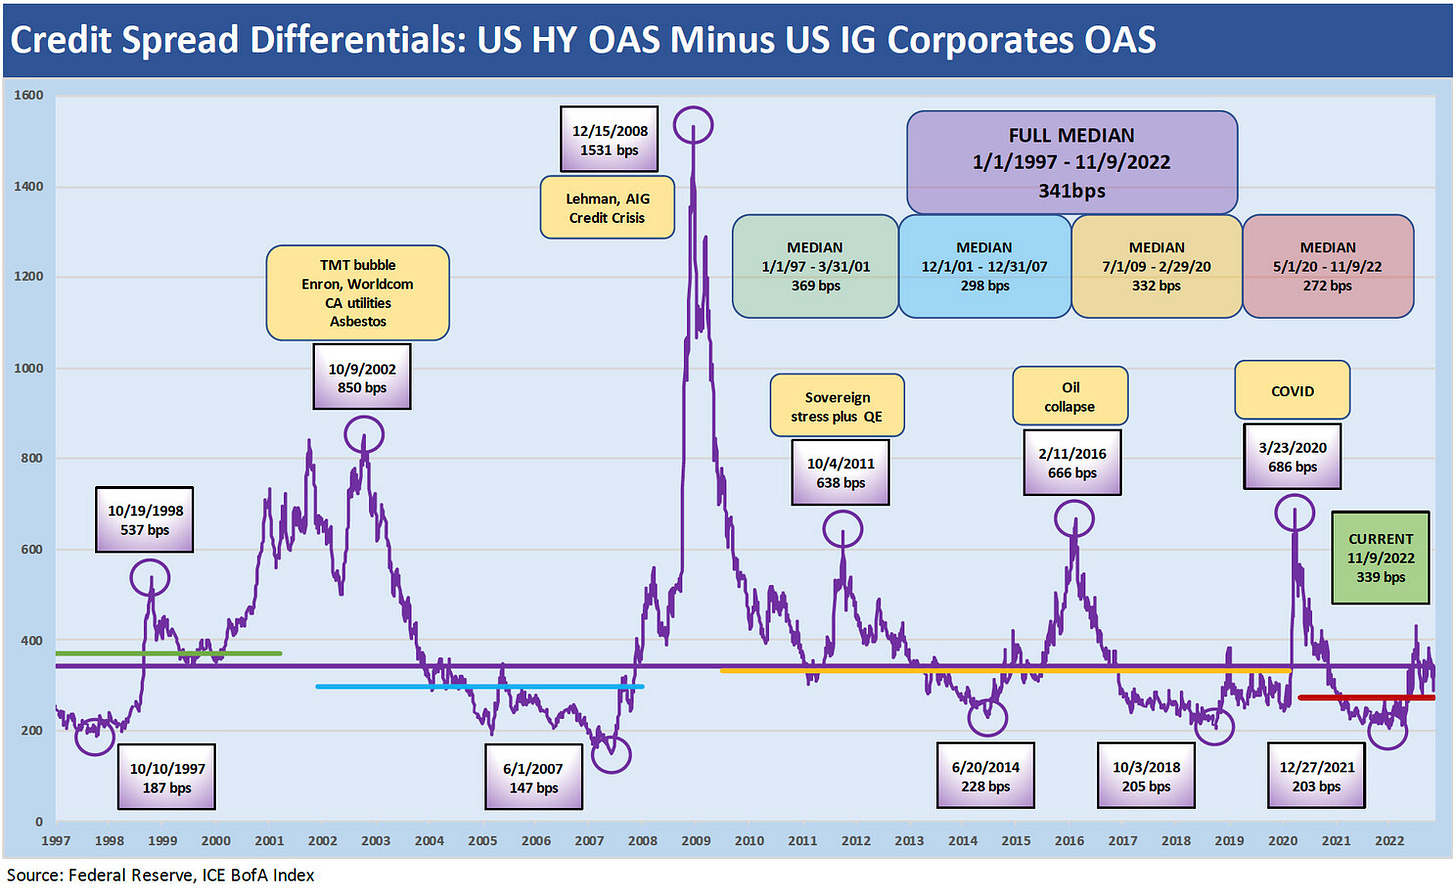
The following chart plots HY OAS minus IG OAS for a frame of reference on quality spread histories across the same timelines as addressed above. The quality spreads capture the incremental compensation for moving down the credit spectrum from the investment grade basket into the speculative grade basket. The long-term default rates grow exponentially as you move down the tier of US HY, so there are plenty of other slices and dices that can be done across credit tiers over time.
The peaks and spread spikes of the HY market tend to eventually dull the senses after you have looked at them enough or considered the swings in CCC dollar prices across bouts of risk aversion, fundamental stress, or systematic risk episodes. The long-term median in this chart shows +339 bps through the pricing date above (11-9-22). The tweaks after the CPI number to end the week do not change the conclusions. The latest quality spreads are essentially long-term median spread differentials at a time when the market is heading into a period of material uncertainty. So, this is not a median credit risk market. The medians from the expansion periods are lower than the current differential, so that is a source of support if the expectations are for minimal recession risk in 2023. This is not the case.
My expectation is that quality spreads widen into 2023 on the factors I have already laid out in earlier pieces. The weight of sustained inflation (even as it ticks lower across 2023), weaker consumers with diminished purchasing power, higher unemployment, setbacks in housing/homebuilding, tighter credit conditions, and slowly rising default risk expectations will take a toll on risk pricing.
A note on the picture at the top of this piece…
The “Steel Curtain” was the name assigned to the legendary defensive line of the Pittsburgh Steelers, who won four Super Bowls in six years with two of them during recession periods of 1975 and 1980. There was no inflation in the opponent’s yardage in those years. The Steel Curtain moniker was a play on Winston Churchill’s Iron Curtain, which is a topic today given the ambitions of Putin and his war against Ukraine. Mean Joe Greene of the Steel Curtain also made the most famous sports commercial of all time. I used to visit Pittsburgh in the early 1980s. One of the first industries I was assigned to on the buyside were the Integrated Steelmakers. That did not end as well as the Steelers Win-Loss history.


