Footnotes and Flashbacks: Week Ending March 12, 2023
For most market watchers and participants, the week ended Sunday night around the SVB action, so we moved the timing on our weekly.
This Week’s Macro: Broad index returns for equity and debt; UST curve rallies sharply on bank system angst with SVB; ETF benchmark 1-month and 3-month returns get uglier; Running bear flattener differentials since ZIRP ended; We update 3M to 5Y slope and look at 2Y to 5Y.
This Weeks’s Micro: This week was all about Silicon Valley Bank at the Macro and Micro level; We update the setbacks in Housing securities through Friday as mortgage rates whipped higher and now into lower mode with the banking turbulence.
MACRO
The past week was a wild one wrapped around a rare run on a large bank in the form of Silicon Valley Bank (SVB). SVB had over $200 billion in assets (Top 20 bank) and “held” (“holds” may be optimistic now unless a great purchaser shows up) a lofty position in the ecosystem of venture capital, tech, and life sciences. SVB sat at the core of the entrepreneurial wave in Silicon Valley that started to soar during the 1990s, recovered from the TMT crisis of 2001-2002, waded through the credit crisis of 2008, and then kept projecting the US to global leadership in tech and innovation.
SVBs growth soared since COVID. We looked at what all that growth meant on commentaries from Friday to Sunday (see Silicon Valley Bank: Depositor Frames of Reference 3-12-23). The stunning increase in deposits and total securities holdings (in both Available For Sale and Held to Maturity portfolios) raised the stakes on skill set needs. That growth should have set off alarms around risk management and asset liability priorities, but the management team violated the Bay Area Dirty Harry Rule (A man has got to know his limitations).
The regulators will be investigating the practices and seeking examples of what not to do for other banks with similar unrealized loss exposure. That said, many aspects of SVB were quite distinctive to that bank. The problem began with the losses and liquidity management before ending with the run. So the losses apply on a broader scale across markets even if the depositor profile does not.
In the end, the regulatory and banking frenzy had a good outcome for SVB depositors (see SVB Reprieve: Hail Powell the Merciful 3-12-23), but the taint on regional banks with large unrealized losses is not going to go away any time soon. The broader risk “spidey senses” have been hit with more than a mild shock and there will be more “sell now, ask questions later” impulses (even if just on a name-by-name basis) as we see in bank equities today. The confidence in the Fed around deposits at least is strong after decisive action on the weekend.
Let the second guessing begin in policy actions…
We already are seeing the political noise grow louder from the right and the left. That will keep risk sensibilities raw. Politics has the usual mix of honesty amputees, but this one is a lot like the credit crisis in one regard. Neither Bush nor Obama wanted to let a meltdown happen on their watch during that 2008 election transition period. The one who might take the blame does what they need to do in order to avoid the blowup. In this case, more than a few would love to see a crisis unfold. This one would have been blamed on Biden ahead of an election year even though the Fed was the primary decision maker. Of course, the US Treasury (Yellen) was also in the process with their part of the backstop support. While it is part of counterfactual scenarios, we would expect the exact same thing would have happened under Trump and Mnuchin with Powell.
The Silicon Valley Bank’s collapse is all the more bizarre given the brainy crowd they run with. The natural reaction in the market and broadly was to ask how a bank in that position could be so incompetent in asset-liability management and so devoid of basic common sense in risk mitigation practices yet still be at the epicenter of entrepreneurial finance. That poor grasp of basic financial concepts made the management team one that will get roasted in coming weeks (they were last seen hitchhiking to the border). Their performance was bad enough to qualify them as having the financial markets IQ of a median member of the House of Representatives. We expect they will all be meeting in the near term.
Comparative Asset Returns
The markets were behaving very badly last week for very diverse reasons. The fears of a 50 bps hike were being fed by strong numbers in the economy. That was notably the case in another round of solid jobs numbers (see A Fresh JOLT but No Shock 3-8-23, Initial Claims: Historical Context on what 211K Means 3-9-23, Employment Feb 2023: Forcefully Ambiguous, Definitively Mixed 3-10-23). Then the SVB adventure began with a vengeance on Thursday and peaked on Friday into the weekend. Friday’s job strength elicited a big “Who cares?!.” The UST curve ran quickly in the other direction (see Silicon Valley Bank: How did the UST Curve React? 3-11-23).
The overriding theme during the week was that fears of bank safety can have very bad endings in risk appetites with the effects running from defensiveness to risk aversion. The regional banks and their “parallel risk profile” were being sorted out to end the week since unrealized securities losses were such a focal point for so many. That is just bond math and duration risk but naturally the desire is strong to find out what else might be wrong beyond depositor risk whether on the risk management side or in the asset base. The very distinctive and idiosyncratic nature of the deposit base at SVB was discussed as a risk feature but not prioritized. The unrealized losses remain at the top of the list as underscored by term loan support at “par” collateral value and not at fair value.
The asset returns are dialing back the YTD numbers and some into negative zone…
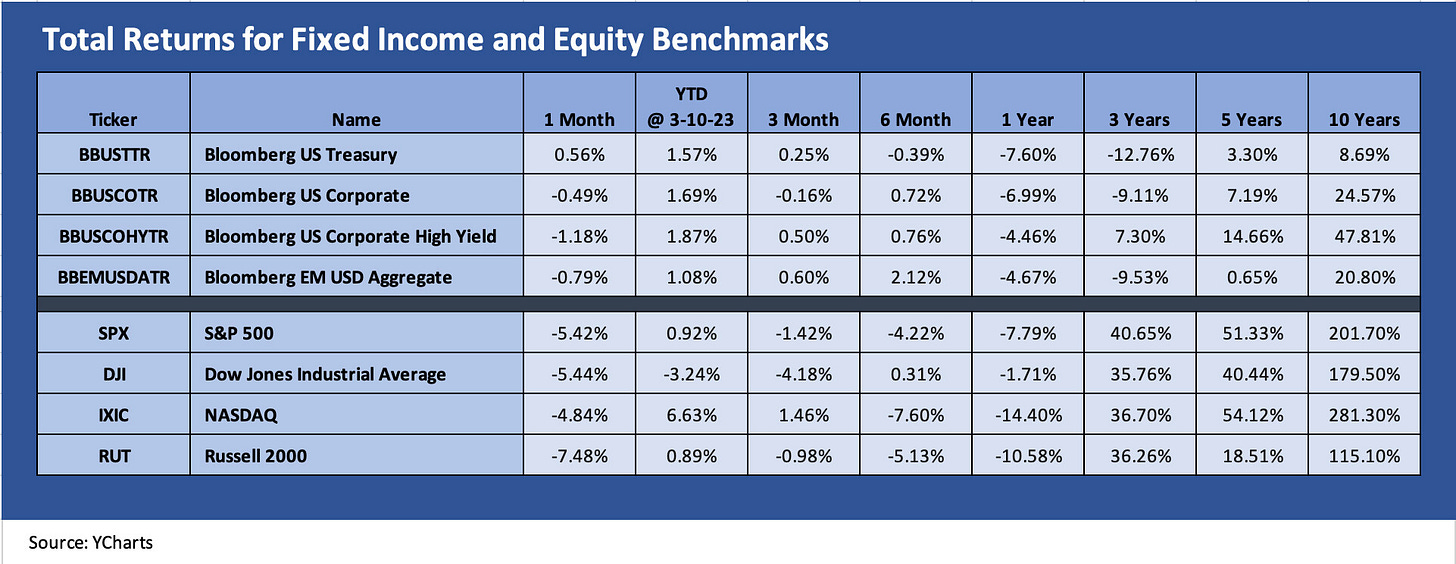
The total return benchmark indexes across debt and equity as detailed below remind us again that outsized rallies to start the year are often part of a “hope springs eternal” effect. As darker reality sets in now, the SVB episode gets investors refocused on the yield curve, inflation concerns, cyclical risks, and a very unstable world. These all present a major challenge in the weeks and months ahead.
With CPI out this week, the word stagflation will get into the discussion in a bigger way. Hints of credit contraction will be in the air with banks nervous about making mistakes on the asset side since some headliners screwed up on the liability side. The fact that the duration risk on the asset side roiled the markets might make more banks less inclined to mess up the credit risk side.
The chart above reflects a bad month for risky assets with US HY seeing almost a 39 bps widening MTD March (per ICE BofA) with most of that on Friday. IG spreads held in better and even got some duration relief to end the week. All equity benchmarks sold off with small caps feeling it worse looking back a month.
The Longer Tail in Equity Benchmarks
Below we update the broader 1500 and 3000 equity benchmarks. The returns are feeling the pain and eating into most (or all of) the January winnings.
Real Estate and Financials are showing the worst performance over the past month. Rising interest rates intrinsically shorten the real estate cycle and inversion gives NII margins trouble. Now the bank sector shade means some ill-defined worries around other risks ahead. That is despite the deposit support demonstrated by the Fed. Energy is seeing the effects of WTI in the lower half of the $70 handle range while natural gas is comfortably under $3 after being at high single digits in the summer. Industrials are still hanging in positive YTD territory with more indicators out this week including Industrial Production.
ETF Subsector Differentiation
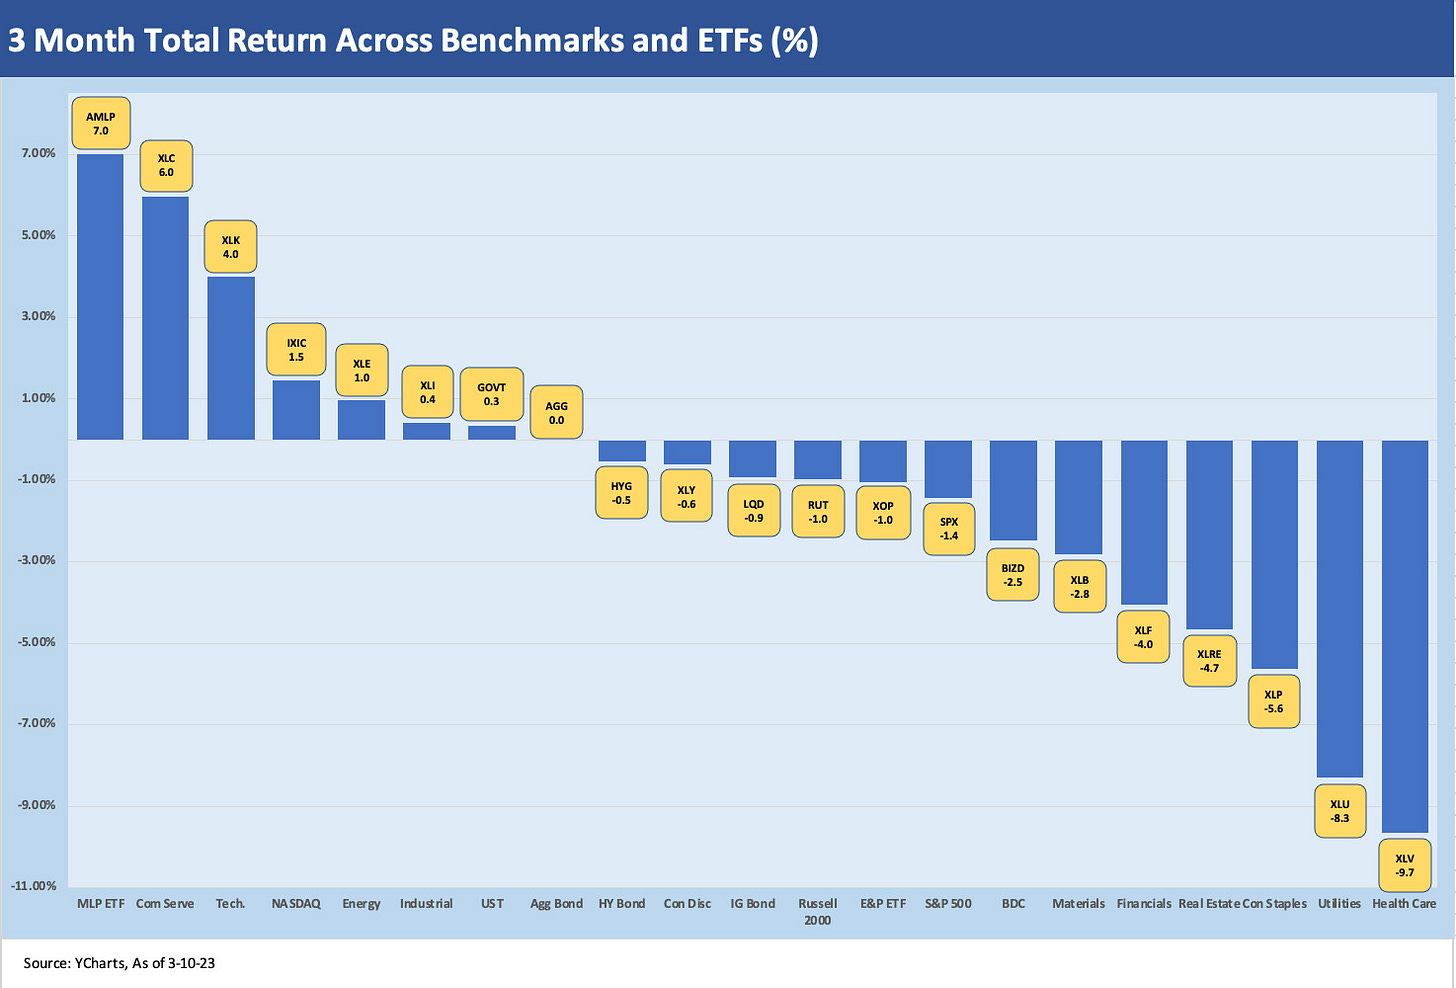
Below we break out a wide range of ETFs by subsector including some fixed income asset proxies and the broader equity benchmarks.
1-month trailing time horizon
The 1-month time horizon on the ETFs show a single ETF in positive territory (GOVT was barely positive) and 20 negative. Duration made a comeback over the last two trading days, and we see AGG at #2, LQD at #3, and HYG at #4. Sitting on the bottom is Real Estate, Financials, Energy and BDCs.
The BDC hit this month (5 spots off the XLRE position at the bottom) ties into the questions around where asset quality might head from here, especially given the large base of small cap and microcap names at SVB generally and at the regional banks. The nature of private credit will get revisited after all of the regional and small cap bank concerns. Some of the BDC equities also have a tendency to sell off with the broader market and correlate with the “1500 and 3000” checklists as detailed earlier. Some have exposure to some of the same sectors that are part of the profile of SVB counterparties. One school of thought is that BDCs will have more pricing power with tighter credit at the banks. Another is that the Fed will dial back hikes and take the luster off floating rate assets.
3-month trailing time horizon
The 3-month time frame has 7 in the positive zone, one at zero and 13 in the red.
The post-ZIRP migration deltas along the curve are updated above show some diversity with GOVT and HYG straddling to the left and right of zero for AGG, so that is a reminder that the income has mattered as prices were hit. At #1, we see the Midstream MLPs in the AMLP ETF. Following that, we see #2, #3, and #4 showing TMT and the tech-centric NASDAQ benchmark. Then we flip to Energy and Industrials. These diverse sectors underscore how much we have seen industries move around across the trailing 3 months. Some have flipped from the highs in one month to the lows the in the next.
Yield Curve Migration
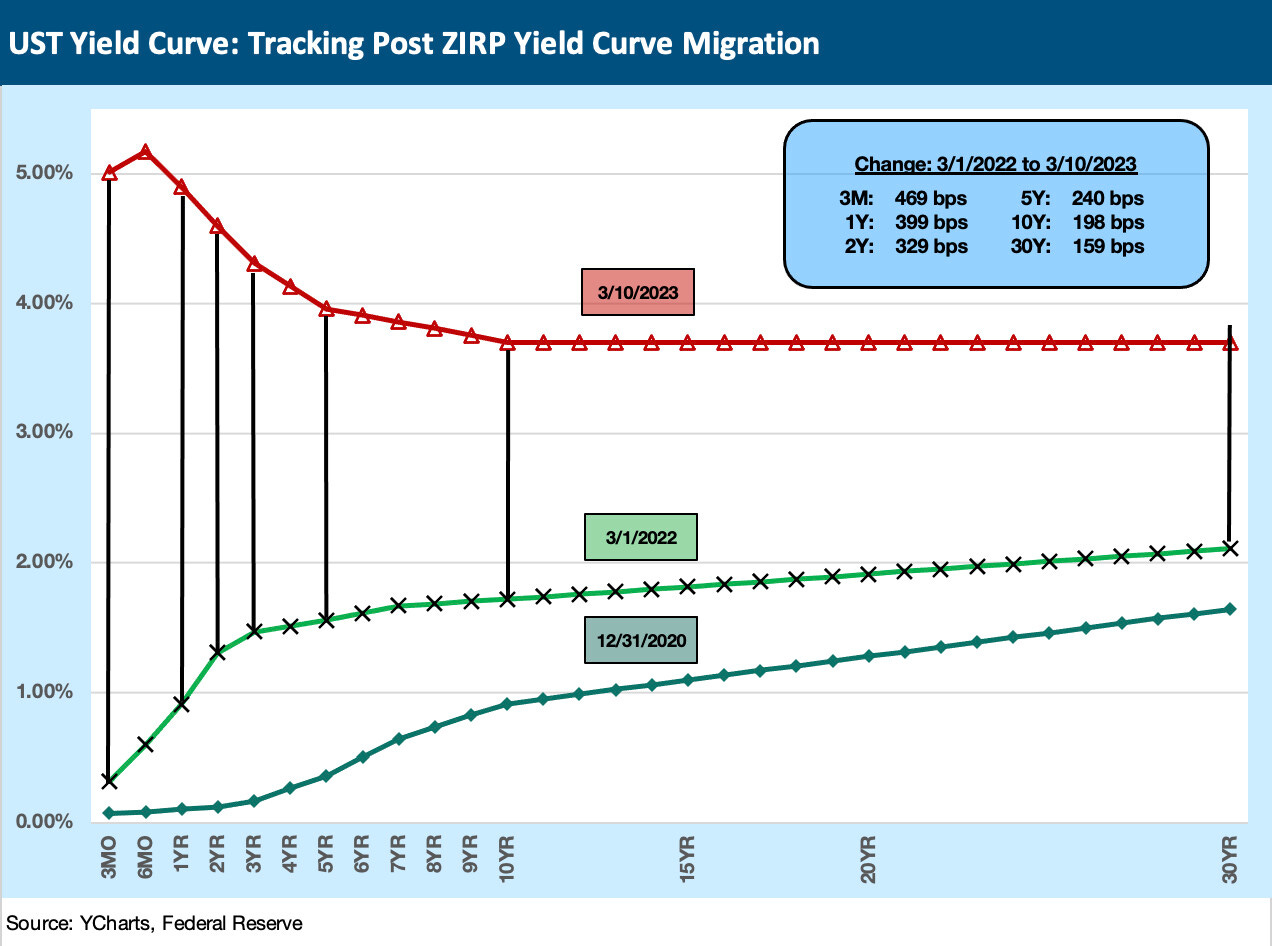
We already looked at the bear flattener move cumulatively and across some slopes when we reviewed the UST curve response to the SVB events (see Silicon Valley Bank: How did the UST Curve React? 3-11-23). We update the upward migration of the UST curve since the end of ZIRP each week. We saw contraction of the differentials this past week for all but the 3M UST, which is somewhat more tied to the fed funds rate. The old adage that the Fed controls the short end and the market controls the long end is alive and well. Two weeks ago was mixed in the sequential weekly differentials after some weeks of steady adverse moves for duration.
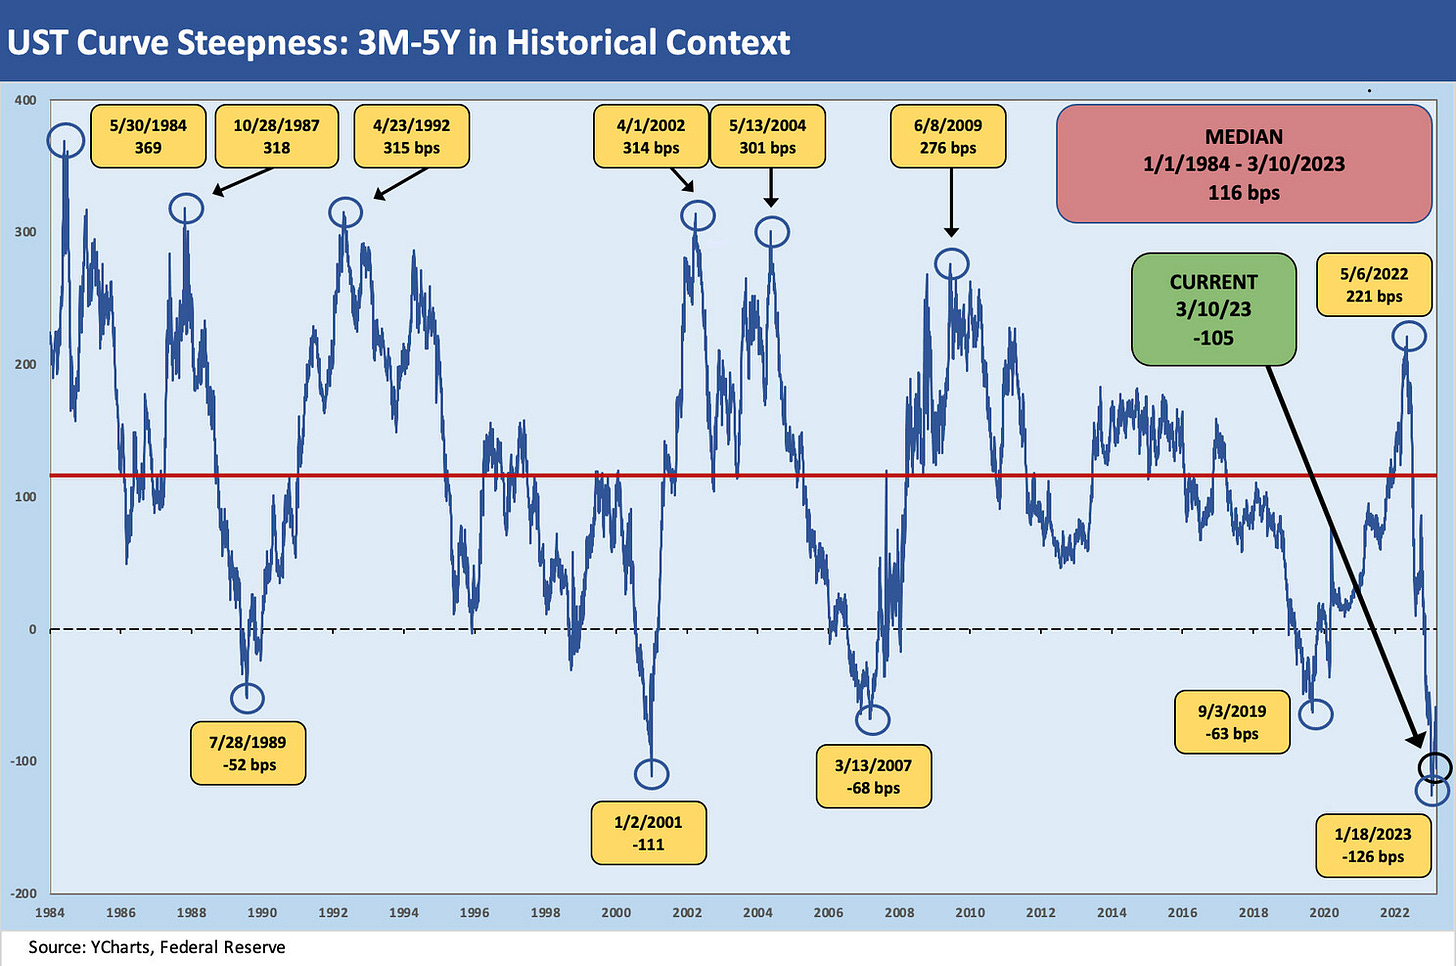
The 3M to 5Y slope was also addressed in our Saturday comment. The inversion is alive and well and the yields on the front end remain more compelling when the moving parts of inflation and Fed policy are so uncertain. If one believes cash rates will go lower, then in portfolio context that means you have a view on Fed policy and perhaps see either recession scenarios getting pulled forward or inflation easing. Those two are not joined at the hip since stagflation can also be on the menu. Our view on the inversion has been detailed in past commentaries, but in this case the fear of volatility and credit contraction is an easier tie to recession risk and slowing of UST migration higher. The fear of stagflation is going to get more play in the scenario debates ahead.
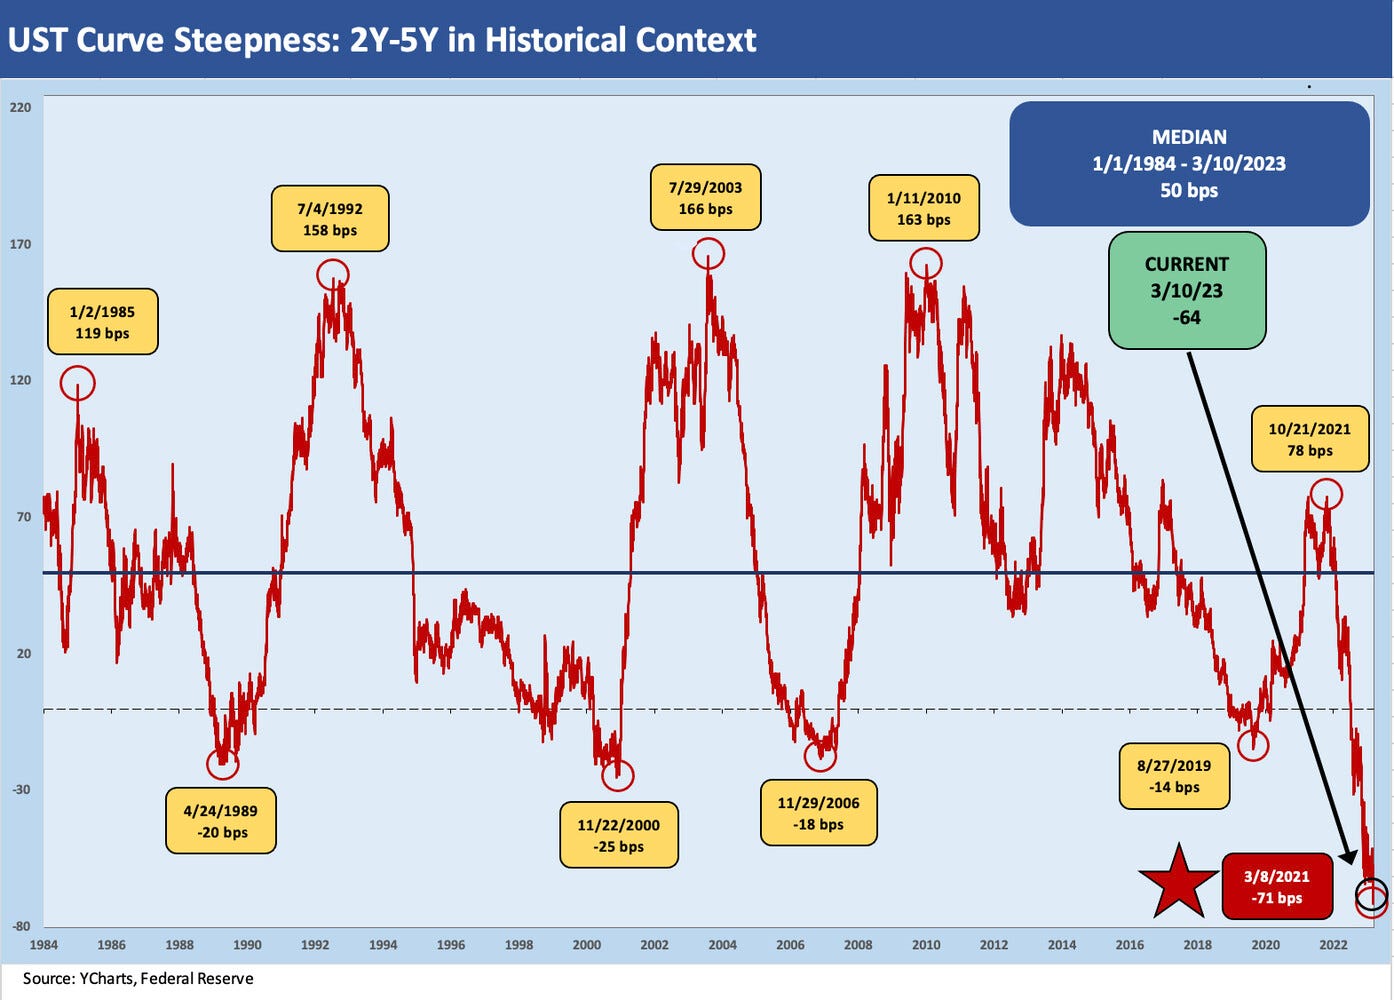
The 2Y to 5Y UST moved into a rarefied zone this past week, and the inversion hits its highest since the Volcker era. The 2Y has been moving rapidly after the inversion peaked on Thursday before the SVB pyrotechnics were set off. As we go to print, the 2Y UST yields were down around 60 bps this morning and are down 44 bps. They are jumping around as we go to print.
MICRO
For this week, the world of micro for most of us seemed to be all about Silicon Valley Bank. The micro level shocks that will evolve could play out across the bank sector as investors wrestle with the moving parts of lower UST yields and question how the Fed will flow this latest series of events into its meeting next week after the CPI number pops up tomorrow and PPI the next day.
In the interest of keeping our focus more on developments coming out of the SVB crisis, we kept our additional “Micro” work brief the last few days. We are hoping to get a clear read this coming week and next week on how the regulators will be approaching monetary policy for the next meeting with such a glaring problem staring them in the face at SVB. A big question is how the regional bank concerns could turn into a bigger risk aversion problem around the massive unrealized losses that have built up in the securities portfolios of the major banks and regionals. The irony of the stress is that the unrealized losses on the securities portfolio can go lower as the UST curve shifts down.
A little housing sector music…
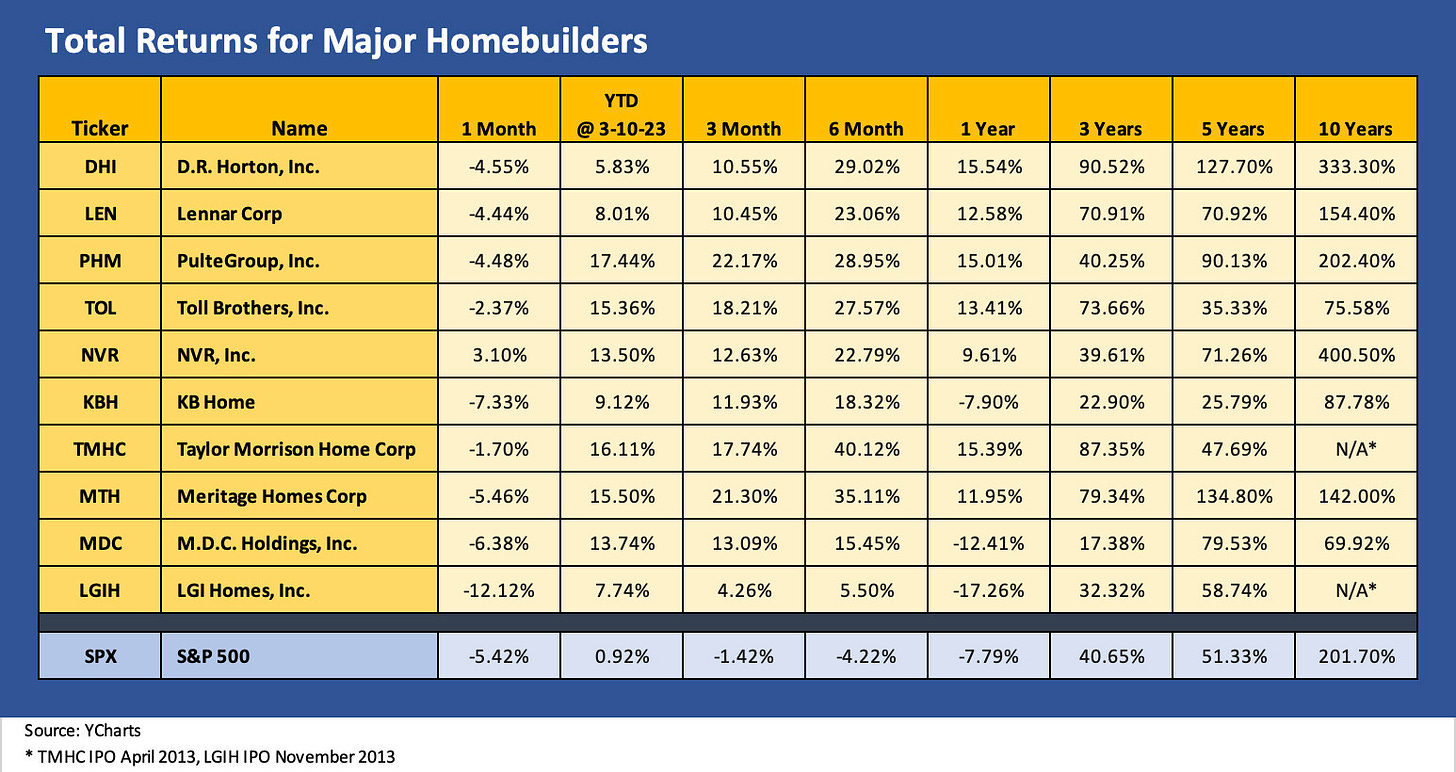
Below we update the stock return charts for the homebuilders and in the second chart for the housing related services sectors.
The swings in interest rates are going to give housing exposed investors the bends. We saw the 30Y mortgage get down close to 6% and then bounce back up above 7%. Friday saw the move lower by almost 25 bps depending on what source you look at. The mortgage rates key off the 10Y UST and today and the 10Y UST is down by another 18 bps as we go to print (was down by more earlier in the day) and stands at 3.5% after flirting with 4% before SVB. Builders are actually rallying today. In services, Anywhere (HOUS) up by almost 8% by midday (see Credit Profile: Anywhere Real Estate 3-1-23).


