Footnotes and Flashbacks: Week Ending March 3, 2023
We look at multiasset returns, the latest UST shift, the 5Y to 30Y UST slope, and the low risk financial profile of the oil sands sector.
The kinder gentler oil sands have arrived.
This Week’s Macro: Broad index returns for equity and debt; UST curve quiets down this week; ETF benchmark 1-month and 3-month returns; Running bear flattener differentials since ZIRP ended; 5Y-30Y slope update.
This Weeks’s Micro: Canadian Natural and MEG Energy wrap up reporting season for the major oil sands players; Carvana’s interest expense bill is otherworldly vs. negative EBITDA.
MACRO
Comparative Asset Returns
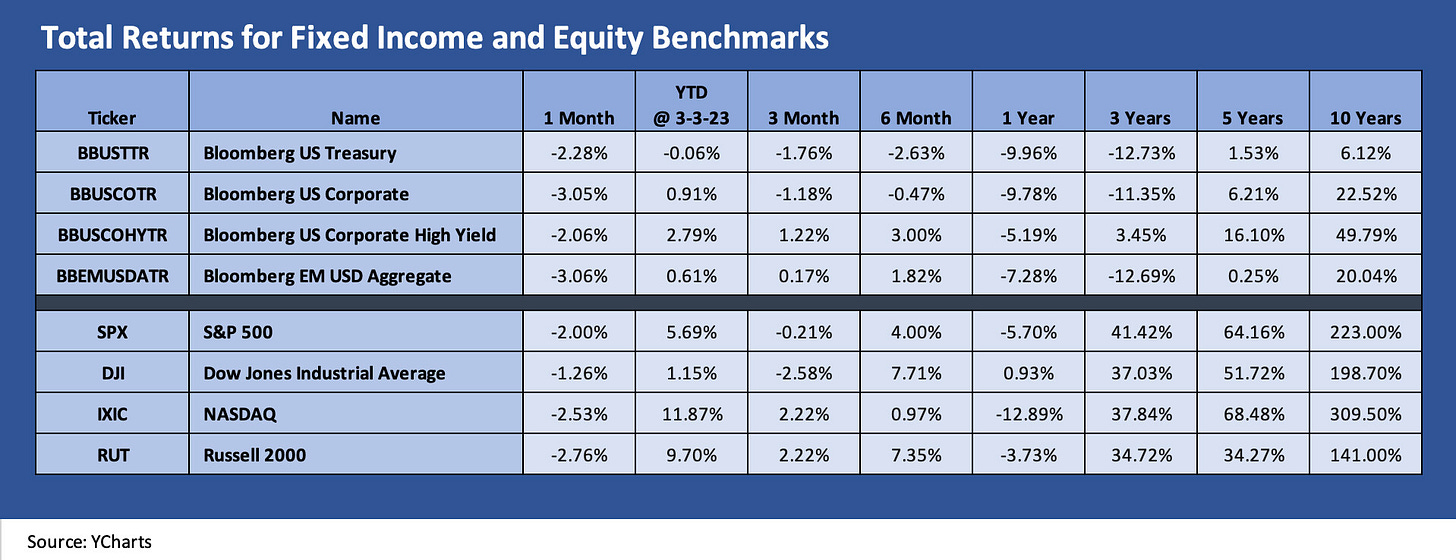
Below we frame a mix of debt and equity broad market benchmarks with the fixed income benchmarks all coming up empty and negative for the 1-month period. YTD, only UST is the red while US HY had another solid week of spread compression and a very good YTD run at +2.8% total return even in the face of adverse curve moves.
The running debt and equity benchmarks above show the January rally getting reeled in by duration hits and impacted by a few weeks of mixed reactions in equities. The UST curve and related speculation is a topic that is not going away any time soon, but so far fundamentals in credit (notably excess returns in US HY) have put credit risk in the driver seat YTD and duration on the front burner of the worry lists for total return.
This coming week will be a fresh test with JOLTS on Wed and Employment numbers Friday. The earnings season is done at this point but with some important non-calendar reports due in coming weeks (FDX, LEN). Employment will get a heavy amount of focus given the stakes. Initial claims (due Thursday) have stayed low in historical context. We had looked back across the decades for initial claims histories earlier in January. In that commentary, we framed various medians across notable time horizons (see Employment Fixation: The Needle Will Move Very Slowly 1-3-23). The tech headlines have barely moved the needle.
Overall, initial claims remain quite low in 2023, and the market even dipped down into 100K handles in early January after spending most of the 4Q22 period with 200K handles. The current weekly rates are well below anything on that median list (including a 300K+ long term median) that we broke out. The low run rate now comes despite record population size and record payroll numbers today. That allows for ample downside in jobs from here, but the numbers in 1Q23 have been better – not worse.
The longer tail in equities…
Stocks are getting reeled back in across the “1500 and 3000” benchmarks as noted above. Energy and Industrials (barely) are positive over the trailing 1-month period, but both value and growth turned negative. Russell 3000 growth is still rolling YTD despite the adverse yield curve move, and the same is true in financials.
Life gets a bit tougher over the trailing 3 months as a reminder that there is a lot of year left for the UST curve vs. fundamentals dynamics to play out. The moving parts of China, Europe, and the US have a lot going on from macro to micro with China looking to get the growth momentum going again. US employment is still the anchor in the US GDP story.
Energy has the biggest winnings looking back across the period from the Russian invasion of Ukraine, but energy has been fading lately trailing 3 months and YTD. Real Estate and Growth were hit hard LTM on the yield curve impact as is shortens the real estate cycle.
Away from the US macro theme, the short form story for Europe is that it dodged the scary winter scenarios. Natural gas inventories are getting positive headlines for national security but with negative headlines for the major losses incurred given the cost to stock up ahead of the peak heating season. The high inventory will hopefully not lead to complacency around the need for more US-Europe coordinated dialogue on energy infrastructure and supply plans. For now, they are mostly fighting over the IRA clean energy tax discrimination.
ETF subsector differentiation…
The next two charts highlight returns for a range of ETF subsectors by industry group. We update these each week for trailing 1-month and the 3-month periods to smooth out the short-term volatility. We also mix in some broad index benchmarks with the ETFs.
The 1-month time horizon…
The ETF lookback across 1 month shows 15 in the red, 5 in the black and one sitting at zero.
The mix above shows Energy (XOP, XLE) mounting a quick comeback after some beatings in prior weeks but with Midstream hovering around flat. The BDC earnings season has been a very solid one as we discussed in our last weekly (see Footnotes and Flashbacks: Week Ending Feb 24, 2023 ). Strength in Energy, Materials, Industrials, and small cap leveraged loans is not a sign of cyclical risk aversion.
The 3-month time horizon
The 3-month ETF total return scoresheet shows 12 positive and 9 posting negative returns. Duration has weighed on 3 of the 4 fixed income ETFs (AGG, GOVT, and LQD) while credit risk wins with HYG in the last slot on the positive side of the ledger.
The mix of ETFs in the positive zone include a lot of the 2022 full year victims (see The 2022 Multi-Asset Beatdown 12-31-22) from the TMT-centric issuer base (Communications Services) and growth benchmarks (XLK, NASDAQ). We already cited the BDC advantage as floating rates bring higher yield cash income assets. The BDC dividend hikes and special dividends help keep some of the major BDC names in demand. While 4% handle deposits are more compelling for cash than we saw in 1H22, the BDC yields are typically in the 10% area. US-centric small caps are hard to generalize about, but the Russell 2000 is sitting next to NASDAQ in the low end of the top quartile. Health Care is the more notable loser with Utilities and Staples over on the right after they were in the upper tier behind Energy in the FY 2022 tally.
Yield Curve Migration
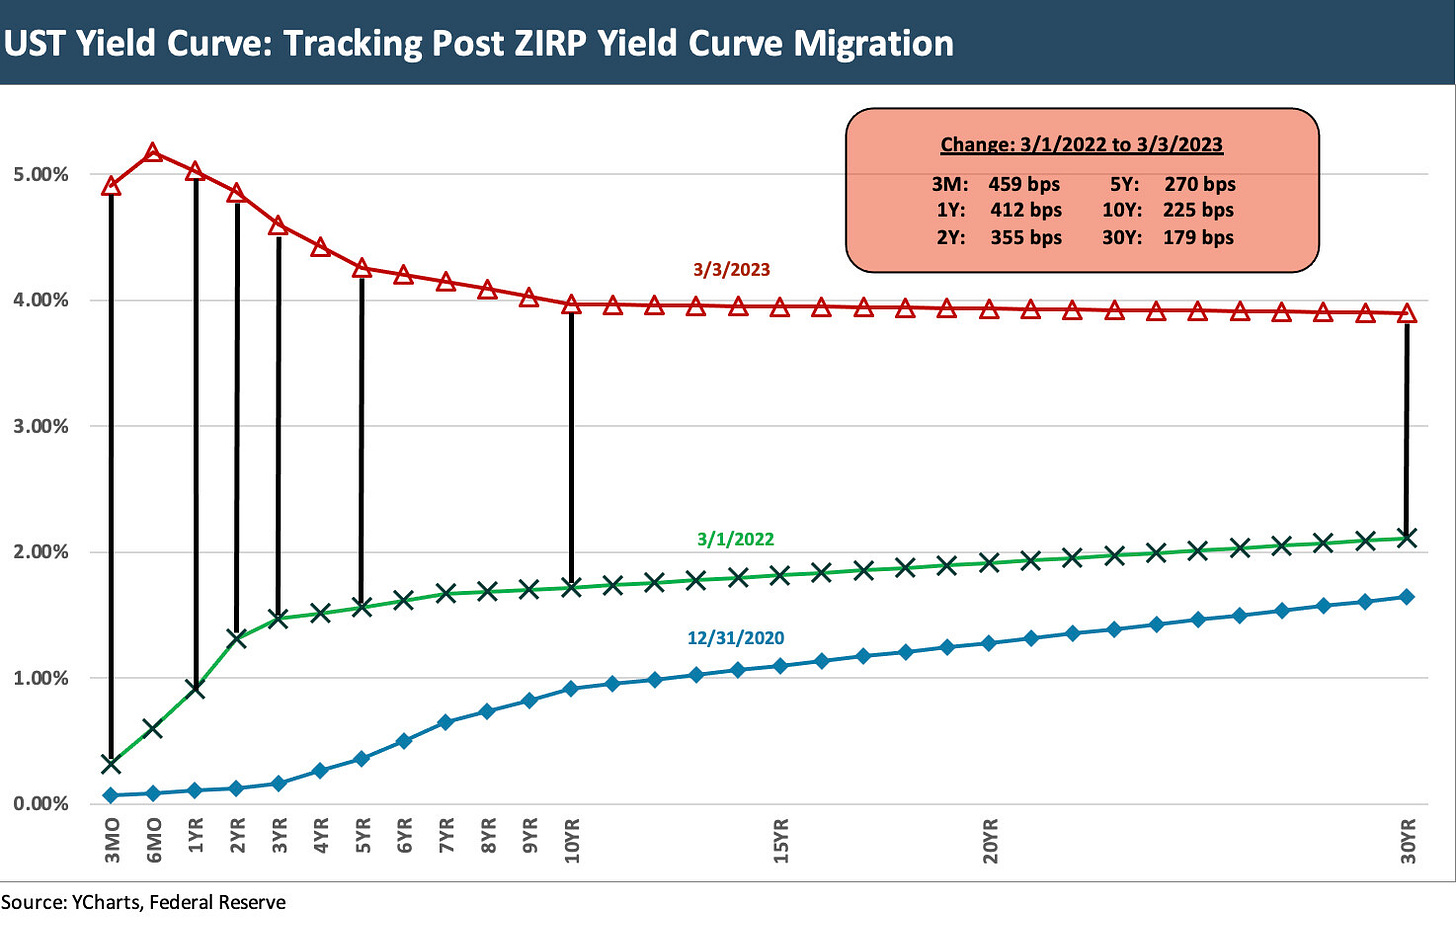
The chart below is one we update in each weekly as a reminder of how far the bear flattener and upward UST shift has moved since early March before the Fed exited ZIRP. Each week we update the differentials vs. March 1, 2022 (the month ZIRP ended). We detail the running differential in the boxed section of the chart.
The past week was more gentle in terms of effects on duration after a few weeks of upwards shifts across the board. For the week ended 3-3-23, we saw only minor moves vs. last week’s print with 3M and 2Y higher and 1Y lower. Moving out the curve, we saw 5Y UST and 10Y UST higher with the 10Y UST briefly crossing the 4% threshold again this week before moving back into a high 3% range to end the week. The 30Y UST ticked slightly lower by 3 bps week on week. The only double digit move in the boxed maturities was the 2Y UST which moved 13 bps higher.
As we noted above in the ETF returns and in the benchmark debt numbers, duration has been unkind to high grade and UST index total returns in recent weeks while fundamental strengths have been solidly supportive of US HY excess returns.
The 5Y-30Y slope inversion across the cycles…
We like to watch the curve slopes for many obvious reasons as we have detailed in numerous commentaries. Our favorite slopes for what they say about asset allocation include the 3M to 5Y and 2Y to 10Y. Those two fall into the sweet of corporate bonds (notably 2Y to 10Y) for both US IG and US HY. The 3M to 5Y also frames the relative value of cash vs. bonds for a given set of forward assumptions on the curve move (notably the 3M to 5Y and 3M to 10Y which we recently reviewed).
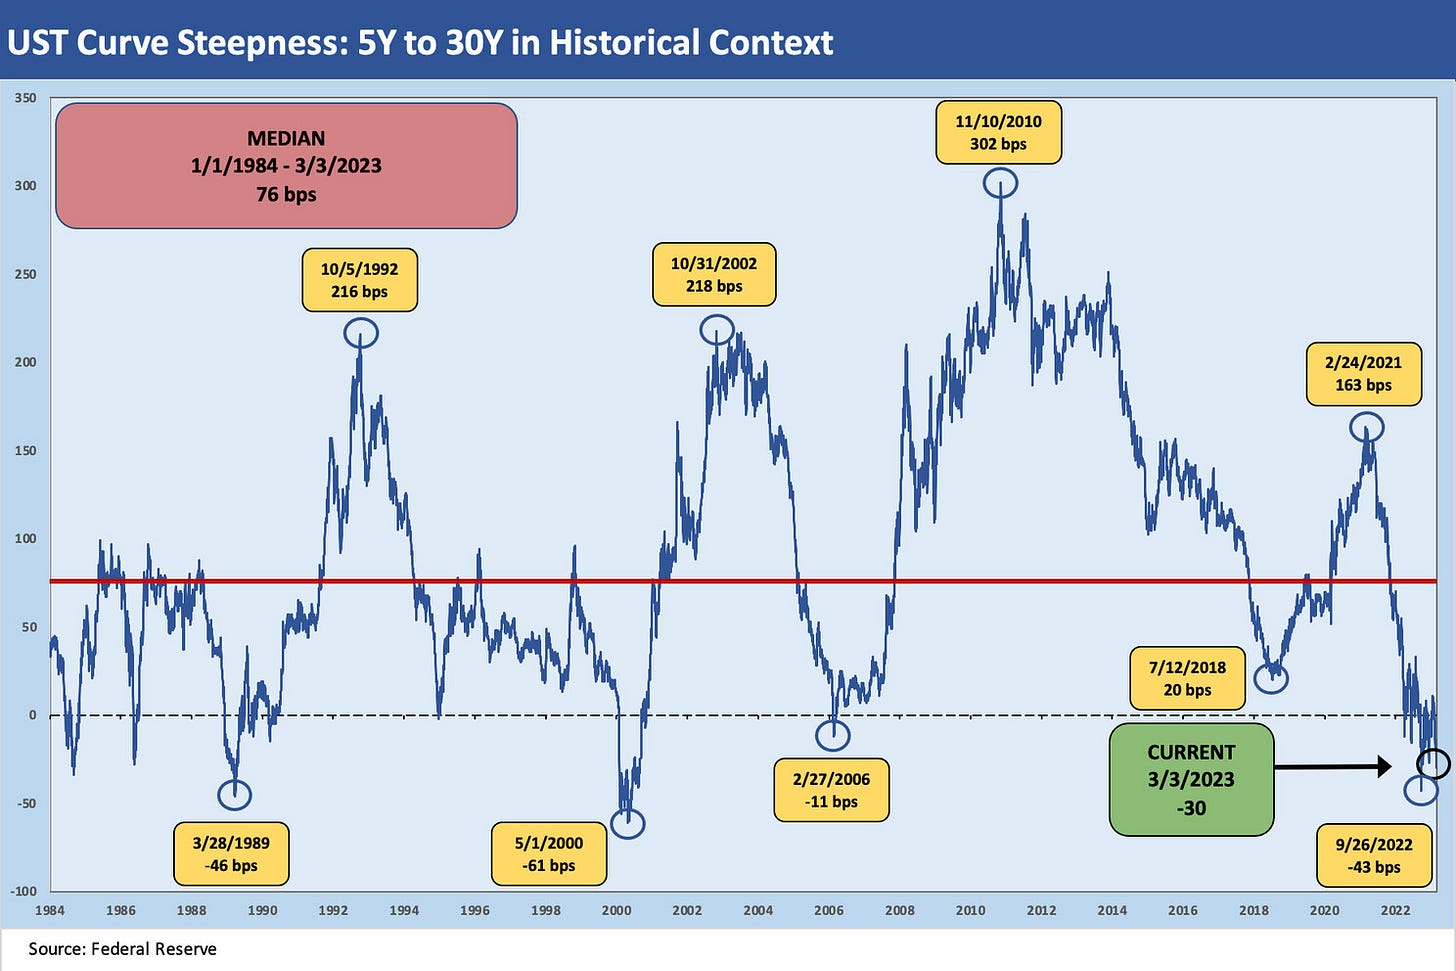
While down the list for most as one to watch, the 5Y to 30Y slope tells a story around what extension risk will mean in any given set of yield curve assumptions. While the 5Y to 30Y inversion has been reduced from the fall and is below prior periods of turmoil such as May 2000 and spring of 1989, it is still unusually inverted and part of the bigger inversion and “recession signal” discussion.
The inversion from 5Y to 30Y is not an inspiration to extend out the curve if you believe that stubbornly high inflation will start to weigh on fixed income performance through a flattening process that could unfold on the long end. We have been seeing the 5Y and 10Y shifting higher in recent weeks, and a major question is whether inflation fears will also start to erode the long end or whether recession fears will trump that effect. That is the classic bull vs. bear long UST battle.
For the long dated medium grade (BBB) corporate sector, an inversion is supposed to mean a steeper spread curve in theory and especially if one sees weaker fundamentals taking hold. The lack of natural buyers of 30Y bonds with low coupons and weak covenants is a time-honored generalization around spread risk when cyclical worries take hold. If we add a stagflation subplot to the story, then the low BBB long paper is supposed to be even riskier and issuer selection caution even more crucial.
MICRO
Canadian Energy: Oil Sands
Canadian Natural and MEG wrap a strong year for debt and equity…
When we first started looking at oil sands credits in detail back in 2017 after the oil sector crisis, one motivation was that the sector seemed to be somewhat of an orphan in street equity coverage, seldom covered in the US financial media, not cited much in many of the usual US industry trade rags, and usually neglected by sell-side credit analysts. We discovered that a lot of dedicated Canadian coverage in the trade literature was available (Daily Oil Bulletin/JWN on the favorites list) and there was no shortage of trade groups and experts offering reams of information and data on the topic (Alberta regulators, CAPP as a trade group, Canadian Energy Centre, and others).
The visibility and coverage of the sector has changed since that period. The major oil sands players navigated an oil crash and a COVID meltdown that along the way saw sustained industry consolidation, soaring free cash flow and balance sheet repair. That has helped establish some of the names as core holdings in both debt and equity portfolios and more firms can trade and underwrite such names with confidence.
The “Canadianization” of oil sands over the past decade and a renewed focus on national security and energy after Russia-Ukraine and North American energy independence should bring the Canadian players much more into the US policy discussions. The role of pipelines will complicate the positions on the left and the US -centric mindset on the right might be a headwind. A coherent energy policy debate during the 2024 election craziness will require consideration of LNG and oil export dynamics and where heavy Canadian crudes can play a role in where US production gets directed.
Post-2016, post-COVID lessons…
What we found in the aftermath of the oil sector meltdown in 2015 into early 2016 was that the Canadian majors comprised a very interesting sector that needed an analytical framework more like processing industries and manufacturers than what our energy team was working on with the flood of leveraged and financially stressed upstream operators in the shale sector. The debt-funded capex exploration directed all attention to the complexities associated with the boom in unconventional and emerging drilling technologies. The names were blowing up. Default rates were soaring, and the IG names in Canada and the one major oil sands name in US HY (MEG) just did not draw the investor focus.
The main US HY issuers were all about short-cycle investments with high decline rates, high reinvestment needs, and shorter payback periods. The oil sands companies were very long cycle, very long-lived and came with over-the-top capital intensive histories to the point of multi-year buildouts running into billions per project. Oil prices had fueled a lot of smaller start-ups in oil sands (“oil sands juniors”), but the great risk in oil sands was that volume was needed to bring down unit costs. That meant smaller projects were doomed when oil collapsed.
When the smoke cleared there were a few major IG issuers and one major HY name (MEG Energy). As a group, the Big 4 and MEG targeted major projects and spent big as integrated oils from the US and Europe exited to chase short cycle projects in the US or faced ESG pressures at home. Those are stories for another day as we ramp up on some of our former coverage names.
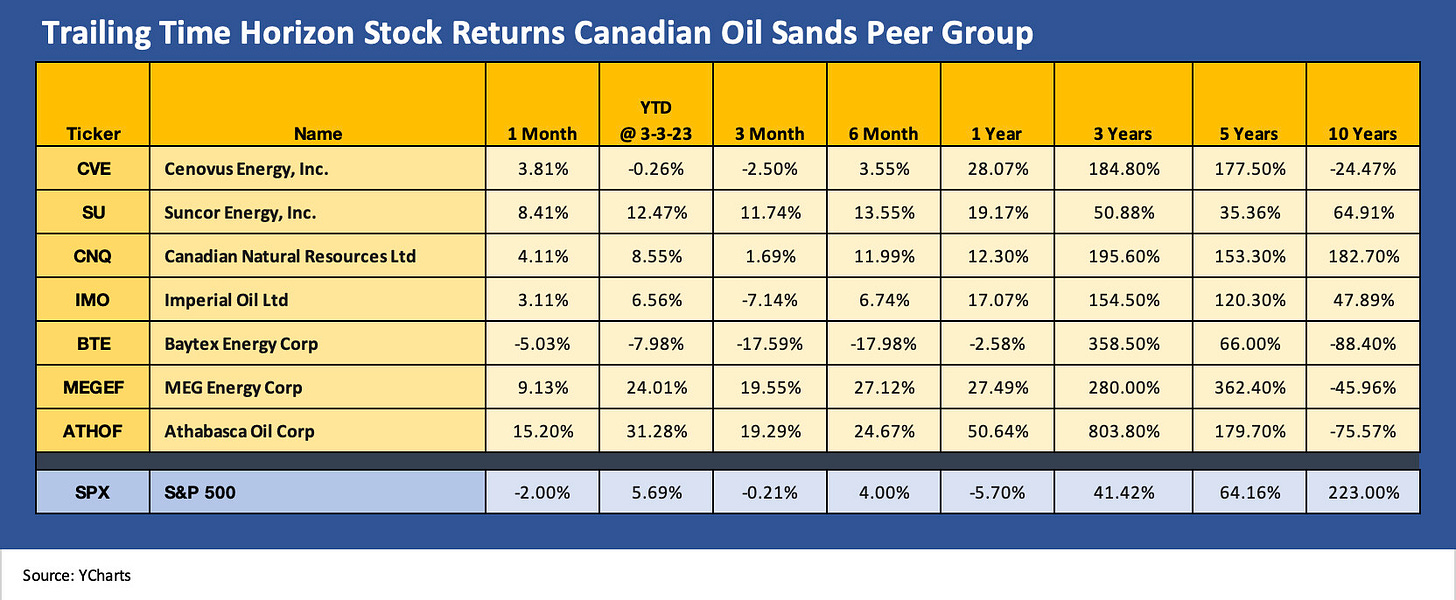
The chart above takes a look at how some of these stocks have framed up across time. Suncor boasted the largest market cap for a protracted period on the back of its diversified business mix before CNQ took off. For CNQ, the biggest growth came after major acquisitions that ran alongside highly successful expansion programs. Canadian Natural Resources is now the behemoth of the group in upstream operations and reserve base. CNQ would be a Top 20 producer as a nation unto itself.
Cenovus has dramatically reduced its business risk profile and enriched its operating asset diversity this past cycle with its acquisitions. Imperial operates as an arm of Exxon while MEG is the smaller but a high quality operator that many assume will get rolled into one of the Big 4 someday. CNQ and CVE have been the most acquisition-oriented of the group.
Big 4 of Oil Sands is comprised of Canadian Natural (CNQ), Suncor (SU), Cenovus (CVE), and Imperial Oil (IMO, an Exxon unit) with MEG Energy (MEGEF) also now a big name—a more distant #5 but considered a very high-quality asset. Consolidations has been a theme. MEG fought off a Husky Oil takeover attempt and then later Cenovus bought Husky. CNQ’s free cash flow exceeds the market cap of MEG Energy, so MEG would be an easy purchase for CNQ.
On the stock list in the chart, Baytex comes with the asterisk of being a major player in the US in the Eagle Ford and this past week announced a bid for Ranger Oil. BTE it is not in the major Canadian oil sands peer group and has a broad portfolio in the US as well. Athabasca is a smaller player in oil sands but like the leaders is also active in the Montney and Duvernay in its asset mix. The story over the past decade for the Canadian players has been about ongoing portfolio management of reserve profiles.
Low operating costs and attractive breakeven rates for sustainable capex levels…
The capex intensity of oil sands, which was more like building a town than a drill site, earned the oil sands players the tag of high cost, when in fact these operations boasted very low unit costs once they were up and running. These projects were slowly winding down and the plunging unit costs, as the volumes ramped up, started to make believers of more investors in investment grade names. During the 2016 oil trough names such as Cenovus and Canadian Natural that saw their bonds plunge to distressed levels as market liquidity in these names saw the dark side of the “slow down bid.”
The market has learned a lot about these names since. These were mostly companies with strong bank group support and were household names in Canada. They also had more than a little political support in Alberta that would have crossed into liquidity support if it came to that during the COVID crisis, when a barrel of Western Canadian Select was trading flat to a bottle of Molson.
We will look at those histories and evolutionary period for these names in the market when we return to doing more single name work in the subsector.
The past week, Canadian Natural and MEG Energy weighed in…
When we looked at CNQs numbers this past week, we start to wonder if they will look more aggressively at more M&A across 2023-2024 given the scale of free cash flow in excess of sustaining capital needs. The choice is return to shareholders or make acquisitions and grow the reserve base and diversity. We will be out in more detail on the major oil sands names in the near future.
CNQ posted 2022 results last week, which included C$19.8 bn in adjusted funds flow and free cash flow of C$10.5 billion. That in turn drove material debt reduction and shareholder rewards with C$3.2 bn in debt reduction and C$10.5 bn in combined dividends (C$4.9bn) and buybacks (C$5.6bn). The company changed its shareholder policies to allow for 100% of free cash flow to be distributed to shareholders once the net debt level reaches C$10 bn. That was more generous to shareholders than the prior target of C$8 bn as the reserve base and higher production levels allowed CNQ to justify it. That does not change our view that CNQ offers both massive asset protection and highly discretionary cash flow even at much lower oil price levels.
Last but not least, MEG Energy’s results capped off a banner year as well. With C$1.55 bn of free cash flow after capex, MEG was able to pay down US$ 1.0 bn in debt (C$1.3 bn) and buy back 7% of its stock. With operating expenses of C$7.91 per bbl, the cushion in the numbers for MEG is very impressive for its credit ratings and relative cash flow. Energy operating costs net of power revenue are only C$ 3.18. Low unit costs have been a hallmark of the MEG story across the oil crises.
MEG will keep buying back shares and expect another 10% in 2023 but will continue to reduce debt. A new policy announced by MEG indicates it will allocate 25% of free cash flow to buybacks and the remainder to reduce debt. The ratings have always been all over the place across the rating agencies on this name, but the risk is clearly in the crossover quality zone at this point. MEG is still housed in the B tier of the index, but the market says otherwise.
Auto Retail: Carvana Mornings After
Carvana as one of those underwriting and crowd-chasing anomalies…
The 4Q22 numbers were filed a little over a week ago along with the 10K, but we thought we would take another look into the details around its history of stock and bond deals. This one will be a case study in the future.
Most of the big financing activities unfolded in 2022 after getting off and running in 2020 during the COVID crisis. The separate commentary we posted on the site (See Carvana: Credit Profile 3-5-23) looks at the massive scale of capital markets deal flow in stock and bonds for a company in online used car retail. The ability to execute on that scale given the cash flow and asset base profile is one of the stranger sequences of major funding events we have seen for a while.
The CVNA funding requires some outlandishly bullish forward valuation theories and cash flow hopes and dreams. Overall, the profile was very “1990s TMT,” so it was not unprecedented. The hole in the cash flow and painfully bad run rates on EBITDA made the sheer scale of the capital raising hard to fathom. An asset-lite services company raising billions in unsecured debt while also issuing common stock with no discernible near term earnings catalysts was coupled with negative cash flow was essentially betting the ranch. The valuations in 2021 came during a period rife with distortions beneficial to their core business (spike in used car demand, shortage of new cars).
We can understand the phenomenon of sell-side “FOMO” for equity bulls on a sector (online auto retailing) with a heavy slate of underwriting fees on the line, but everything had to go right. At the same time, all competition had to stand down. The financial strength and ambitions of the franchised used car dealers and the pace of change ahead in so many areas of the automotive sector (tech-based remarketing platforms, dealership investments in online activities, scarcity of personnel, etc.) made layers of the CVNA analysis unusually bullish when so many moving parts were in play. It was a whiteboard model without a view on what could go wrong.
From here, the follow-through on a $600+ million interest expense bill in 2023 is the reality that CVNA faces. That is at a time when funding costs are rising for asset-based financing and new vehicles (and trade-ins). Car rental companies will get back to their more normalized fleet turnover cycles after booming travel, and will be among numerous variables to watch. There have been a few other online players whose stocks are under duress, and the year ahead will be interesting for how names such as CarMax and the major franchised car dealers move around their chess pieces. Some of those also come with ambitions to bull their way into a bigger role in online auto sales.


