
Footnotes & Flashbacks: State of Yields 9-24-23
We update the yield curve moves in yet another week of duration headwinds and poor asset returns.


Another week, another upward UST shift as the FOMC color weighs on duration and the UST market keeps creeping higher from record inversions.
Inflation anxiety has eased even if the oil flow-through effects are not lifting spirits as the curve is fighting the inversion.
The only thing doing poorly right now is bonds and equities (!), so cash has been burnishing its reputation as an outperforming asset and a haven for those seeking more clarity on the cyclical path.

Fixed income returns got a fresh round of wind in the face this week with the FOMC meeting not helping sentiment (see FOMC: Higher for Longer, Confused for Shorter 9-20-23).
The overall story of the yield curve side and risky asset returns this week looked a lot like last week in general terms (see Footnotes & Flashbacks: State of Yields 9-16-23). Last week, we added some charts on comparative histories of UST curve and all-in yields for HY and IG Corporates that we don’t replay each week. Those and the weekly mortgage update underscore the very unusual (and low) UST backdrop relative to prior credit cycles (and housing bubble) peaks.
For now, the yield curve is not a friend of the extension trade. As noted in the chart above, the downward shift from 12-31-22 to 1Q23 raised hopes for a continued increase in bond allocation, but the months since have put that strategy back on its heels.
The rise in UST rates since 1Q23, the rise in oil prices, the 7% handle mortgage rates, rising China tensions, and a potential government shutdown all toss in some more active ingredients in the cyclical mix. We also have the uncertainty around the UAW-Detroit 3 chaos (see UAW: Going to the Mattresses 9-22-23, Autos: War Stories & Anecdotes 9-22-23).
Weak multi-asset class returns (stocks and bonds) are not helped by political uncertainty (more like political treachery and insanity) as the market keeps looking for that trigger or mix of risk factors that will trip up the consumer sector.
This coming week we get a fresh look at the Feds favorite PCE inflation metrics with the Personal Income & Outlays report. Then the week after, we see more employment data (JOLTS and the monthly payroll data). The UAW battles will be distorting payroll numbers in September and October and could see volatility in employment metrics into November.
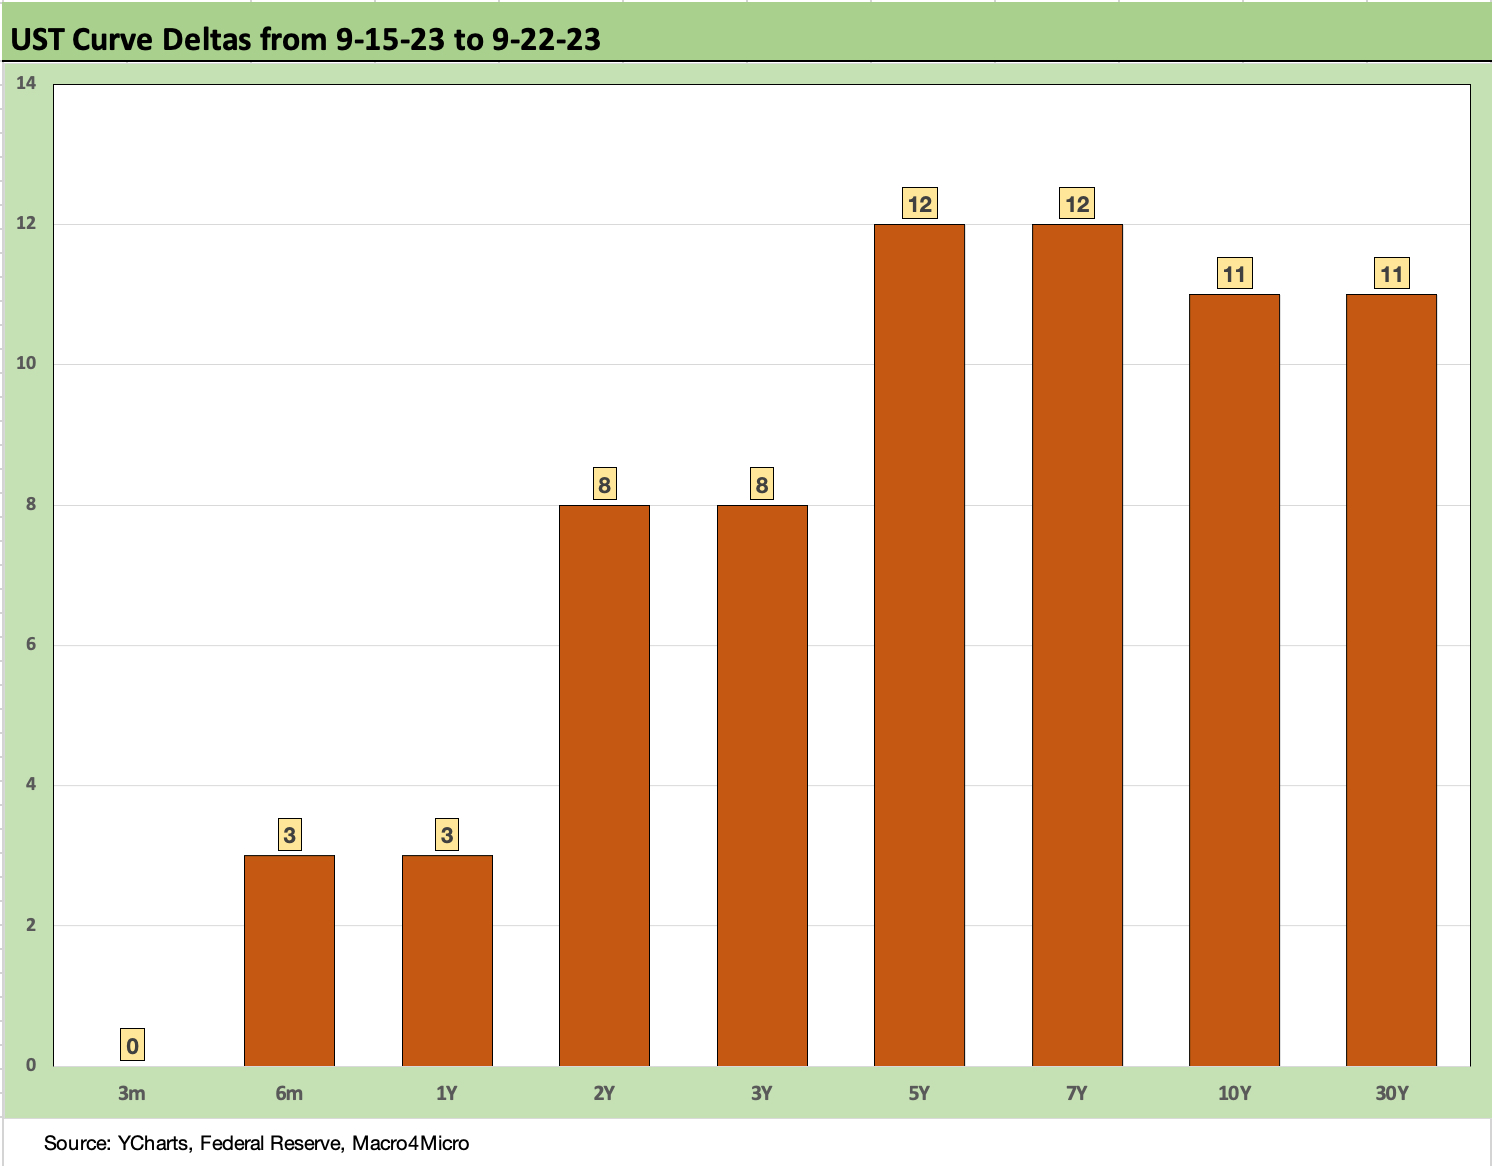
The above chart updates the UST curve move this past week. The shift was bad news for bond performance with duration feeling it out the curve.
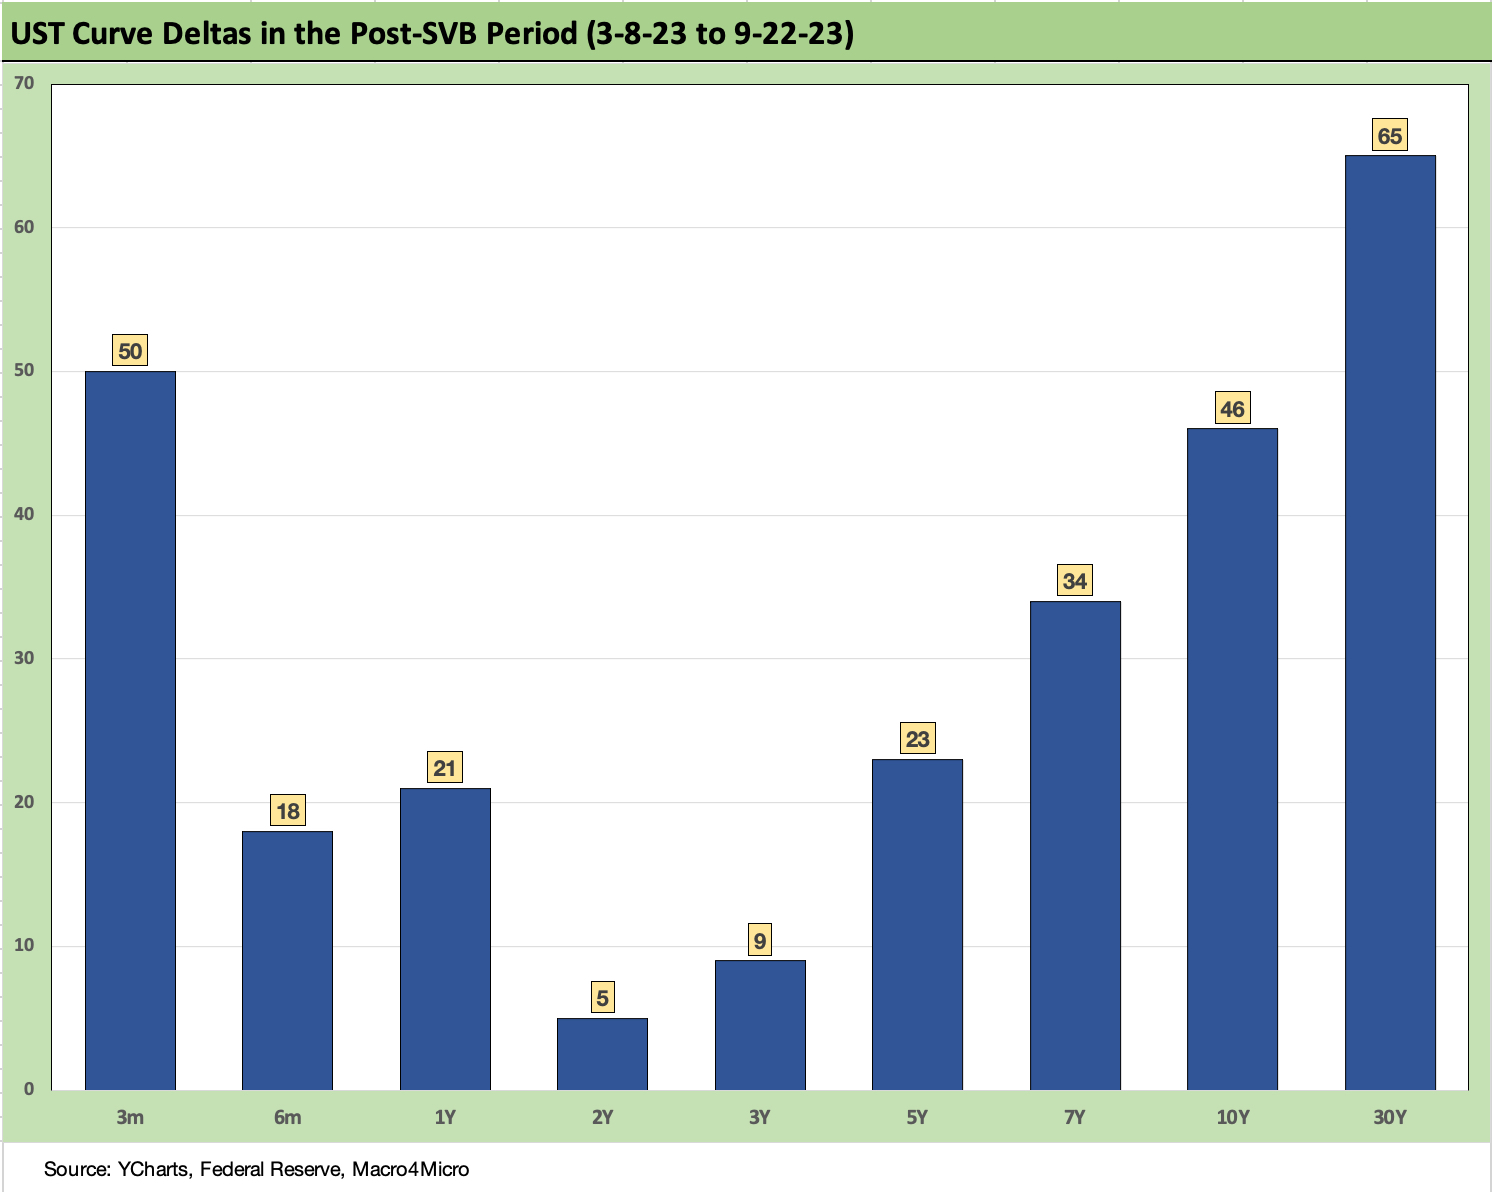
The above chart updates the UST curve deltas since the last “clean” trading day ahead of the Silicon Valley Bank crash and the onset of the regional bank mini crisis. This week’s UST moves mark the first time everything along the post-SVB UST curve was higher.
The 2Y to 30Y beat steepening translates into duration pain and brings some adverse return effects. That continues a trend we have been updating for some time now and is evident in the chart at the top of this commentary. Since 1Q23, the duration story has been ugly and has been a drag on bond returns. We look at asset returns in a separate “Footnotes” weekly.
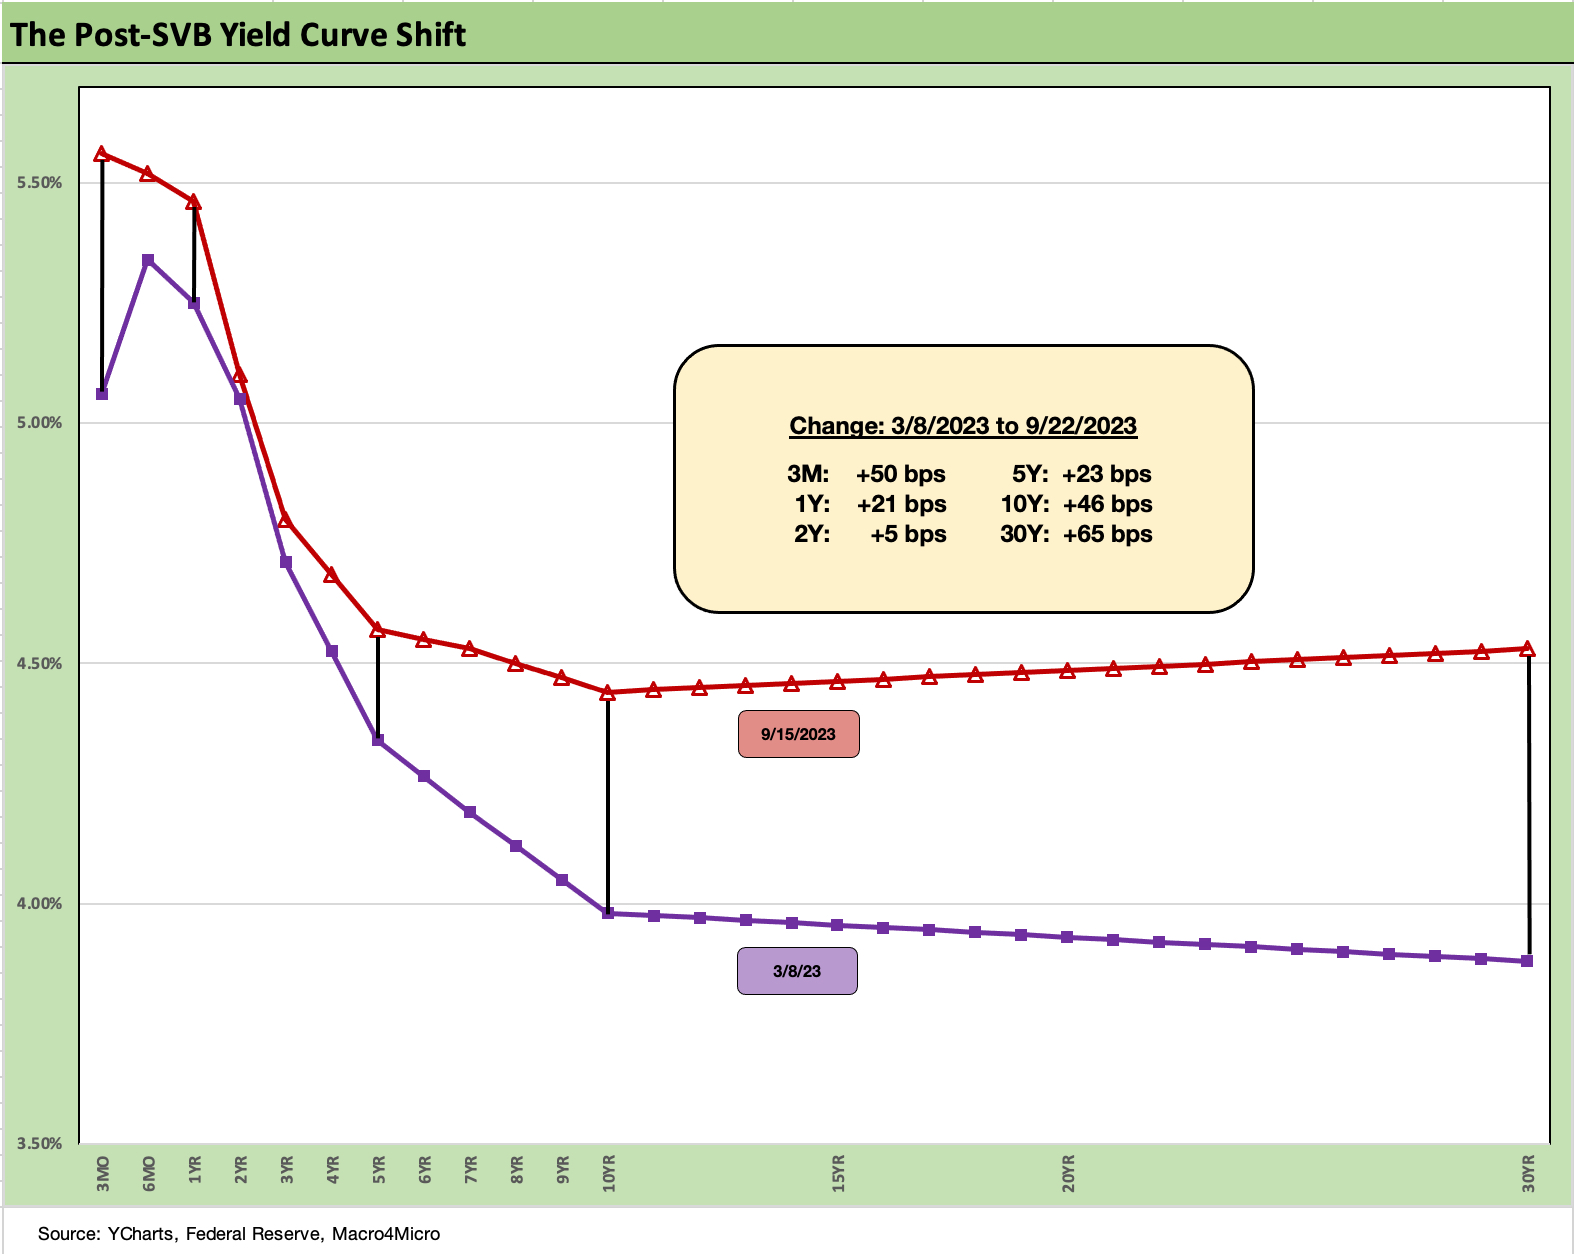
The above chart simply puts the UST deltas since SVB into a different visual format to underscore the adverse shift in UST for bond performance. There is the scary thought that a flat yield curve with the front end anchored by the Fed means more trouble for bond performance if industry and consumer sector fundamentals hold in.
The FOMC dot plot for 2024 still had a midrange area for Fed funds of around 5% just using the count of the 19 forecasts. Meanwhile, the significant majority of the FOMC see one more hike this year.
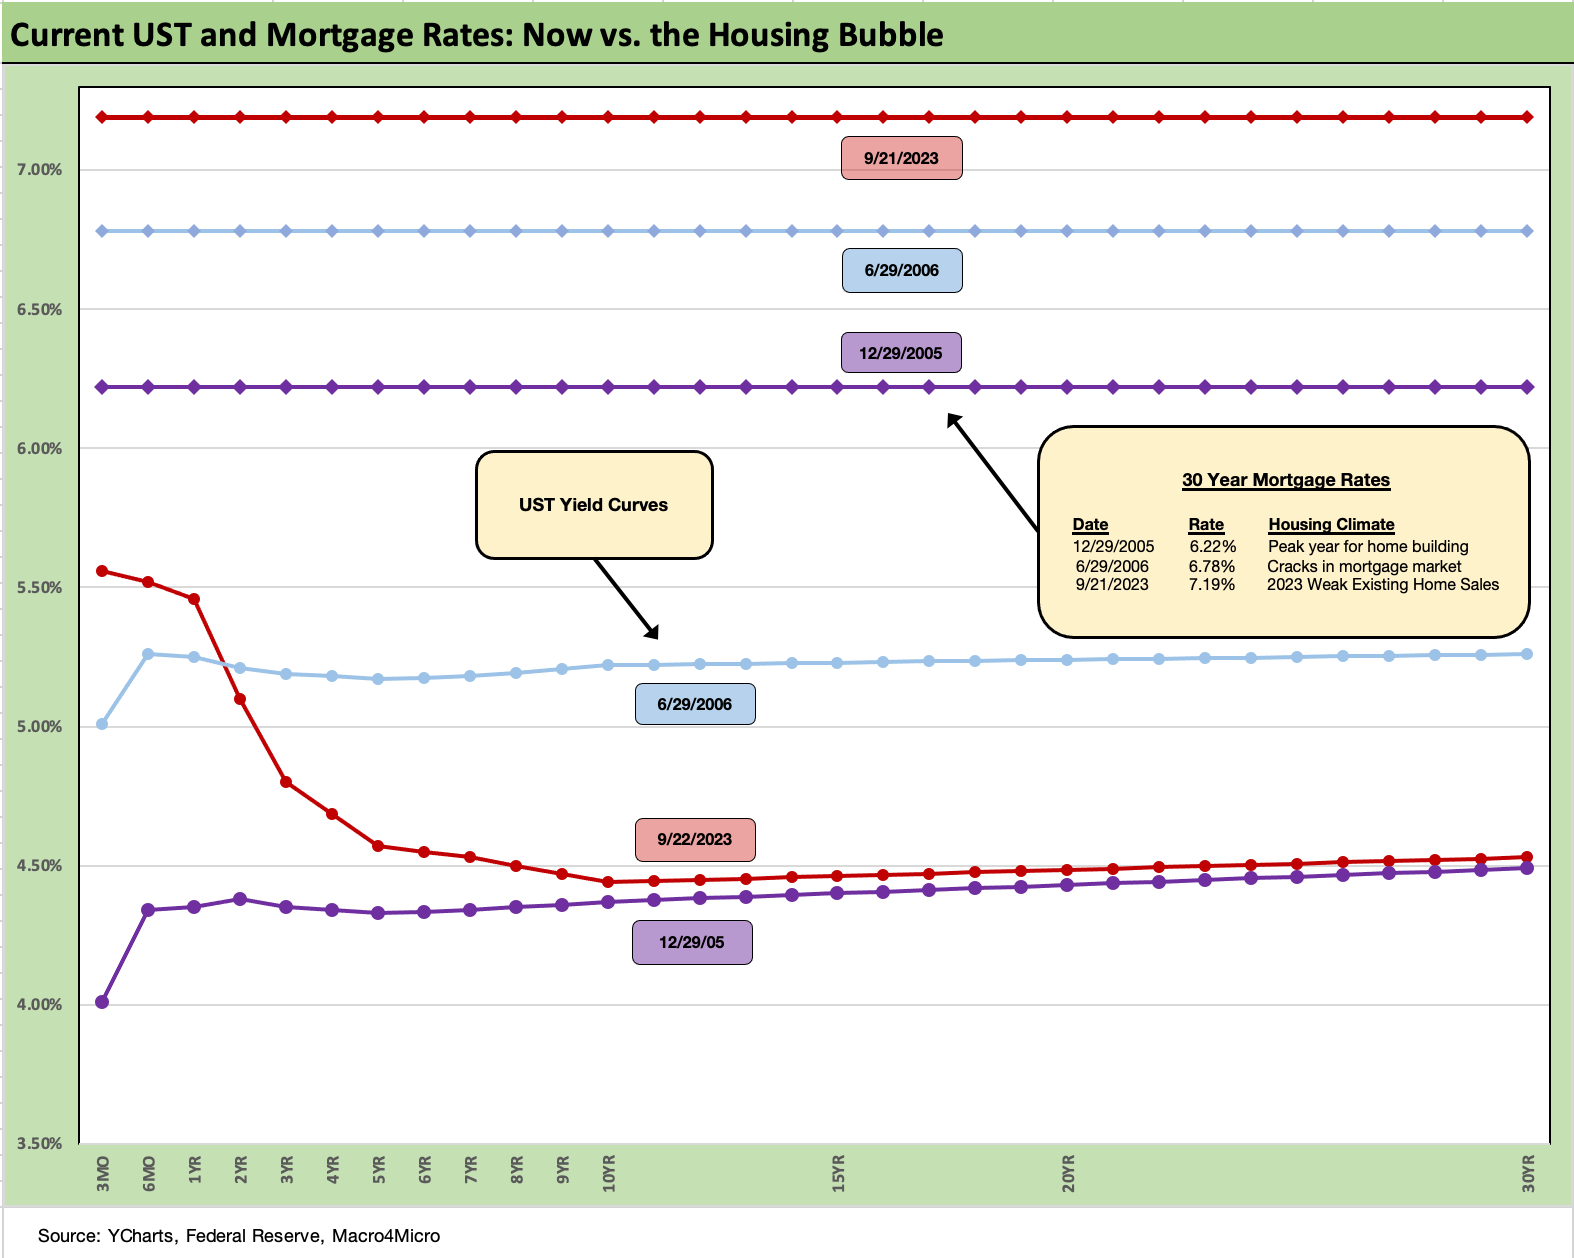
The above chart is an update of what has become a narrow range and status quo of the Freddie mortgage benchmark in the low 7% range. We keep seeing more than a few headlines on market calls that the next 8% handle will be seen before the next 6% handle.
That 7% handle is still hammering affordability and keeping existing home sales in the tank along with inventory (see August Existing Home Sales: Same as it Ever Was 9-21-23). The comparison of the UST now vs. those earlier housing peak mortgage rates is an anomaly that vexes housing supply-demand fundamentals today.
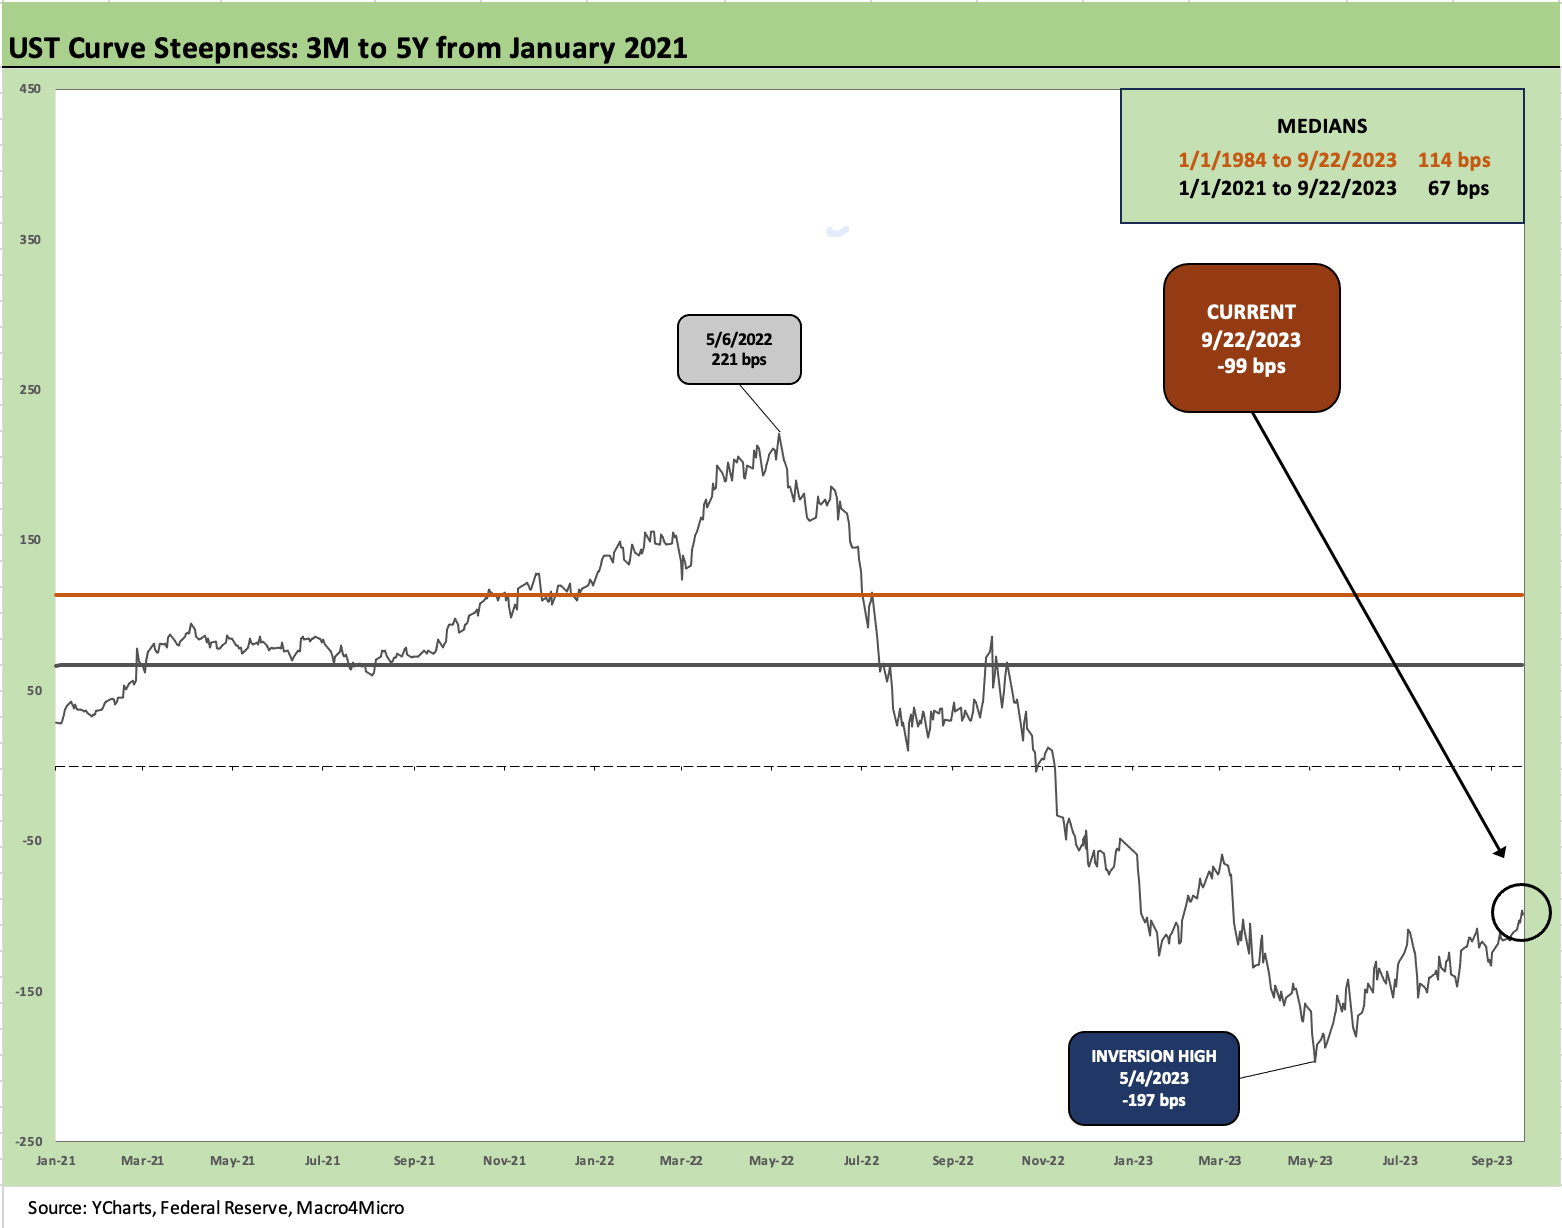
The above chart updates the 3M to 5Y inversion over the shorter time horizon from the start of 2021. The box in the upper right chart shows the long-term timeline (post-1984) upward slope median of +114 bps and the shorter timeline (from Jan 2021) slope of +67 bps. The current inversion of -99 bps is still an eye opener even if much less inverted than May 2023.
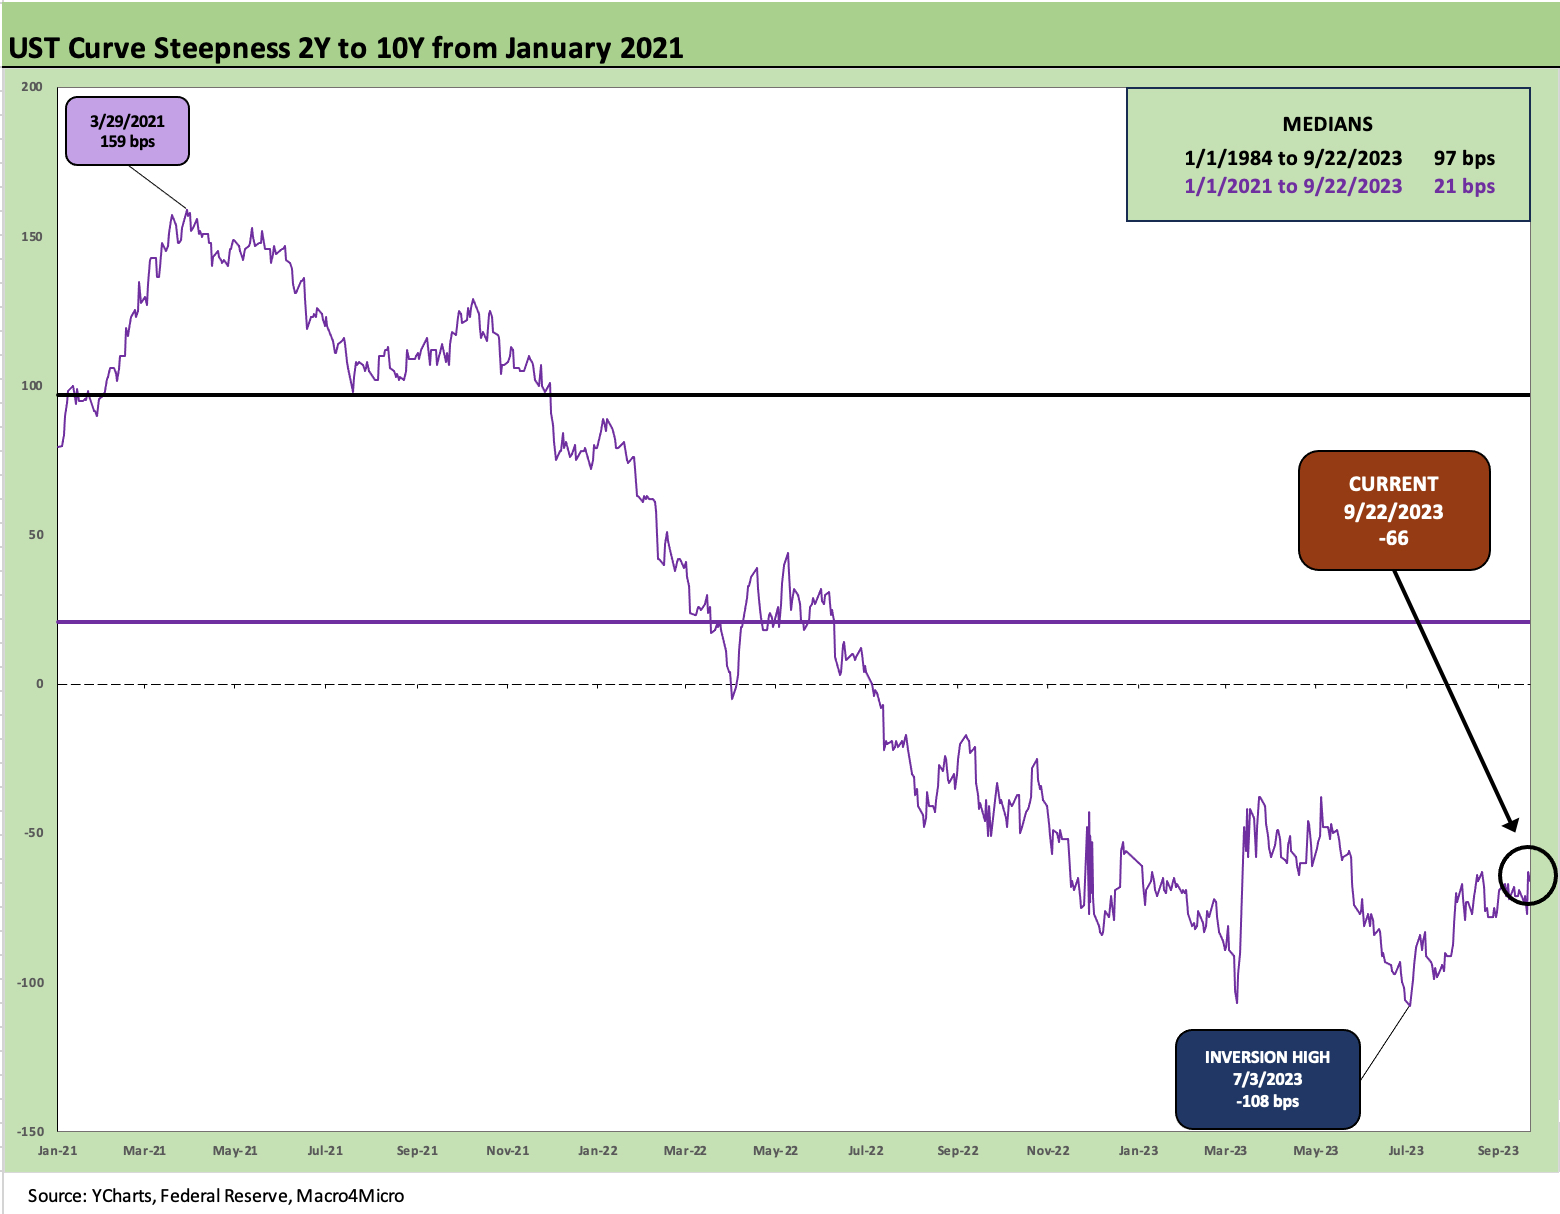
The above chart updates the 2Y to 10Y curve slope, and we see the rising 10Y at least pull back the inversion from the July 2023 peak of -108 bps. In the longer timeline context, the current -66 bps is still a seriously inverted curve vs. the long term median of +97 bps and post Jan 2021 median slope of +21 bps.

We wrap with our usual final yield curve chart that frames the cumulative shifts in the UST curve from the beginning of March 2022. ZIRP ended by the middle of that month and the front end started its inexorable rise. We see a bear inversion for the ages with +524 on 3M UST, +261 bps in 10Y and +231 bps in 30Y.
There are a lot of forces working in favor of a UST curve rally if we in fact see the consumer moderate, the manufacturing sector take a few more bullets (notably in auto sector disarray), and any new signs of softness in housing. The CPI shelter numbers are biased lower on what we consider “bad marks” in the CPI accounting (see August CPI: Inflation Fears…They’re Back?! 9-13-23). That waiting game is not new and has been a losing trade.
Credit conditions are supposed to tighten and take a toll at some point. We had remained bearish on duration for a while now, and the old school supply and demand factors for market clearing prices cannot be ignored as a simple explanation for the upward move in UST and soaring borrowing needs along the curve. The economic headwind checklist is still in place and growing, but the FOMC policy, OPEC+ and oil, and wage pressures are still part of the give and take on inflation.