
Footnotes & Flashbacks: Asset Returns 10-1-23
We look at a mixed week that wraps up a bad month and a bad quarter.


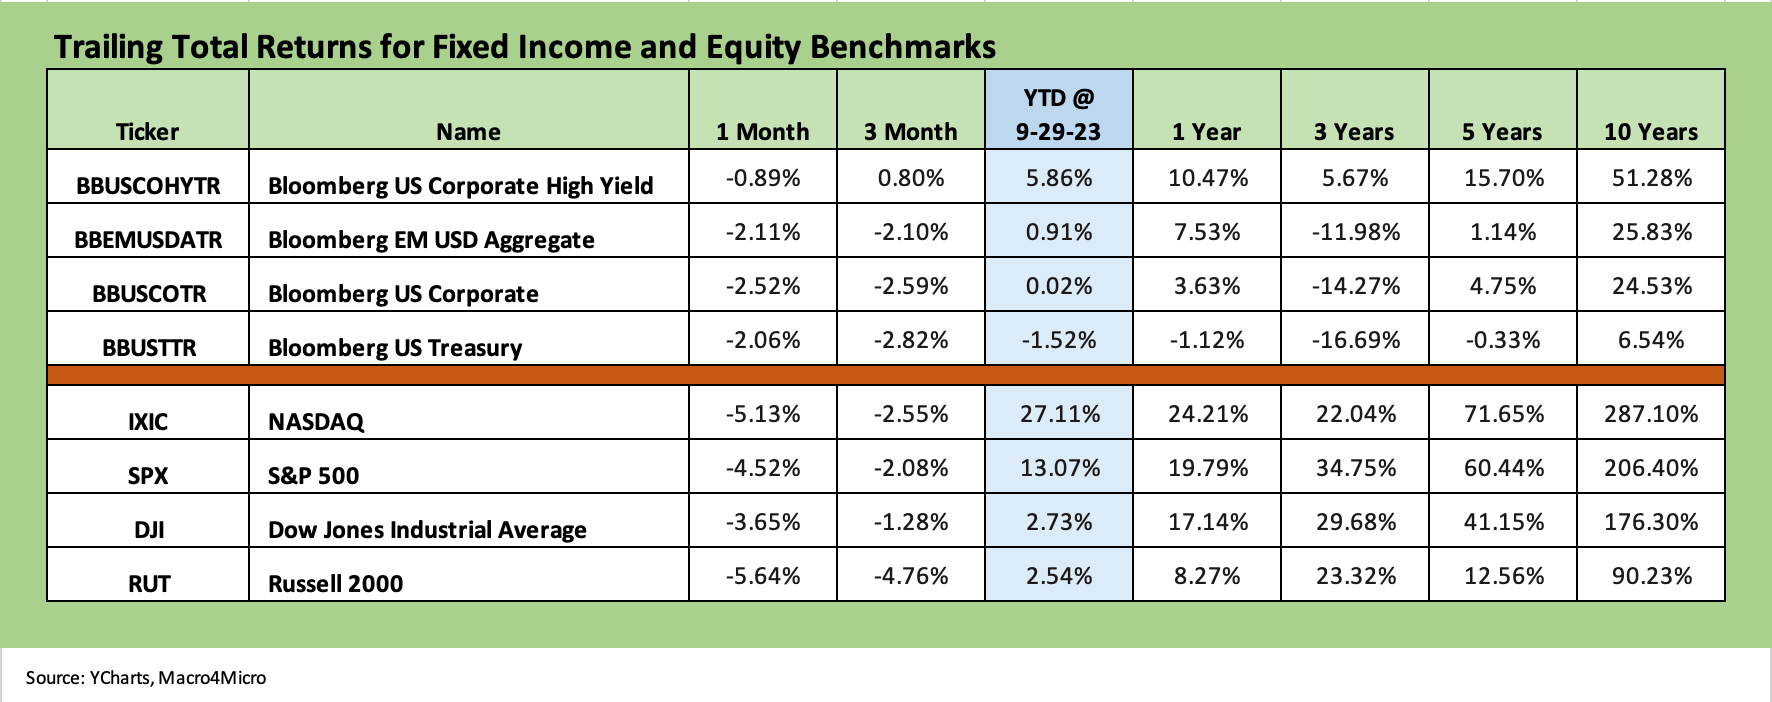
September and 3Q23 close out with a yelp on duration and weak equities as the broad asset classes of stocks and bonds come up short.
The month weighed in decidedly negative in equities/ETFs with Energy related equities and BDCs the only positive industry groupings in the 26 buckets we track.
The 3-month trailing time horizon was similar to the 1-month run but with HYG barely in the positive range on less duration exposure and resilient spreads.
The YTD run rate through the end of September still is shaping up as a year where opportunities were there for the taking with a wide Hi-Lo differential of over 50 points and almost 40 points if we take out the highest and lowest of the ETFs and benchmarks.
The above chart updates the main asset classes and subsectors we watch each week. The weakness is similar to last week after the FOMC (see Footnotes & Flashbacks: Asset Returns 9-24-23) with the UST curve shifting higher again but in more of a steepener this past week. We look at the yield curve patterns in a separate Footnotes publication, and the curve move of a “steepener toward a flat curve” is still in place. The painful supply-demand dynamics are making life tough for duration. This has been flowing into mortgage rates as well.
The past week had plenty of drama around the potential government shutdown and what it might all mean for fundamentals and sentiment. That problem was temporarily resolved on Saturday (see Political Economy: 45-Day Policy Death March or Snatched from the Jaws? 10-1-23). There will be more action this week with the likely challenge to McCarthy’s role. The UAW strike is also escalating (see UAW: Going to the Mattresses 9-22-23, Autos: War Stories & Anecdotes 9-22-23).
In credit, we see spreads resilient in IG bonds and HY slightly wider on the week and still only slightly wider than the end of 2Q23 after June’s late month rally. Shorter duration and coupon income allowed HY to eke out a positive number for the quarter (before index rebalancing weighs in).
HY is doing better than we envisioned vs. IG so far as fundamentals have hung in and the returns have been more about duration than a forward view on weaker credit risk and the potential for repricing. The 4th quarter has been very unpredictable in more years than we care to remember with 4Q18 one of the worst late cycle moments in memory.
This coming week we have JOLT/Jobs, more ISM data, Factory Orders, trade data, and more “morning after” assessments of the shutdown blowback. On the political front, Gaetz posted today that he plans to challenge McCarthy and remove him as speaker (Gaetz is stocking up on extra hair product for a long day or two).
Student loan payments are resuming this month, oil is high, and the 3Q23 earnings reporting season lies dead ahead. Mortgages have moved even higher into the 7% range, and the consumer signals are indicating at the very least a tapering (not a contraction) as we saw in the PCE data last week (see PCE: It Takes Two to Ease 9-29-23).
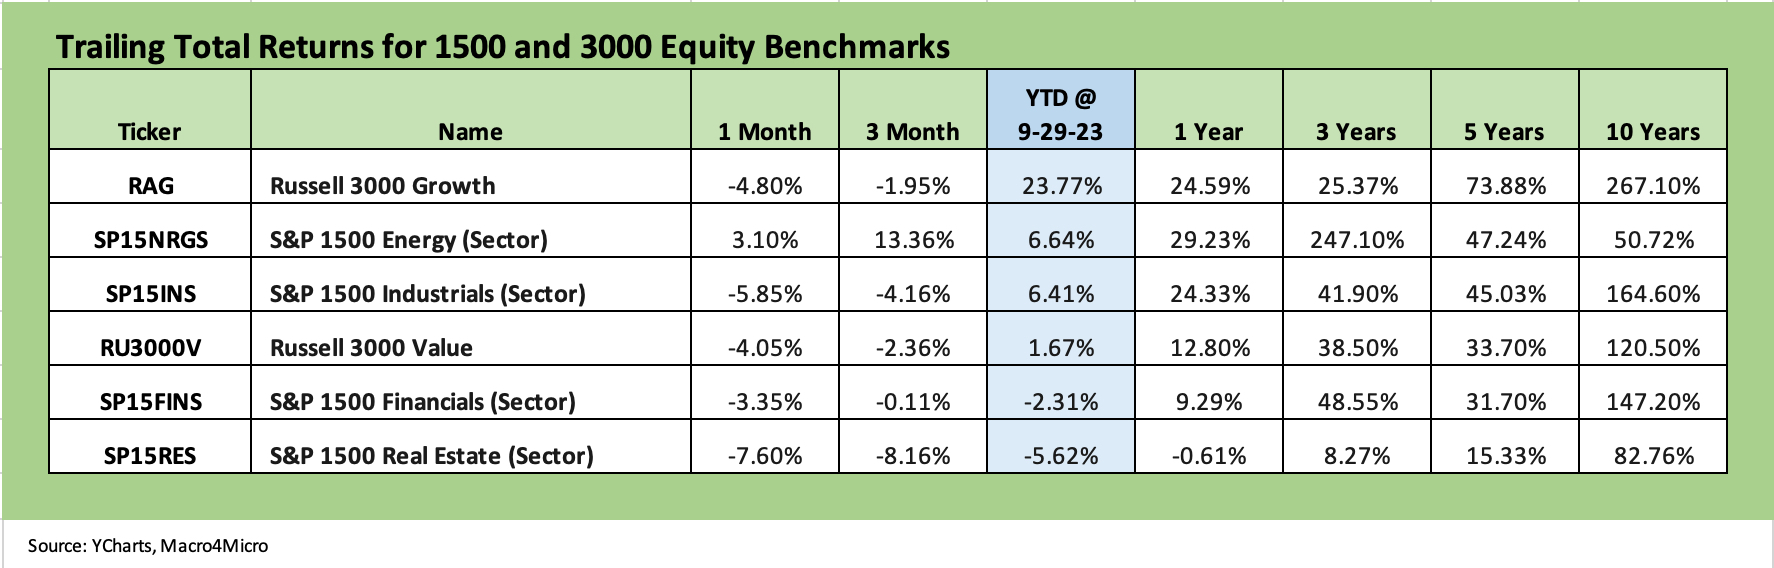
The above chart updates our 1500 and 3000 series with bad numbers everywhere except Energy for the 1 month and 3 months. We line them up in descending order of total returns YTD.
Growth is still living off the tech rally that carried over in the YTD results but saw a haircut this past month. Industrials saw performance retrenched the past month and Financials and Real Estate both remain in the red YTD with Value limping to a 1% handle YTD returns.
Cash appears set to beat many equity indexes and subsectors and sector benchmarks this year.
ETF and benchmark returns…
In our next four asset return charts, we cover 1-week, 1-month, 3-month, and YTD time horizons for a range of ETF returns. We look at 26 different benchmarks and ETFs that cut across a wide expanse of the economy. We recently added the YTD version as we are now in the 4Q23 period. The usual question of “What kind of year was 2023?” is starting to look for a general description.
As detailed further below, at least there is a lot of subsectors and industry ETFs well in the black YTD. We have seen materially worse years than this even during cyclical expansions. As a year where cash came out #1 vs. debt and equities, the year 2018 immediately leaps to mind.
We recently added equal-weighed ETFs for the S&P 500 (RSP) and NASDAQ 100 (QQEW) given the market cap weighted distortions in the total returns for those benchmarks that had been driven for much of the year by the mega-names. The YTD return profile for market cap weighted ETFs vs. Equal Weighted ETFs offer a clear reminder of what an unusually imbalanced year it was to this point.
When looking across some of the bellwether industry/subsector ETFs, it is good to keep in mind which narrow ETFs (vs. broad market benchmarks) get wagged more by the “Magnificent 7” including Consumer Discretionary (XLY) with Amazon and Tesla, Tech (XLK) with Microsoft, Apple, and NVIDIA, and Communications Services (XLC) with Alphabet and Meta.
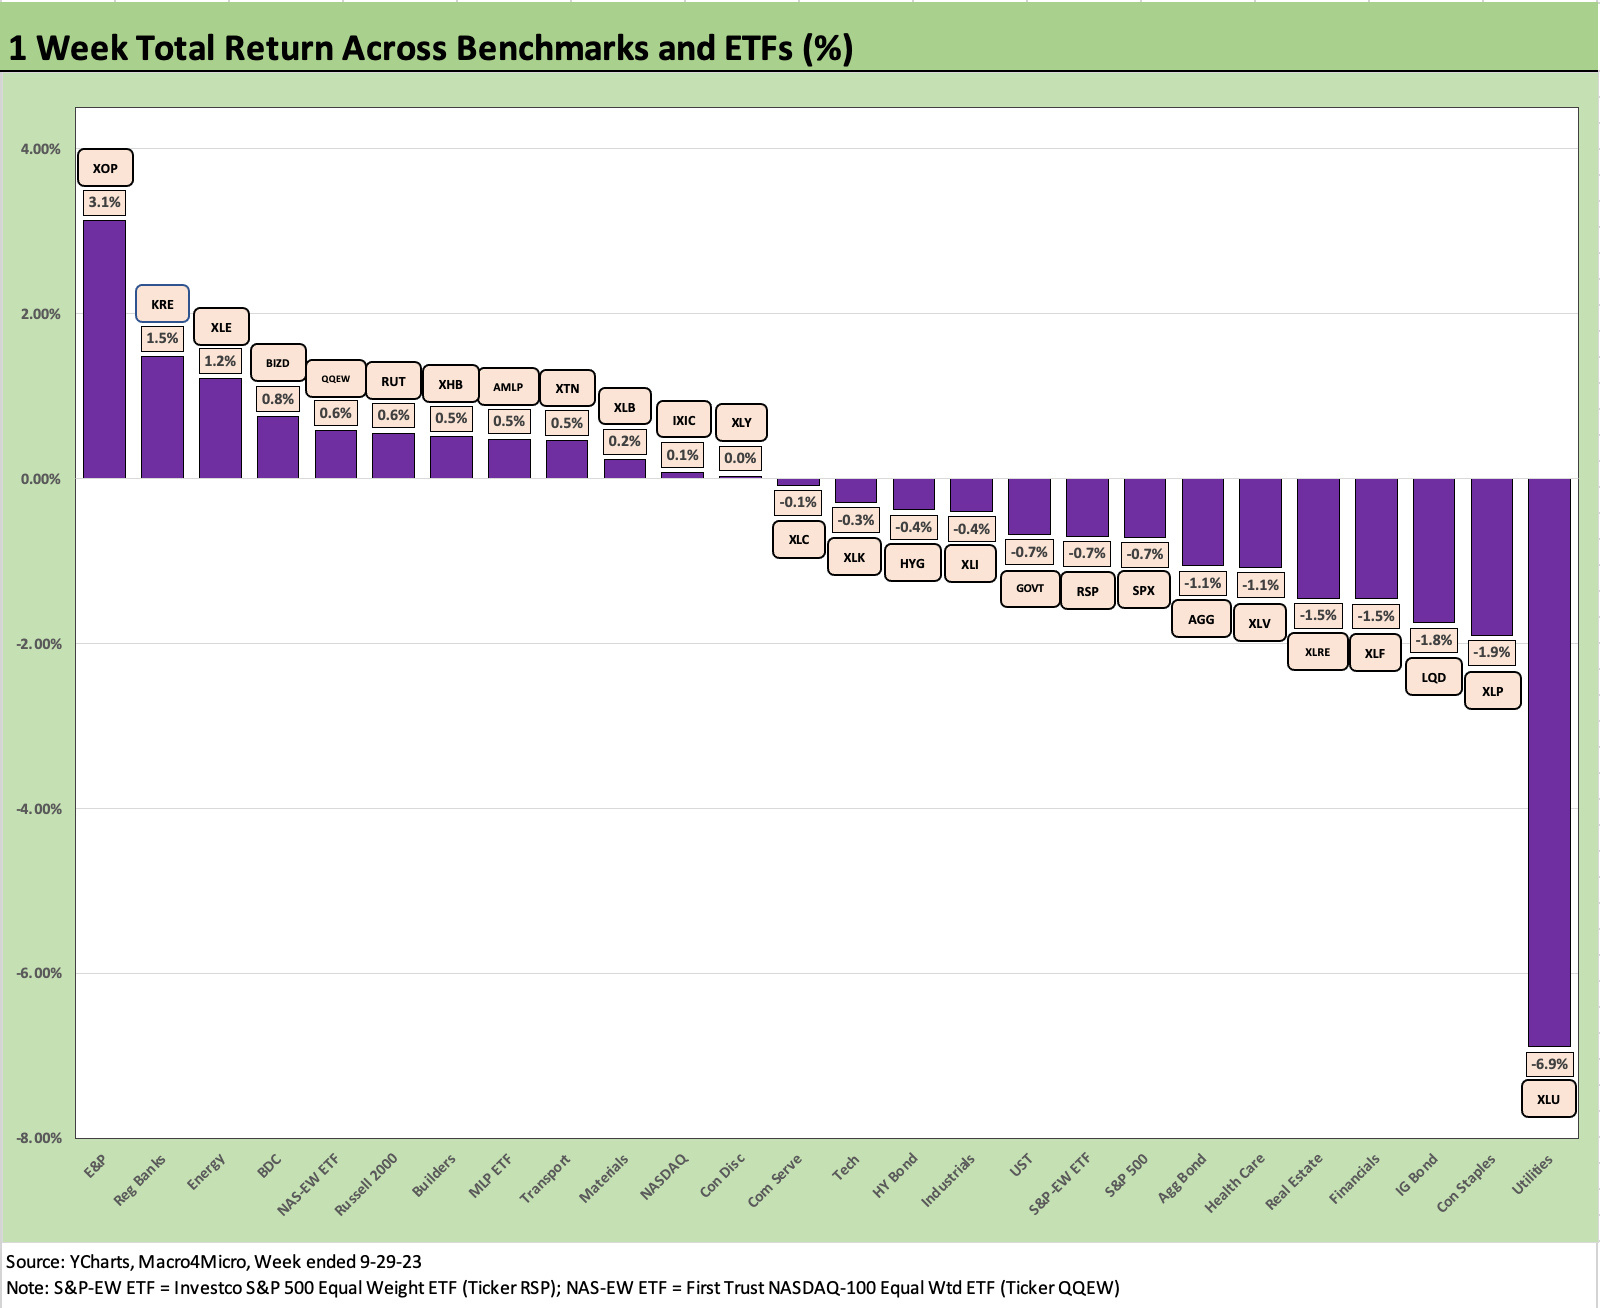
The weekly numbers came in at 12 positive and 14 negative and actually have better symmetry than the 1-month or 3-month. For the week, we see energy in 2 of the Top 3, but only 1 of the 26 posted returns above 1% handles on the week and 3 of 26 were 1% handles or higher. The bottom 3 included long duration IG bond ETF with the interest rate sensitive Utility equity ETF (XLU) in dead last at almost -7%. All 4 fixed income ETFs were in the red.
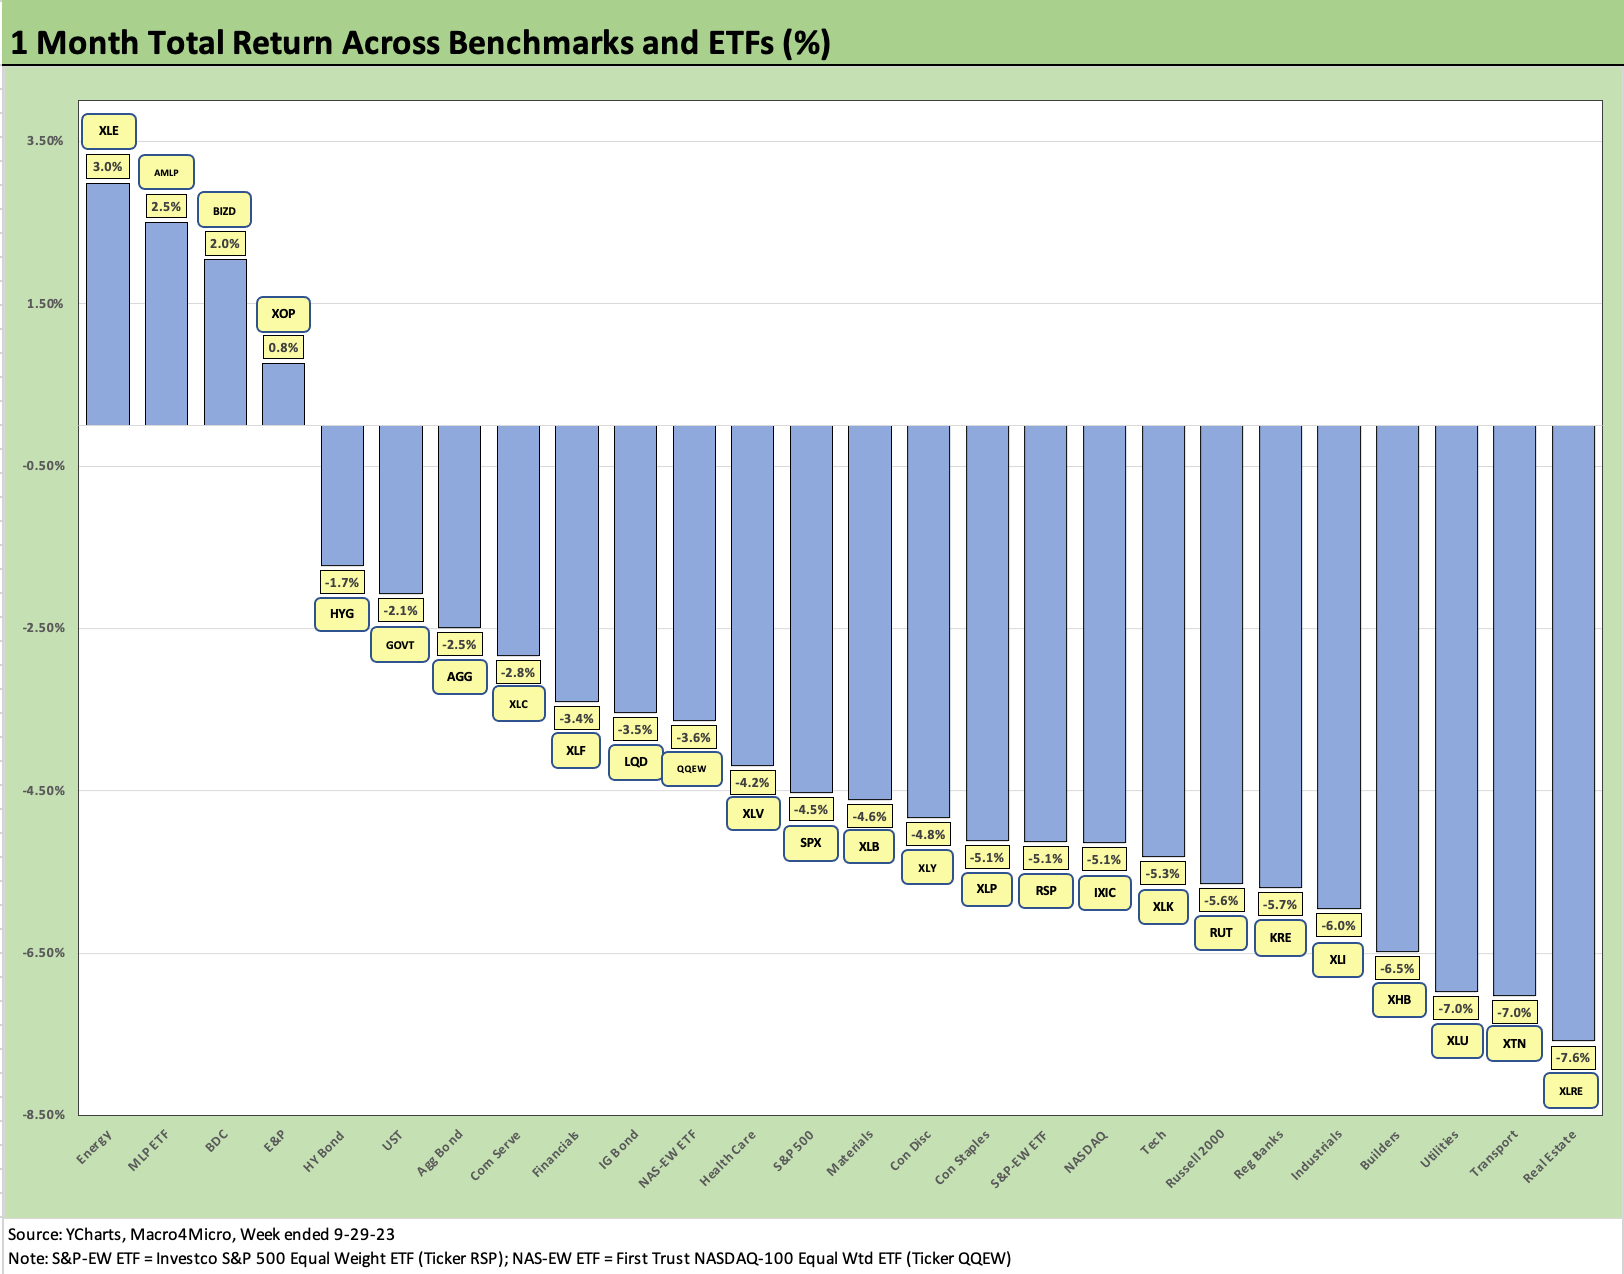
The 1-month return was grim with only 4 ETFs in positive range including 3 energy ETFs and the BDC ETF (BIZD) at #3. In Energy, the Diversified Energy ETF (XLE) placed #1, the Midstream ETF (AMLP) at #2, and E&P ETF (XOP) at #4. We see a mixed bag in the bottom 5 with Builders (XHB) pulling back from its winning ways after running at #3 YTD at almost +28%.
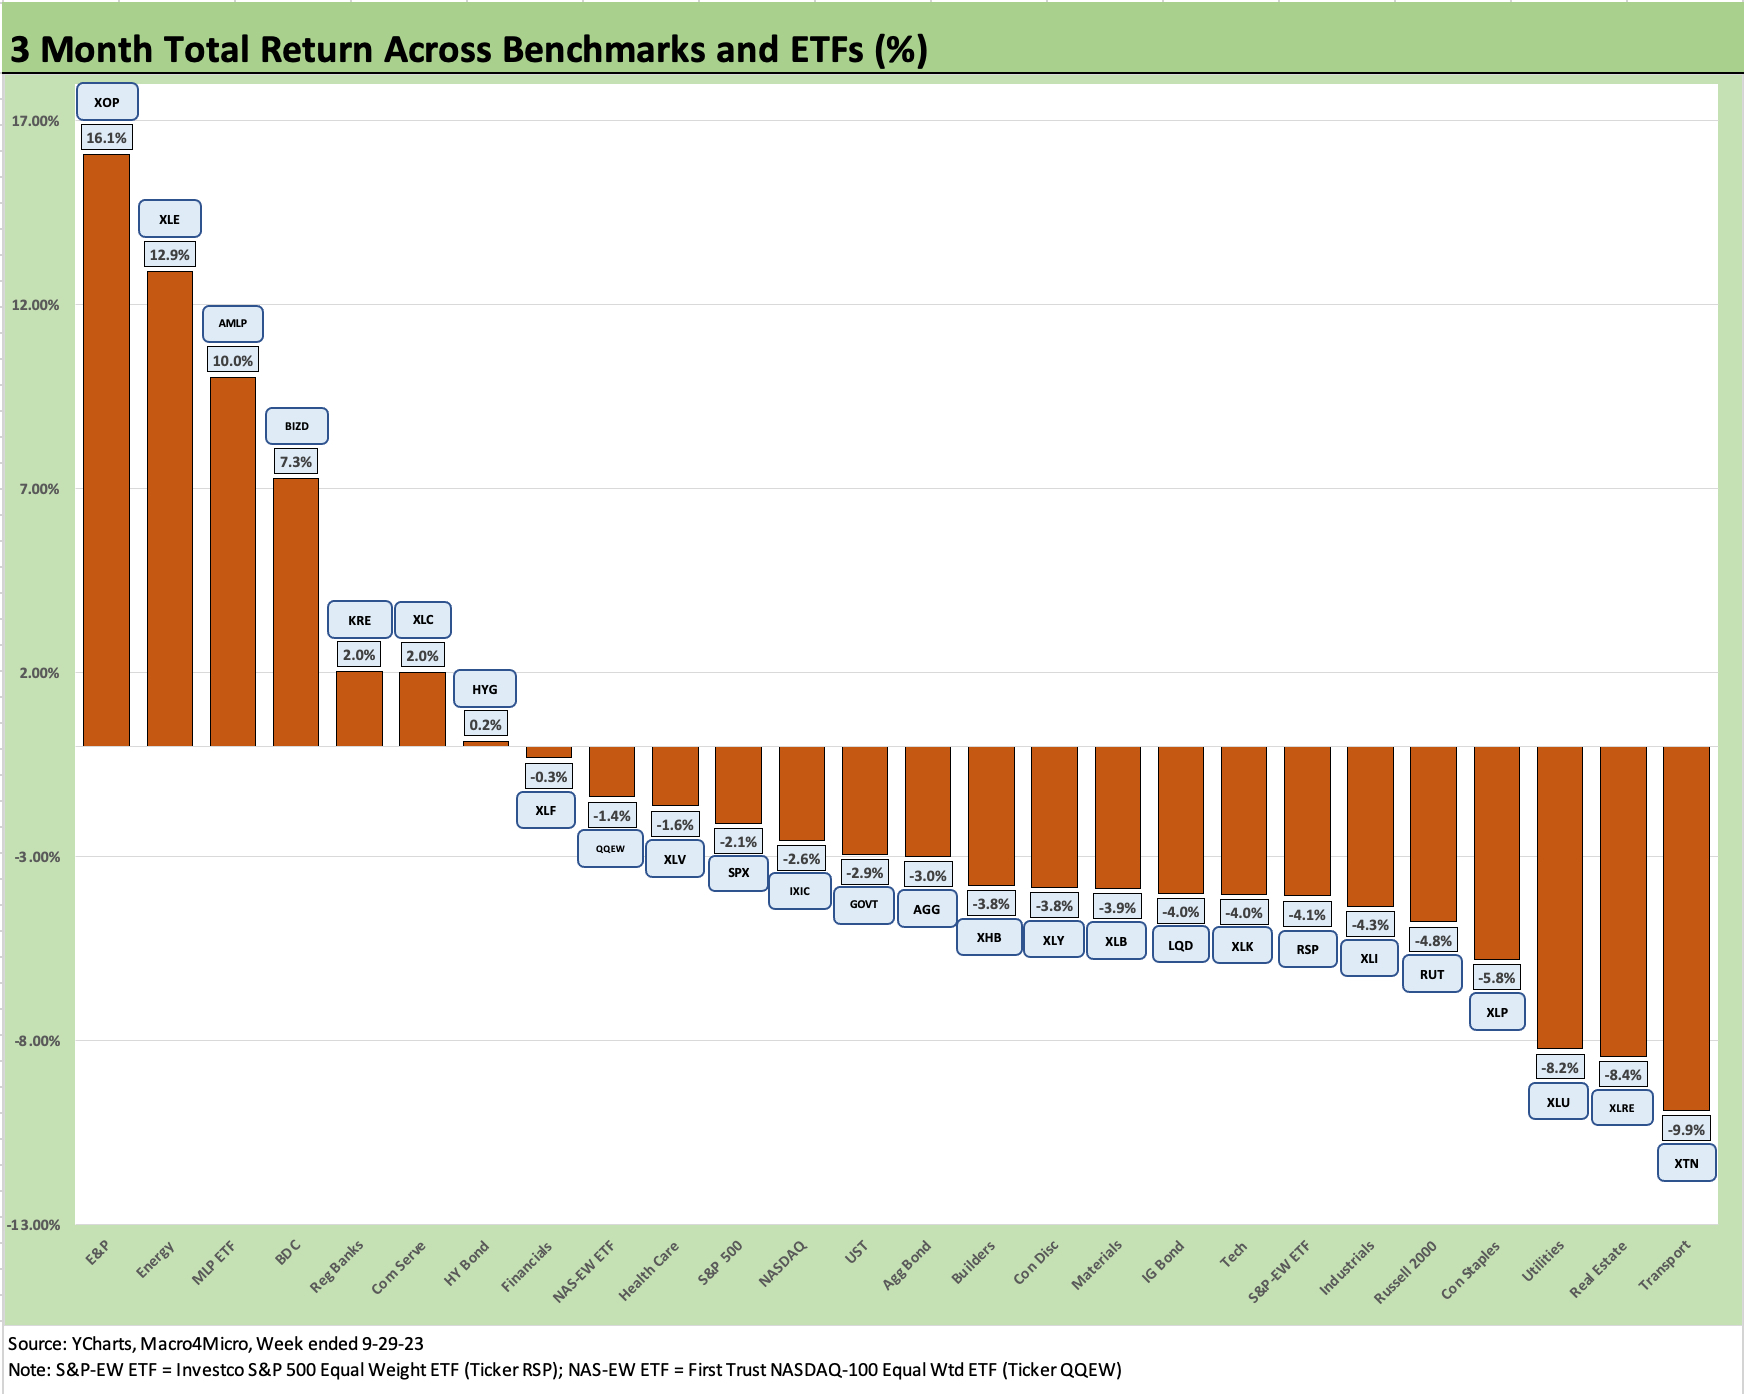
The rolling 3 months came in at 7 positive and 19 negative and a Hi-Lo range of 26 points with a big rally in oil driving E&P (XOP) to +16.1% while the Transports (XTN) got hammered at -9.9%. As we have often seen, Real Estate (XLRE), Utilities (XLU) and Staples (XLP) were surfing the bottom along with small caps.
The upper tier shows a mix of Energy in the lead (XOP, XLE, AMLP) along with BDCs again (BIZD) across the Top 4 with Regional Banks (KRE) a more distant #5 in the post-crash rally. KRE is by far the worst YTD performer at -27% even with the respectable showing in recent months.
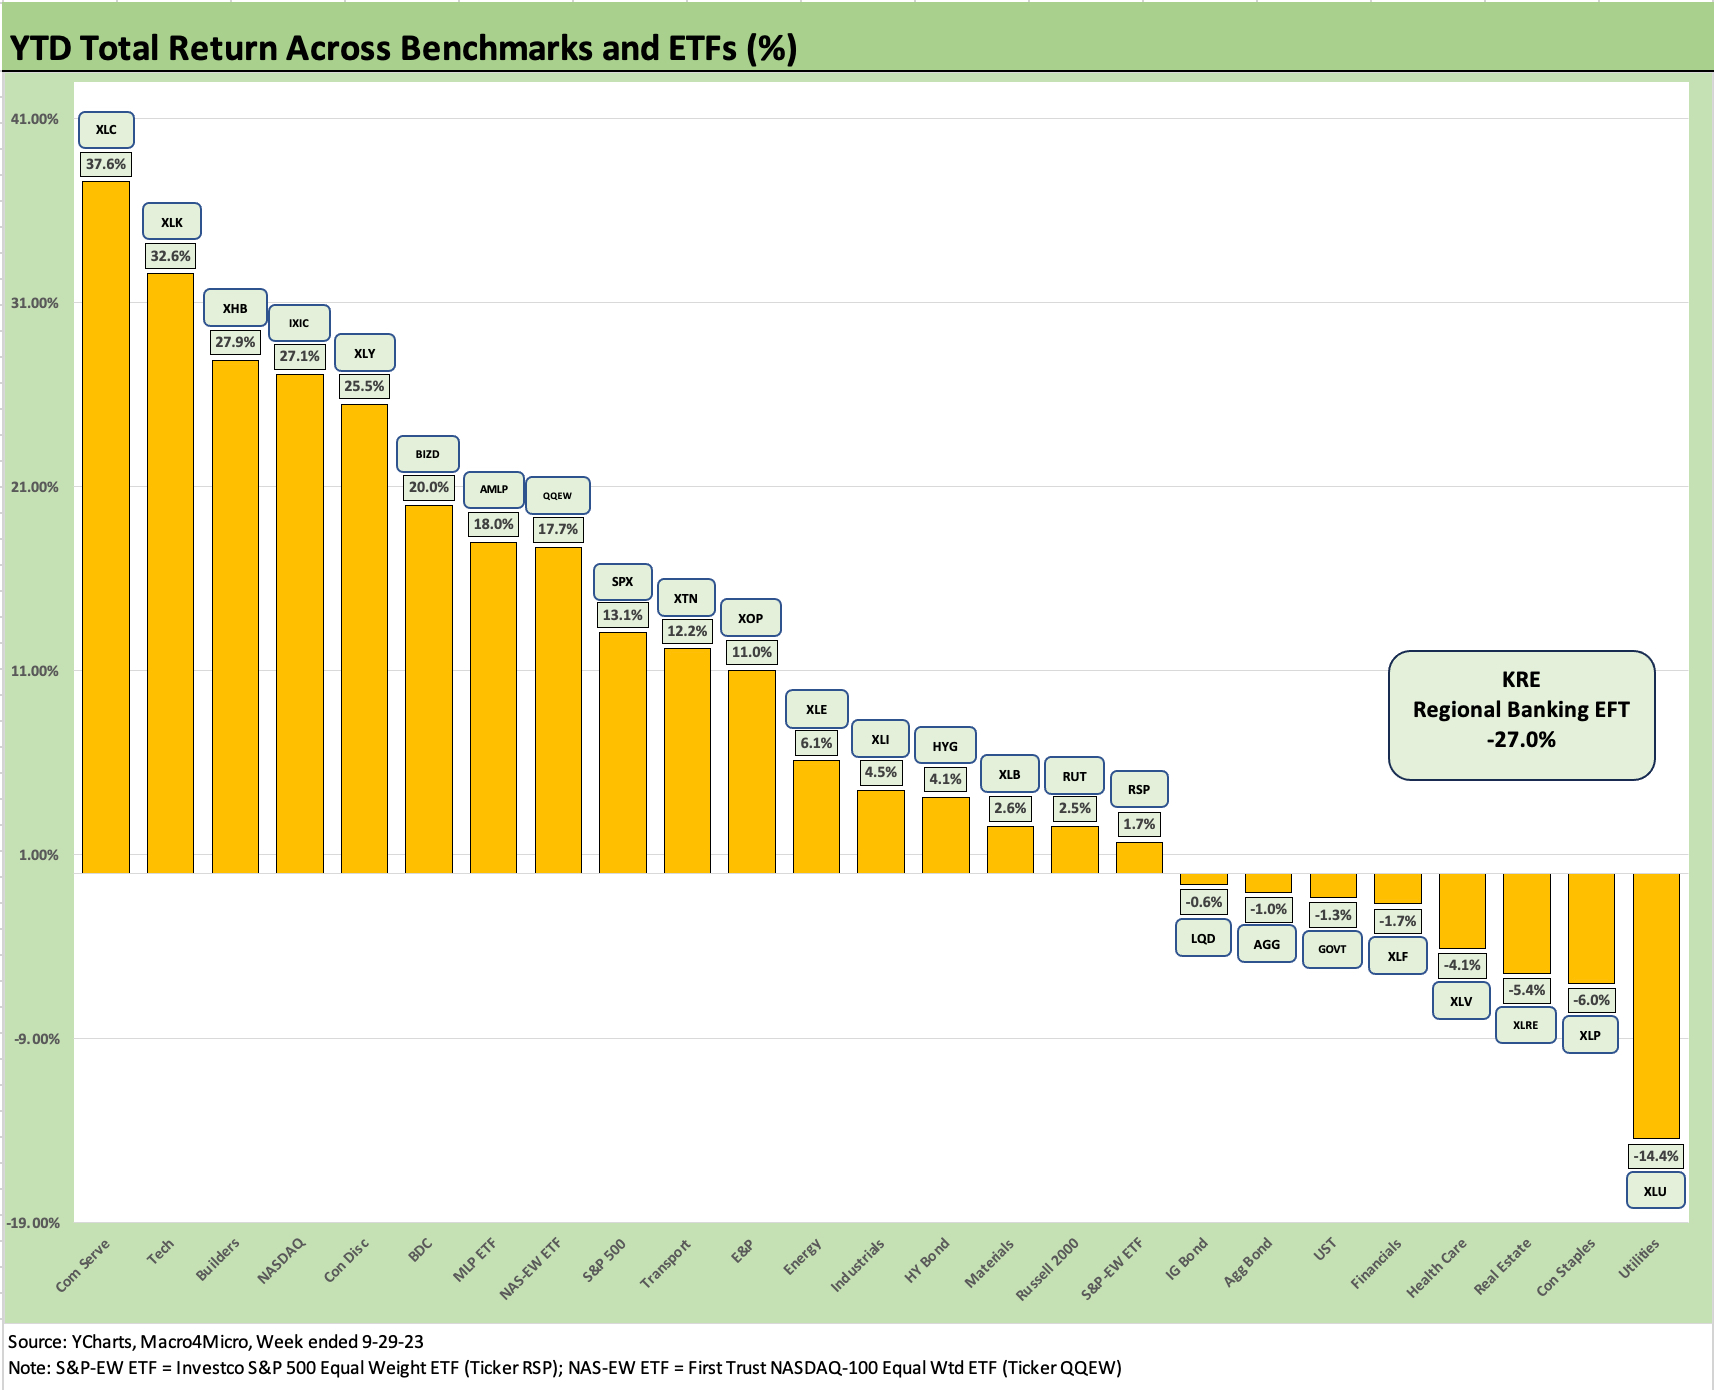
The YTD performance more heavily weighs on the positive side at 17-9. The Magnificent 7 heavy ETFs are still the winners with Communication Services (XLC) #1, Tech (XLK) #2, NASDAQ (IXIC) #4, and Consumer Discretionary (XLY) #5 with only Builders (XHB) breaking up the Mag 7 winners. The BDC ETF (BIZD) at #6 and Midstream (AMLP) at #7 might have surprised some.
The fixed income ETFs (GOVT, AGG, LQD) are hanging around the low end of the 3rd quartile, but HYG put some distance between the shorter duration and higher coupon benchmarks and its bond ETF peers. As we see with BIZD and AMLP, income has helped the total return performance.
The defensive sectors and interest rate sensitive equities on the bottom have been consistent with the pattern across many of the periods we have watched across the earlier stretches of the year. Regional Banks were the disaster of the year and got their own box to not mess up the scale.