
United Airlines: The Camel isn’t Paralyzed Yet
We look at the latest UAL earnings and credit questions in the context of the Boeing delivery uncertainties.


The United Airlines 4Q23 numbers were solid in a year that just fell short of the last pre-COVID year of 2019, but FY23 was still a big rebound from 2022.
The buzz on the earnings call and in the media chatter was still more about the louder, publicly direct criticism of Boeing by United and Alaska, and the fears around the fate of the remaining 737 certifications that are critical to a few airlines in capacity planning, notably United and Southwest.
The leverage numbers for Debt/EBITAR edged down under 3x in a very strong earnings year, but the question around how UAL can put a dent on that total debt number is very much alive given the scale of capex commitments.
The irony is that a $9 bn commitment schedule will preclude debt reduction but a Boeing failure to meet delivery commitments would undermine earnings projections and direct more shareholders to other ways to play the airline sector.
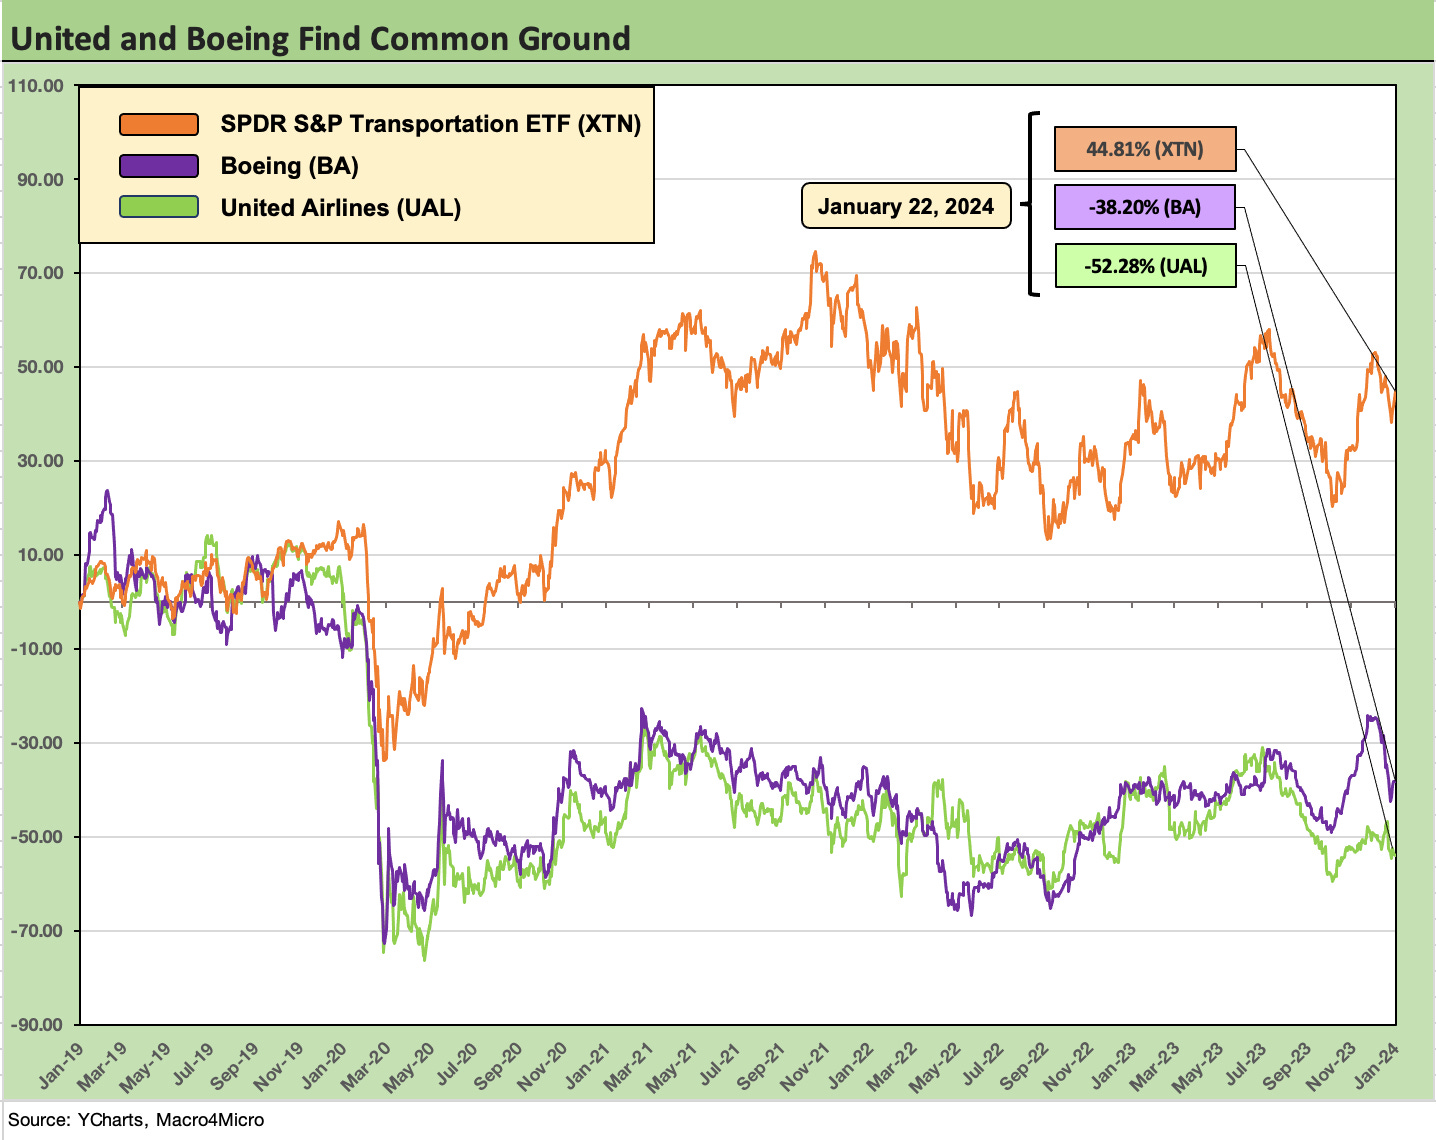
The stock chart above paints a picture of where United and Boeing equity stand since 2019 as the fleet challenge and increasing uncertainty around aircraft delivery schedules lead the headlines these days. For the airlines, the need for more capacity and lower cost operating assets is important. The increasingly hostile tone that was in evidence from United and Alaska over the past two days was jarring in terms of any rethinking of order books and aircraft selection.
We have already weighed in on the framework of the United credit fundamentals after 2Q23 (see Credit Crib Notes: United Airlines (UAL) 8-30-23). We need to scale back the direction of credit quality from Positive to Stable just on the basis of the developing situation around the 737 MAX-9 grounding and what the evolving mess might mean for the capacity planning and profitability ahead in the 2024 peak travel period and into 2025.
We already looked at the mix of Boeing issues as the MAX 9 setbacks initially unfolded (see Boeing: Different Scales, Different Magnitude 1-10-24). This week, the UAL CEO using the phrase “Straw that broke the Camel’s back” after its earnings did not help sentiment nor did the Alaska CEO saying “I am more than frustrated and disappointed. I am angry.” UAL added that they took the MAX 10 out of their internal forecast since they “Can’t count on it.” Ouch.
In the end, the airlines all need the capacity to grow earnings and cash flow before capex. They will likely be looking for concessions and compensation in some form of the sort we detailed in our Boeing piece. In that earlier note, we detail the MAX legacy liabilities for Boeing that they paid out across time. It was billions. Quality problems cost Boeing and their customers money. Their customers will seek compensation and inflict some more costs on Boeing.
The cash flow impact for Boeing will just get added to a bill they have been paying for years, but the ultimate fear is a more extensive switch to Airbus, who is the new narrowbody leader. That switch could extend to widebodies and some analysts pressed United on that topic. That was also the chatter and back and forth over the last few days.
The tendency to extrapolate to disaster should be resisted since the timing of the grounding and certification exercises are highly uncertain in terms of downside, but those risks are more skewed toward Boeing than the airlines. Stalled capacity plans still offer pricing power to keep revenue trends and cost in line. United articulated that the revenue/cost relationship is in much heathier alignment now than past cycles.
Capacity and growth flows into RASM and CASM handicapping…
For UAL more narrowly, the airlines have had a rough enough time in the market without this latest twist with Delta now the clear leader in financial performance across the legacy Big 3 of global carriers (see Delta: Airlines Investors Have a Confidence Problem 1-18-24). UAL has a good case to make that it is closing that gap with Delta with United also having an exceptionally deep international route system and strong high margin franchise on that side. American is still the runt of the litter while Southwest dominates the low cost and short haul markets and boasts cash in excess of debt. AAL and LUV will have their 4Q23 earnings webcasts tomorrow (Jan 25).
No airline is untouched by the MAX developments even if they do not have MAX 9 planes in the fleet. Some will get some short-term benefit if they can exploit capacity shortfalls at United and Alaska, but the whole ecosystem is on edge at this point. The newer “Big 4” moniker includes Southwest as a domestic low cost leader, and LUV has a lot of skin in the game on progress on the MAX 7 certification near term. For many carriers, the MAX 10 with its higher capacity was supposed to be the hot plane of the years ahead.
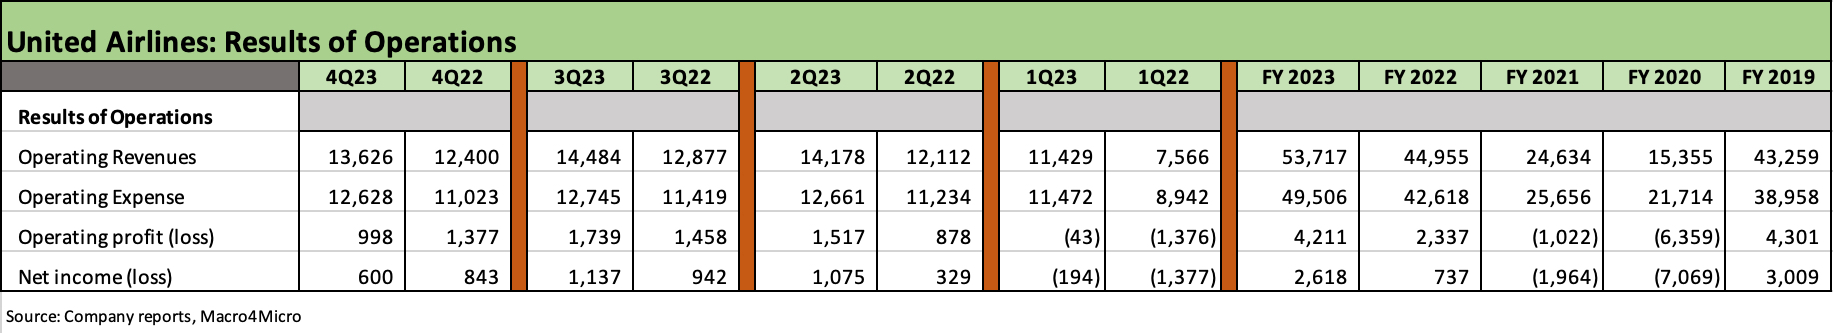
The above chart highlights what an exceptional year United saw in FY 2023 with the best operating income and net income since 2019. That is not saying too much after the brutal 2020 and weak numbers of 2021 saw negative operating income and red on the bottom line. GAAP operating margins of 7.8% are below 2019’s 9.9%, but the silver lining is that revenues were very strong and moved higher in the face of labor costs along with maintenance cost and supplier chain inflation.
The chart also breaks out the YoY quarterly comps, and the peak travel season saw a peak YoY positive variance in 2Q23 as the travel bug was back and consumer spending on hotel and air travel accelerated as the “goods” boom gave way to services and “experiences.” As we detail in the next chart in operating metrics, a rising international load factor and materially lower fuel prices for 2Q23 set the table for the solid 3Q travel period. United carried a record number of passengers in 2023.
The earnings streak this latest travel cycle did not generate anything close to the type of numbers the Big 3 saw back in the 2015 to 2019 stretch. For a comparison, United averaged annual operating income of $4.1 bn from 2015 to 2019 and net income of almost $3.4 bn. The hurdles to get back to that level of earnings is pricing power (tied to the consumer, business travel, mix, and capacity), but capacity is a major swing factor under a cloud right now. Labor costs and infrastructure challenges (e.g. FAA mandates around capacity limits in Newark) are not helping.
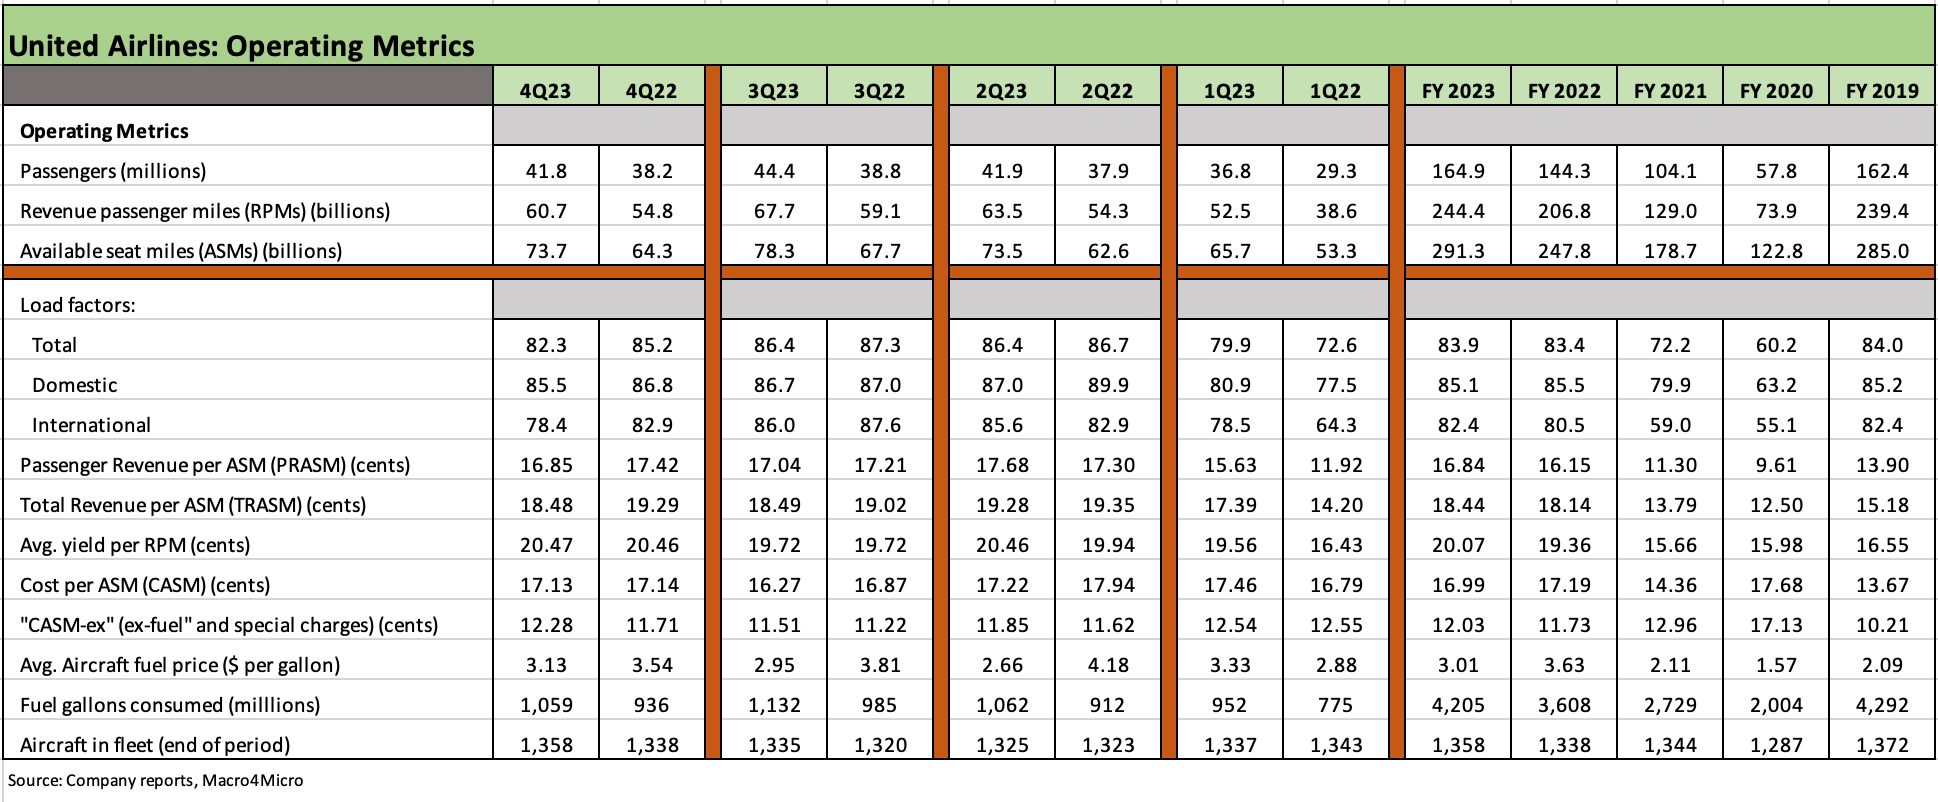
The above chart frames the usual mix of operating metrics that the airline industry uses. These lines got a fair amount of airtime on the call. UAL cited a more stable and favorable relationship in the direction of “RASM vs. CASM.” The theme of cost convergence between the legacy majors and low cost carriers shows the LCCs as seeing disproportionately higher percentage increases across the cycle than what the Big 3 have seen. On that topic, we found the following excerpt from UAL as interesting as we look across the structural evolution of this industry:
“That cost convergence, the whole reason that the low-cost carriers existed… is because they had lower costs. Those lower costs no longer exist. And so that creates, I think, a permanence to the higher margin, a sustainability to that higher margin…it is higher and more stable and more resilient and that is not recognized by the capital markets today.”
Even if any investor can be skeptical looking back over the past five years and question the word “stable,” at least the word “resilient” has a very good case to make.
UAL drove home the point that when all the players are impacted by the same factor (fuel oil increases, sharply higher labor costs), the RASM and CASM more rationally head in the same direction. With so many airlines being battered by overlapping labor deals (and those are ongoing), the fact that profitability was very solid in 2023 for the major carriers was at the very least reassuring.
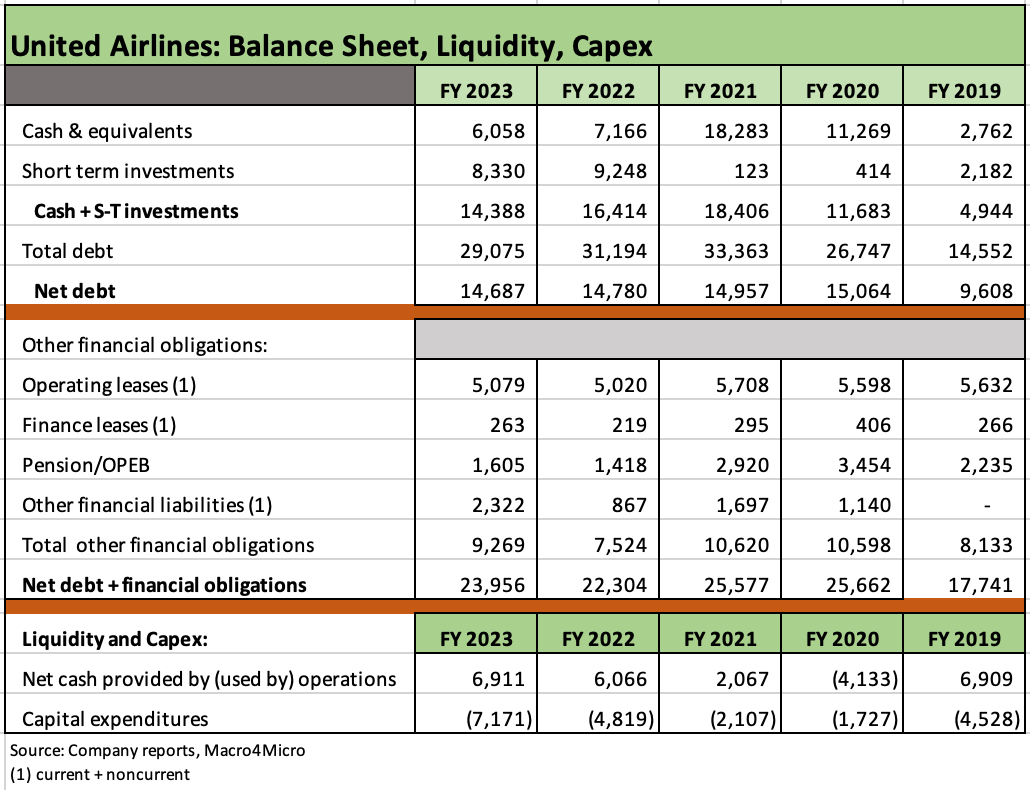
The above chart updates the debt dilemma United faces as we covered in our earlier Crib Note. That is a major debt burden even if soaring EBITDAR makes the leverage number a solid one. Adjusted EBITDAR of $8.1 bn is an impressive earnings base. That takes Net debt/EBITDAR down to 2.9x for 2023 from 4.3x in 2022.
The challenge to generate enough free cash flow to meaningfully reduce the total debt balance at UAL was already a challenge with $29.1 bn in total debt at 4Q23, or twice the level of 2019. On a net debt basis (net of cash and short term investments of $14.3 bn), it looks more manageable. The swing factor is the massive order book with contractual estimates of potentially $9 bn but is likely to come in much lower on aircraft delivery challenges.
UAL fielded some questions on their conference call around the capex number and their ability to lower debt. The FCF shortfall relative to capex when framed vs. a major capex cycle will either drain cash (increase net debt) or drive more borrowing or lease obligations on the total debt and liability lines. UAL really did not have a good answer since some of these capex “events” are outside their control and are more tied to Boeing and the FAA.
Some clarity on the capex and cash flow handicapping will likely need to await the May 1 Investor Day in Chicago.