

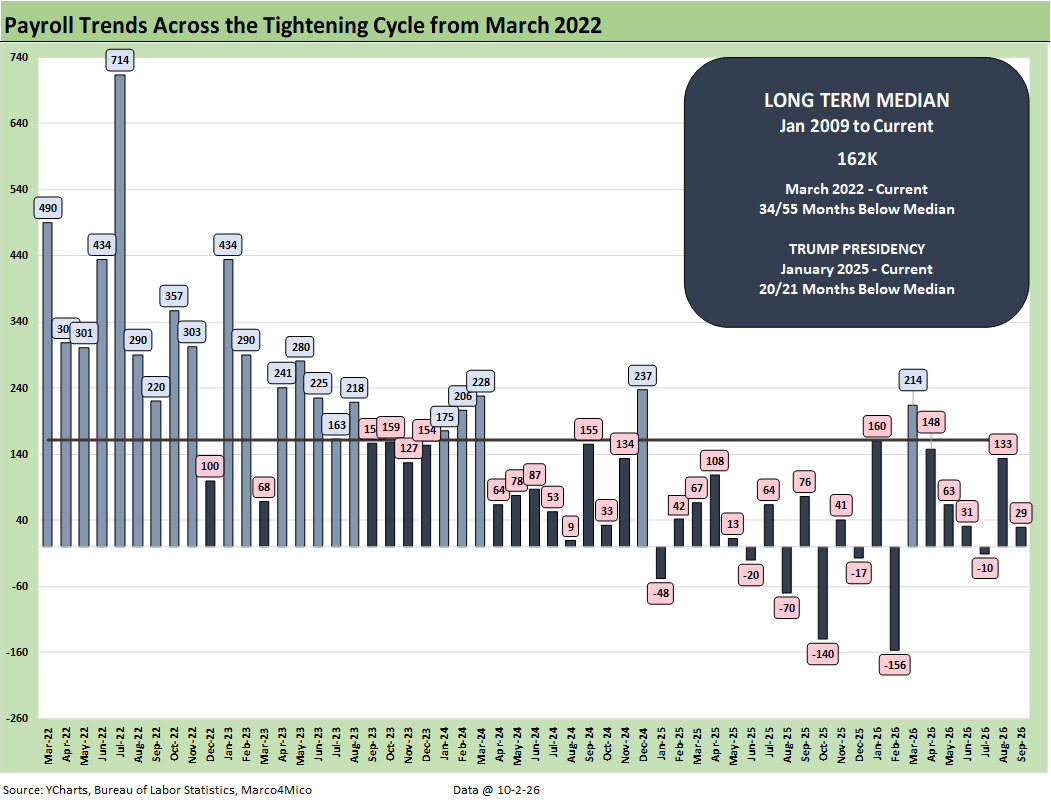
September payroll additions of only +29K and a sharp downward revision in August (revised down by -29K to +133K) and a -31K revision of July to -10K combined with anemic a +3.0% wage growth number to take pressure off the FOMC and sent the UST lower. This was one of those “bad news is good news” months for markets, but the numbers are not favorable in what it says about prospects for job seekers. The slight uptick in the unemployment rate to 4.2% is still a full employment rate by historical standards. However, it is not a consumer confidence builder.
As noted in the bar chart above, the timeline from March 2022 (when ZIRP ended and the tightening cycle began) now show 7 months in negative range. All of those negative payroll months are in the Trump 2.0 term. That is unlikely to alter the “Golden Age” daily end zone dance and ‘hottest country in the world” rhetoric. If you need a job, you might not feel so hot. That is a problem for job seekers broadly and recent graduate narrowly who need a paycheck.
The wage growth of 3.0% is below the headline PCE of 3.4% we discussed this week (see PCE August 2026: Income & Outlays Show Firm Demand 10-1-26). Negative real wage growth does not signal inflation from wage pressure as that wage growth stalls, but it is also not a good sign for the K-Shaped story line. The 2Q26 GDP numbers and the August PCE report showed solid personal consumption expenditure growth (see Macro Dance-Off: PCE Growth vs. Fixed Investment 10-1-26, GDP 2Q26: Bullish Final Revisions 9-30-26). Sustaining PCE growth at or above 3% will not be easy.
Wage growth below inflation at a time when financing rates and select product segment PCE price moves are above 3.0% makes for bad consumer math. It certainly will not help at the pump or the home heating and/or power bill. That will keep eyes on the sustainability of growth in PCE, which adds up to around 68% of GDP.
Some good news was evident in the uptick in the participation rate to 61.8% in the Household Data as the civilian labor force grew by 485K. The number employed grew by 406K vs. the number unemployed which only grew by 78K. More good news was seen in the U-6 (structural underemployment rate), which ticked lower to 7.6%, down YoY from 8.1% in Sept 2025.
Over in the Establishment Data, the +29K job adds are captured in the chart above, and we fortunately see some growth in Goods at +18K (including Construction +11K, Manufacturing +9K) while Services rose by +28K with Government dropping by -17K.
Overall, it was a poor payroll month continuing the trend of only 1 of 21 months in Trump 2.0 posting payroll additions above the post-Jan 2009 median.