


The +6.5% PPI YoY for final demand is the highest since Nov 2022 (7.4%) with “final demand goods” YoY PPI at +10.2% and “final demand services” at +5.0%. Processed goods intermediate demand weighed in at +14.6% and “materials and components for manufacturing” was at +10.9%, so the cost and pricing struggles continue.
While many of the YoY numbers are still grim by individual line items, the MoM trends are mixed with Energy at least coming down off the high wire act at -0.1% MoM after +10.0% in Sept. The +37.0% YoY for energy offers a stark reminder of what has unfolded since Iran.
We also see “foods” ticking higher in Sept and Oct after we saw similar adverse trends in the food line of CPI (see CPI October 2026: Stubborn, Unfriendly Food Metrics 11-10-26).
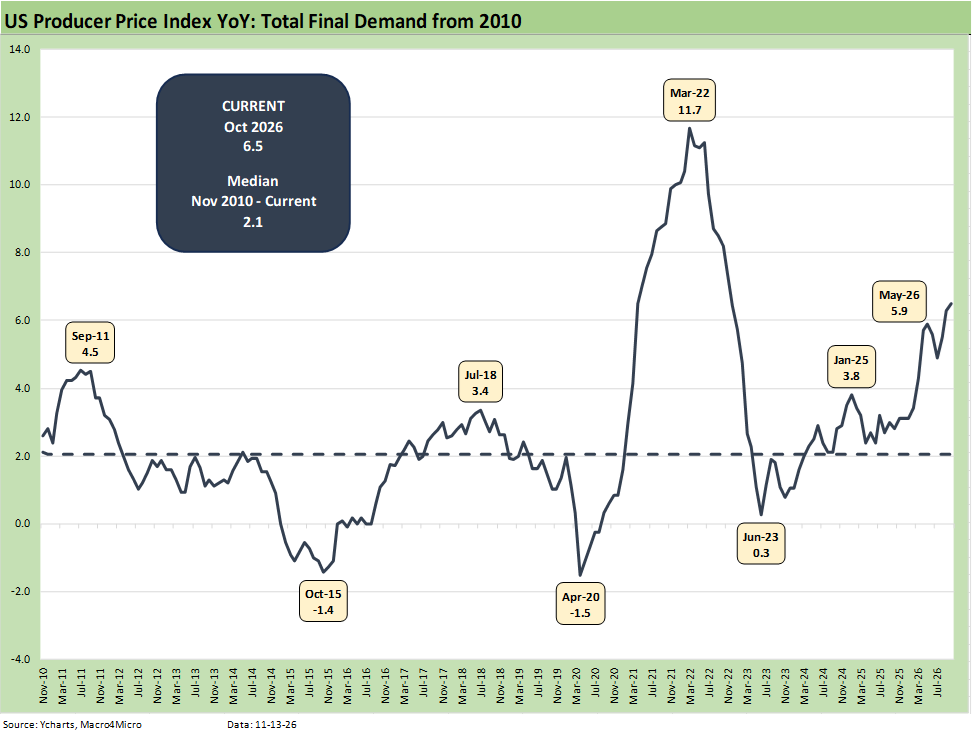
For October 2026, we see another round of PPI headlines with the “worst since 2022” attached, and that about sums it up right there.
The chart details the PPI headline final demand from Nov 2010 through October 2026. The trend line tells its own story with PPI today posting 6.5%, up sequentially from 6.3% in Sept, or more than triple the median from 2010 when the market was in the middle of Obama’s first administration.
Back in 2010, ZIRP was the Fed monetary policy that continued through Dec 2015. That came after the markets emerged from of the worst of the financial crisis period in 2009 when the economy bottomed in June 2009. As the rebound continued off the June 2009 lows, PPI hit 4.5% in Sept 2011 as the sovereign crisis also was peaking.
We then saw another small peak in July 2018 at 3.4% before the post-COVID inflation wave rolled into the 2022 peak. Calendar 2018 (Trump 1.0) was an ugly year for asset returns with corrections and a brief bear market for some equity benchmarks into the fall (see HY Pain: A 2018 Lookback to Ponder 8-3-14, Past-Prologue Perspective for 2025: Memory Lane 2018 6-5-25).
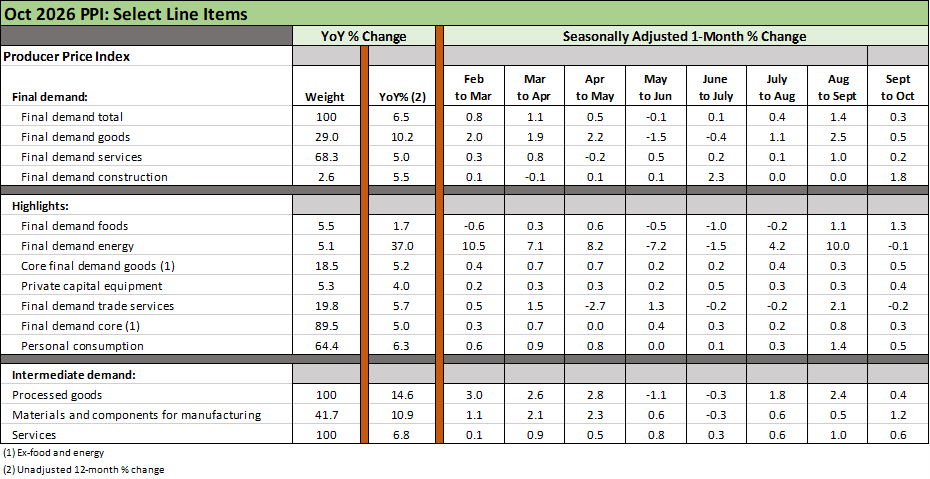
The above table updates some key PPI lines for October 2026. The trend offers little relief even if energy is settling down in sequential moves. PPI for YoY “Final demand total” ticked up to 6.5% from 6.3% in Sept and 5.4% in August. “Final demand goods” (29% of PPI index) YoY rose to 10.2% from 9.8% in Sept and 7.7% in August. “Final demand services” (68.3% of PPI index) moved to 5.0% in Oct from 4.9% in Sept and 4.5% in August. “Final demand energy” rose to 37.0% from 35.4% in Sept and from 24.4% in Aug.
We also highlight a few intermediate demand headline indicators at the bottom of the chart, and those YoY trends also bring bad news even if the MoM trends are mixed. Both “Final demand goods” and “Final demand services” show declines MoM, so that helps the story.
Energy shows impressive MoM relief, moving to -0.1% from +10.0% in Sept and from 4.2% in Aug. “Final demand core” posted a decline to +0.3% from +0.8% while “Core final demand goods” ticked higher to +0.5% from +0.3%.
Overall, if you see PPI as a leading indicator, macro pressure remains high on inflation and/or on costs (and thus on margins for some). Pricing power is an industry-by-industry and goods vs. services drill-down exercise. 3Q26 earnings and guidance season still show solid and steady demand trends, and that usually means pricing power. The market has been hearing about cost pressures from tariffs to energy and raw materials and certainly semiconductors.
The oil wildcard and Iran escalation is not predictable, but the election beatdown of the GOP should make the White House think long and hard and less on “sole actor” impulse.