


Hottest country in the world…except for the patches of ice.
The week was not pretty, and the 1-month period posted a score of 4 asset lines with positive returns and 28 in negative range across our usual sample group of 32 benchmarks and ETFs.
Tech unsurprisingly has been the resilient asset grouping while the energy outperformance was serving as a pain point for bonds and drove cost pressures for too many other sectors.
For the YTD period, 6 of 7 bond ETFs are in the red while energy related ETFs take 3 of the top 4 slots.
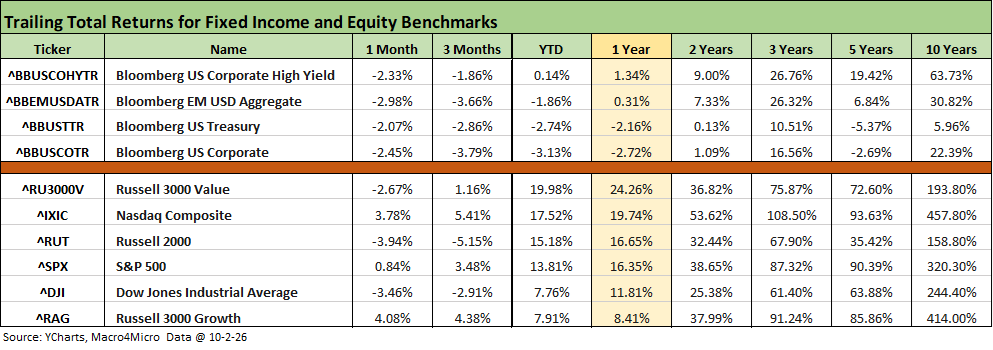
The above table breaks out the debt and equity benchmarks we monitor with related time horizon returns.
We see all 4 fixed income benchmarks in negative range for 1-month and 3-month horizons and 3 of 4 YTD with HY positive but only at +0.14%. Looking back over the 1-year timeline, we see 2 fixed income benchmarks in positive range but only at +1.34% for the best performer with HY.
Equities posted a decidedly mixed trailing 1-month period with tech and growth posting positive numbers for NASDAQ and Russell 3000 growth. The Russell 2000, Russell 3000 value, and the Dow were in negative range for the month. The S&P 500, with its tech-heavy mix, managed to eke out a small positive return at +0.84%.
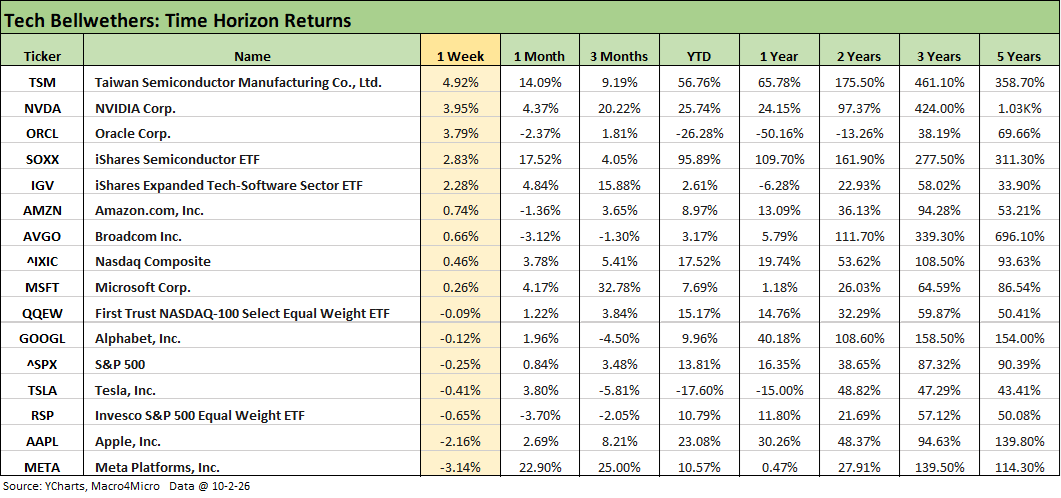
The tech bellwethers were mixed in what was generally a good week more broadly for tech with the Semiconductor ETF (SOXX) and Software ETF (IGV) north of 2%. We see only 3 of the Mag 7 in positive range on the week with 4 negative including Meta and Apple sitting on the bottom.
Oracle (ORCL) remains the worst of the single names on the list YTD at -26.3% while Taiwan Semi (TSM) was the winner at +56.8%. We look at the broader list of single names in charts further below where Micron (MU) wins the YTD clash of the semis with Dell the leader of the broad mix of AI ecosystem names.
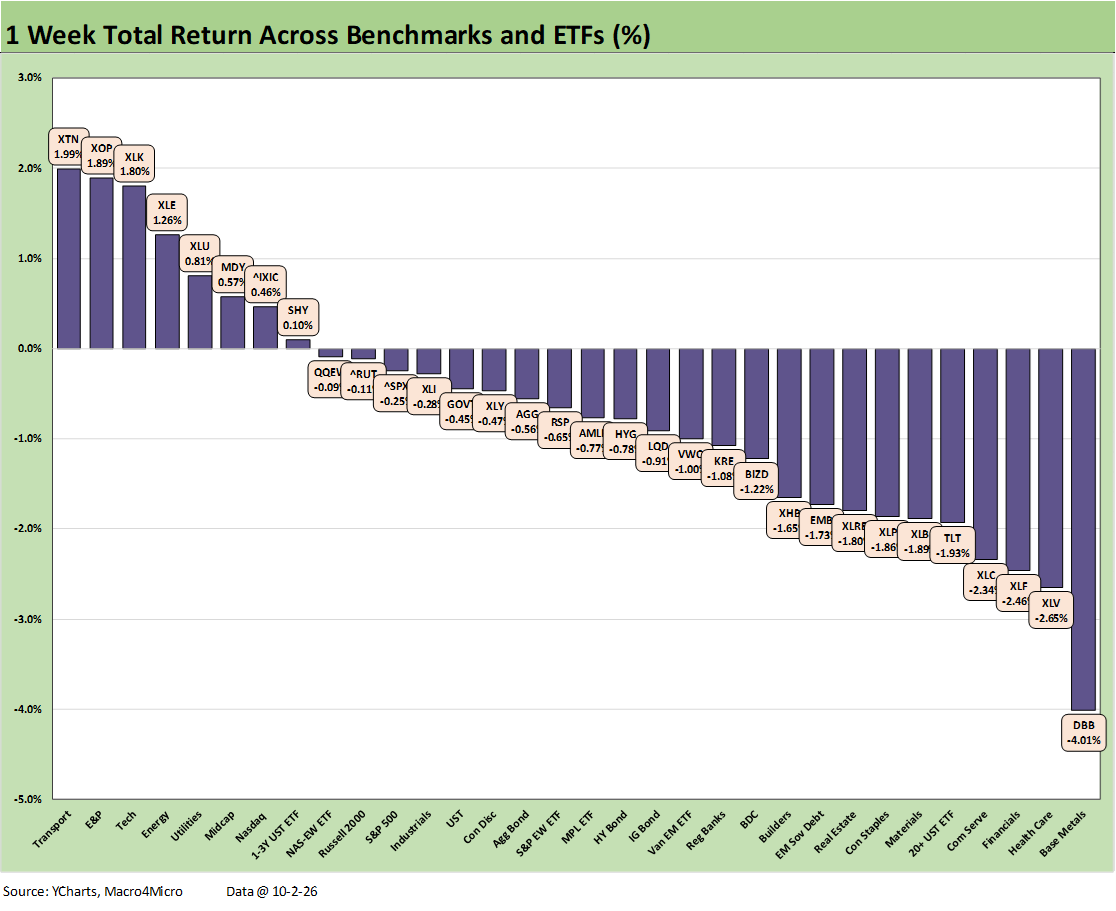
We already addressed the 1-week asset returns in a separate commentary (see Weekly Returns: Benchmarks and ETFs 10-3-26). There is no getting around the fact that it was another bad week with a score of 8-24 positive vs. negative.
The UST curve was moving the wrong way after a very brief intraday rally after the payroll numbers before closing at higher yields (see Weekly UST Deltas: Major Moving Parts 10-3-26, Payroll Adds/Declines Sept 2026: Negative Revisions, Weak Payroll 10-2-26). The week saw some more 52-week highs for long-dated UST.
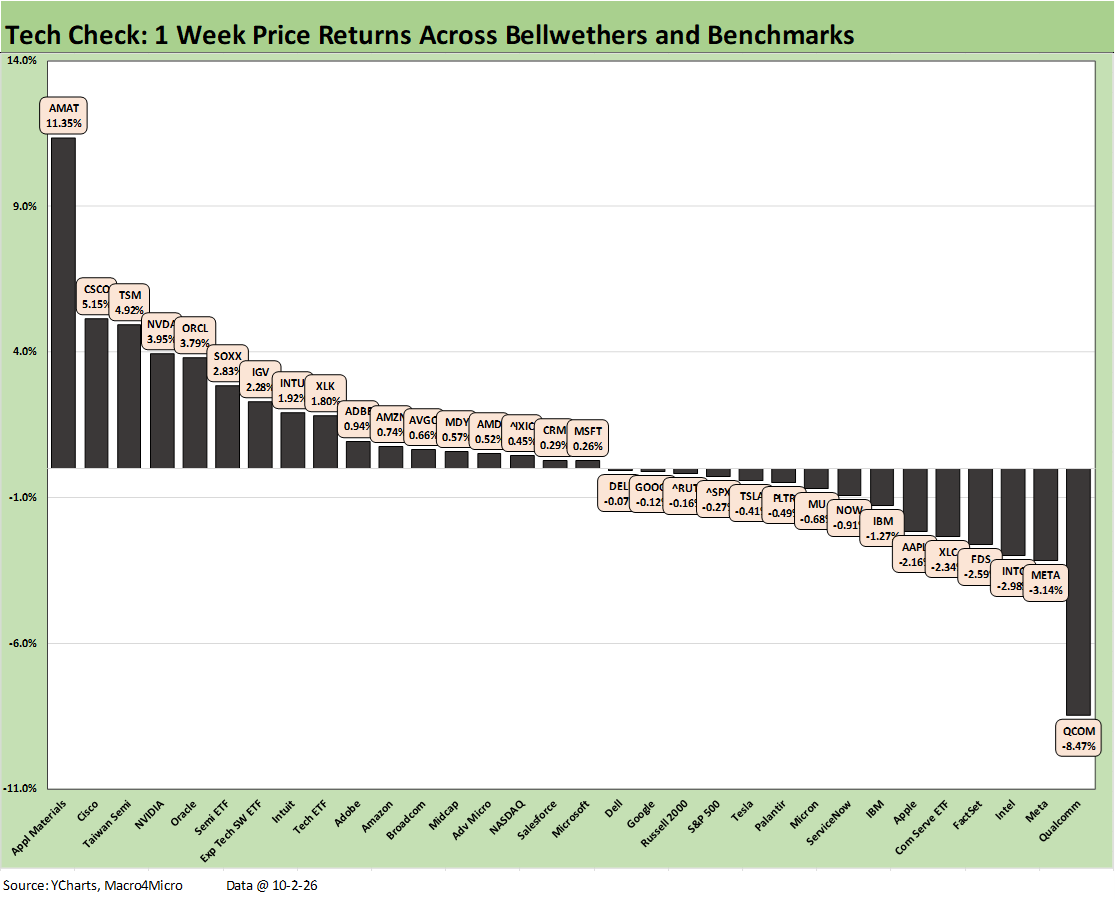
We already posted on the 1-week Tech Check asset list (see Tech Check: Weekly Price Returns 10-3-26). We see a balanced score of 17-15 positive vs. negative returns with a better relative mix in the top quartile from semiconductors and a modestly heavier weighting of software and SaaS-based services names in the bottom quartile.
Micron (MU) posted 4Q26 revenue up almost 5x YoY with 87% gross margins, but MU still sold off on the day and was negative for the week in the bottom of the 3rd quartile.
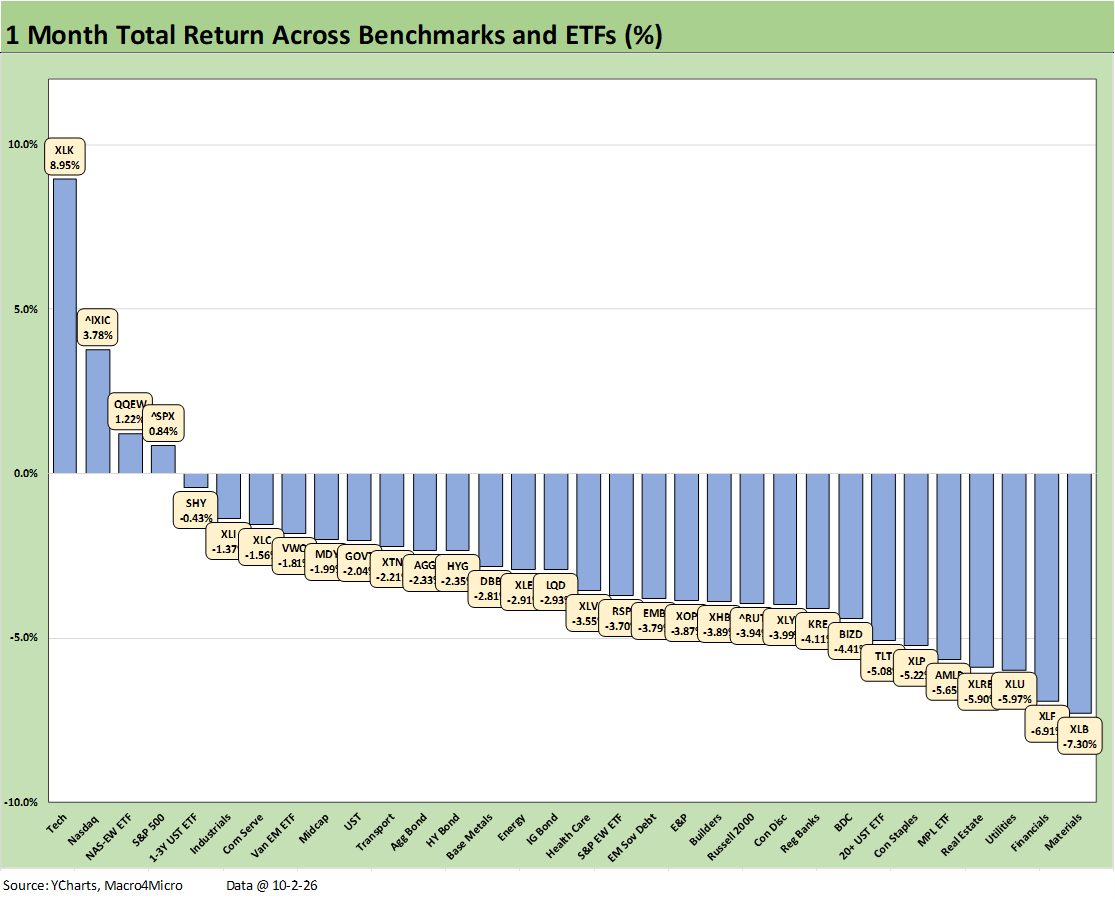
September is typically a bad month for equities, but this was especially ugly in the context of all the AI celebrations. We see a score of 4-28 with a heavy tech flavor from the Tech ETF (XLK) joined by the NASDAQ and Equal Weight NASDAQ 100 (QQEW) in the top 3. The tech-heavy S&P 500 was only slightly positive at +0.84%.
In the bottom quartile, we see a heavy weighting of interest rate sensitive and dividend heavy asset lines. All 7 bond ETFs were in the red with the long duration 20+Y UST ETF (TLT) in the bottom quartile.
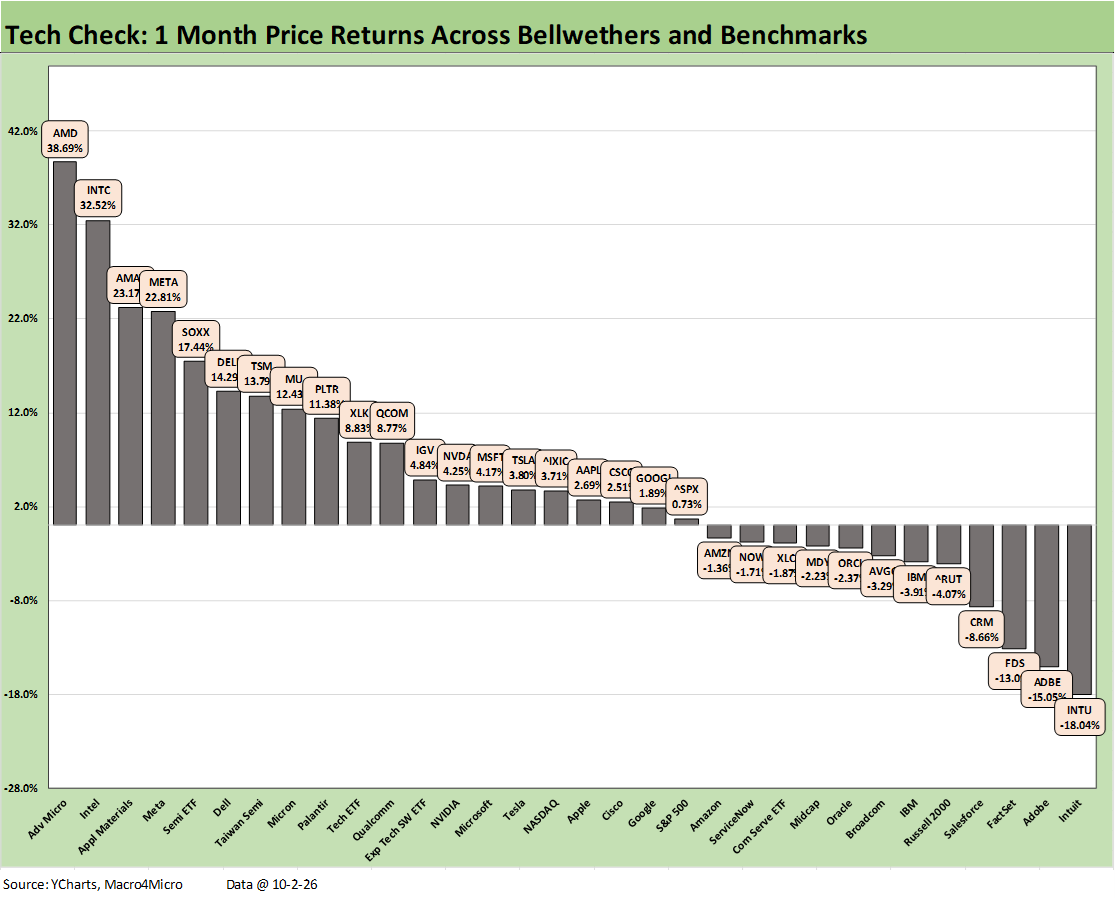
The 1-month Tech Check returns showed the semiconductors and AI ecosystem plays with a dominant weighting in the top quartile. That included the Semi ETF (SOXX). Meta also broke into the top tier lineup for the month on the Muse headlines.
The bottom tier once again was heavy on software and SaaS with Intuit (INTU) on the bottom joined by Adobe (ADBE), FactSet (FDS), and Salesforce (CRM).
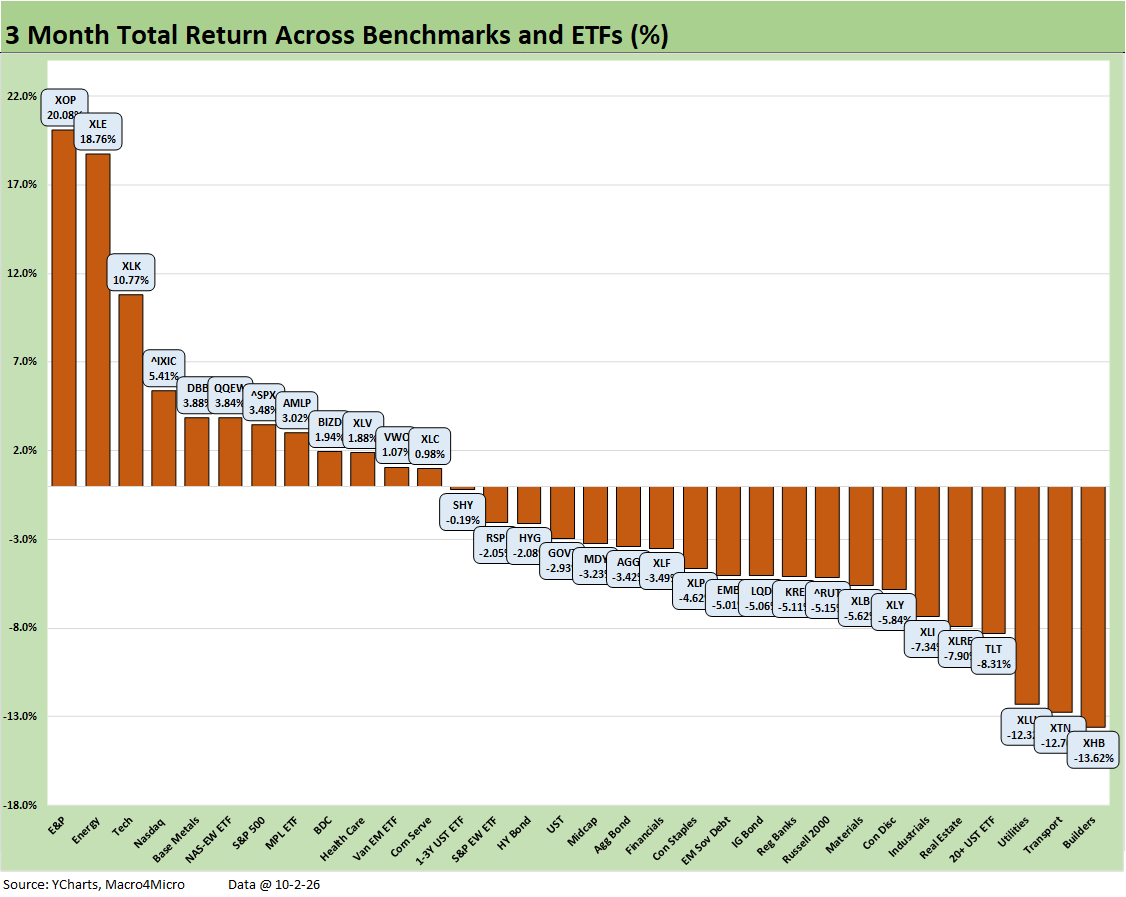
The 3-month returns for the broader asset mix group weighs in at 12-20 for positive vs. negative. Energy related ETFs post 3 in the top quartile with E&P (XOP) at #1 and the broader Energy ETF (XLE) at #2 with Midstream at the bottom of the top quartile. The top tier includes the Tech ETF (XLK) at #3, NASDAQ at #4, Base Metals (DBB) at #5, and the Equal Weight NASDAQ 100 (QQEW) at #6 with the tech-heavy S&P 500 rounding out the top quartile lineup.
The DBB performance was one more factor feeding the raw material cost pressures that will have to find its way into pricing somewhere along the chain – even if just in part. Some of the non-energy price pressures on various chemicals and base metals are also tied into the Hormuz disruptions.
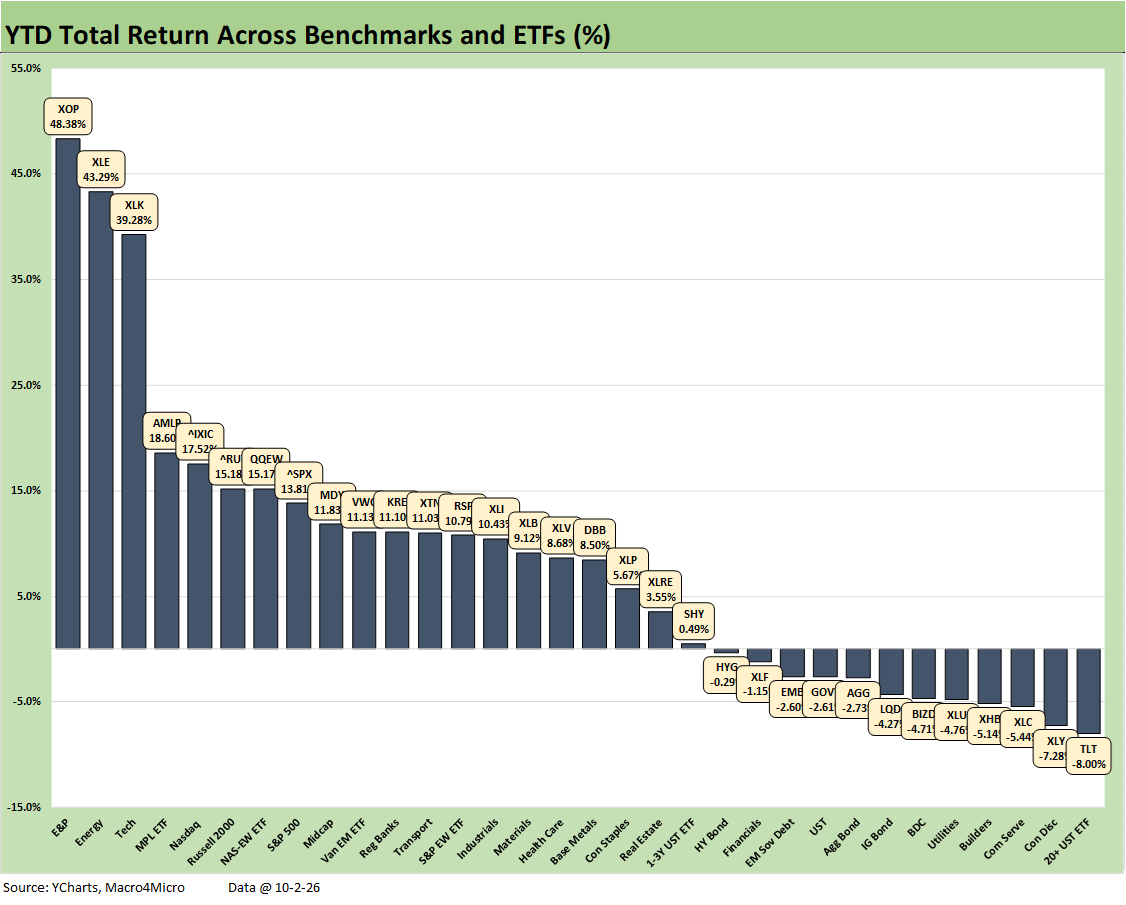
The YTD score for the broader group of 32 presents a mix much like the 3-month horizon with energy and tech leading the way. Energy exposure makes up 3 of the top 4 with Tech (XLK) at #3 mixed in with E&P (XOP) at #1, Energy (XLE) at #2 and Midstream (AMLP) at #4.
We see tech-heavy NASDAQ in the top quartile with the Equal Weight NASDAQ 100 ETF (QQEW). The small cap Russell 2000 made the top quartile after a very strong start but faded over the past few months.
Interest-rate-exposed ETFs are heavy in the bottom quartile with the long duration 20+Y UST ETF (TLT) in dead last and 2 other longer duration ETFs in the bottom tier.
The BDC ETF (BIZD) has had its share of headline problems on redemption requirement headlines outside the BDCs in private credit holdings. Despite that overhang, BDCs have been mounting a mild comeback as quarterly earnings push back on the more dire scenarios.
Consumer Discretionary ETF (XLY) remains a problem and is sitting in second to last at -7.28%. XLY had a slew of names with material underperformance YTD (Tesla, McDonald’s, Lowe’s, DoorDash, Booking Holdings, TJX, etc.). While PCE has held in well with the latest round of data, the consumer and “K recovery” themes will remain in the front burner.
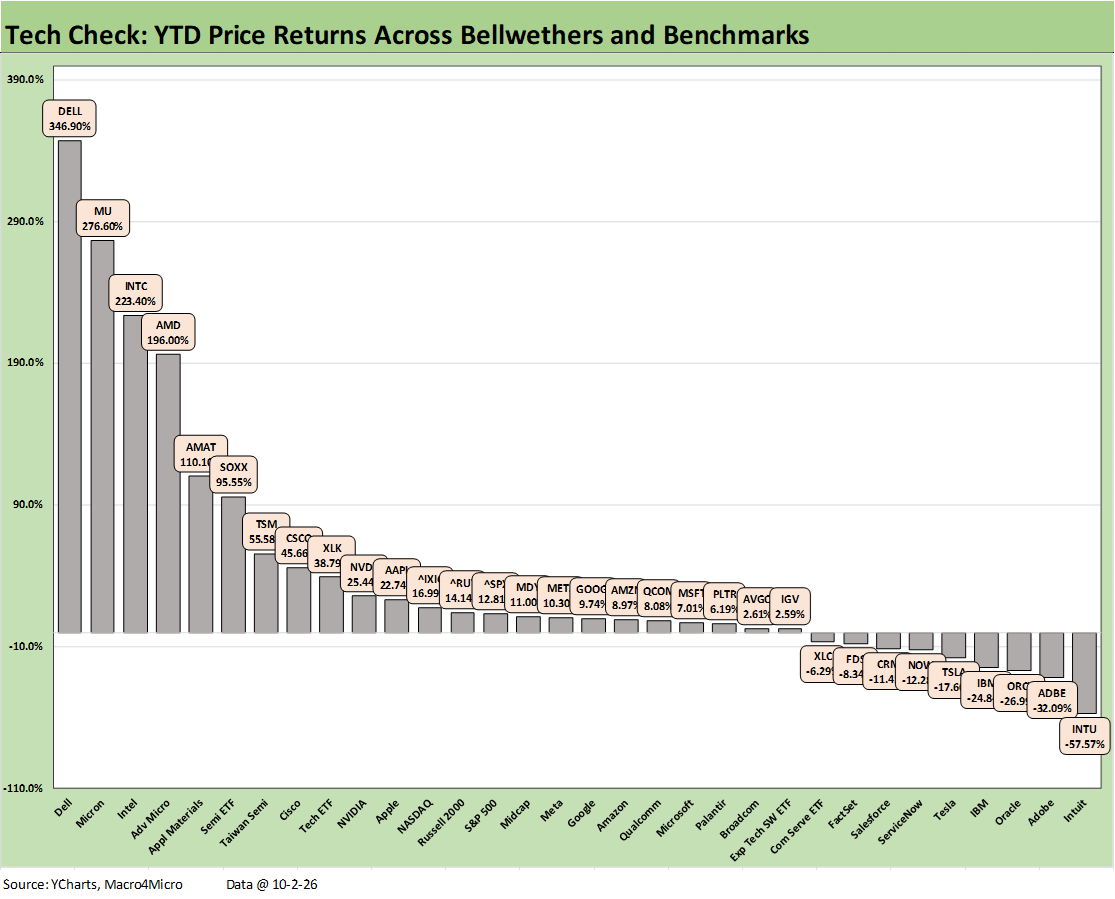
The Tech Check asset lines YTD are in line with where the subsectors have been aligned in recent commentaries. The semiconductor names and AI ecosystem bellwethers (Dell, Cisco) were the winners with massive returns while the software and SaaS names have been slammed over in the bottom quartile with 6 of 8 from that group joined by Tesla and IBM.
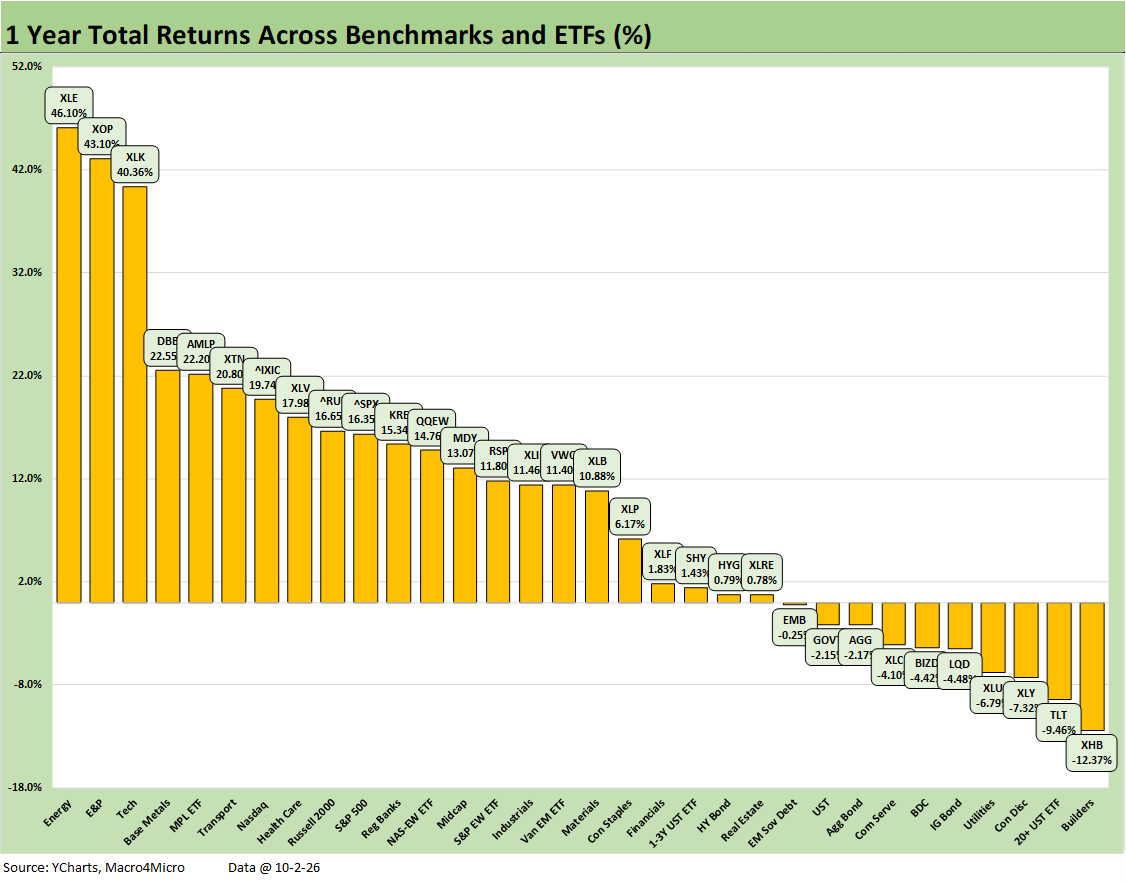
The LTM returns at 22-10 show the slow and steady increase in the number of negative LTM returns from single-digit asset lines in the red only a handful of months ago. The list was 31-1 at the end of June with only the BDC ETF (BIZD) in the red at that point at -13.5%. BIZD has now improved to only being down -4.4%. We see 5 bond ETFs in the red for the LTM period.