

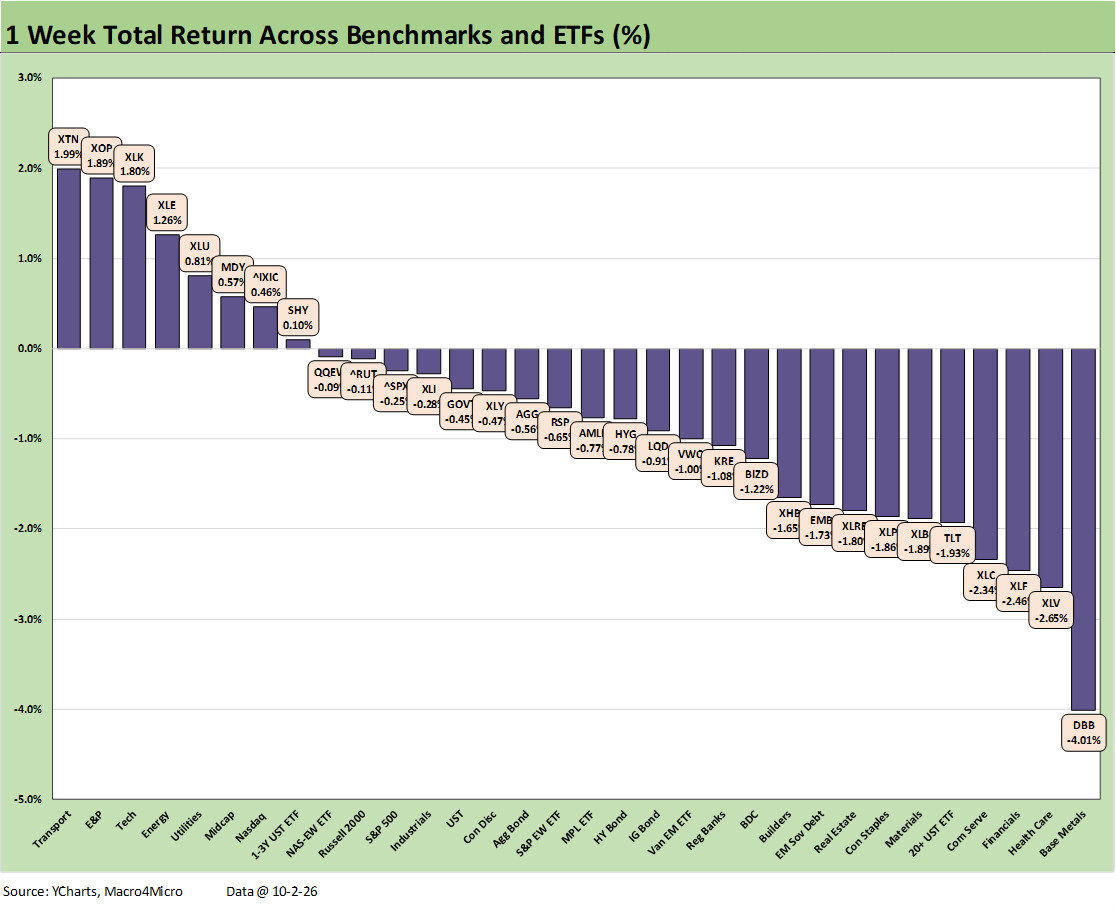
The past week saw another poor performance at an 8-24 positive-negative score with tech once again the better story line. NASDAQ made the top quartile, but the S&P 500 was negative and in the 2nd quartile just behind the Russell 2000. Midcaps (MDY) were slightly positive and ranked ahead of the other broad benchmarks. The large caps to small caps return range was narrow from MDY at +0.57% down to -0.25% on the S&P 500. The S&P 500 saw 8 of its 11 sectors in negative range but with the largest sector – Tech – posting a positive return.
The past week was heavily about major moves in the FOMC hike odds and what the payroll signals meant for inflation worries and the timing of hikes and notably the risks of a potential October hike. The payroll numbers ended up being extremely weak at +29K with -60K of negative revisions for Aug and July (see Payroll Adds/Declines Sept 2026: Negative Revisions, Weak Payroll 10-2-26).
The UST immediately rallied after the jobs release but still closed higher on the day by 4 bps on the 10Y UST at 5.27% after an intraday low of 5.16%. We thus see negative returns for the week on 6 of 7 bond ETFs with the lone exception of the short duration UST 1-3K ETF (SHY).
The PCE inflation news offered the “absence of bad news,” but the mix remains well above target PCE inflation. The main PCE price lines were generally moving sideways after adjusting for a lot of restatements (see PCE August 2026: Income & Outlays Show Firm Demand 10-1-26).
FedWatch odds of a move by the FOMC to 400-425 fed funds in October now stand at 22.1%, down from 64.2% 1 week ago. For the December 2025 FOMC meeting, the odds of FOMC action moving to 425-450 (2 hikes) are now down to 17.9% from 51.0% a week ago.
Notable winners in the rankings included Transports (XTN) at #1 with constructive GDP updates and PCE outlay numbers supportive along with some very limited policy progress on managing diesel imbalances.
Energy ETFs held in with E&P (XOP) and Energy (XLE) in the top 5 on some more noise about escalation risks (3rd carrier, more troops, etc.) even if with minimal impact on oil prices this week. WTI was essentially sideways from Friday to Friday. The Tech ETF (XLK) was #3. We look at the Tech Check mix in a separate note, and that group posted a more favorable symmetry in returns.
The biggest losers include the Base Metals ETF (DBB) at -4.0% as the strong commodity cycle gets second-guessed and the market awaits reporting season and guidance. For the UST curve, duration remains in the crosshairs with the long duration 20+ UST ETF (TLT) in the bottom quartile with weaker returns across dividend-heavy Real Estate (XLRE) and Consumer Staples (XLP).