


War, Elections, and AI Valuations: What could possibly go wrong?
After a rough September, the week posted up constructive numbers with the UST calming down for now in what has been a bad period for fixed income allocation.
The FOMC anxiety and inflation risks have tamed somewhat, but the election “behavior” worries and Iran escalation scenarios still lurk ahead with AI valuation second-guessing among the 3 ugliest worries.
With CPI and PPI ahead and oil at least in a more stable range for now, the expectation of a favorable earnings season will require something unusual to rattle the constructive market mindset. Unfortunately, we live in unusual times.
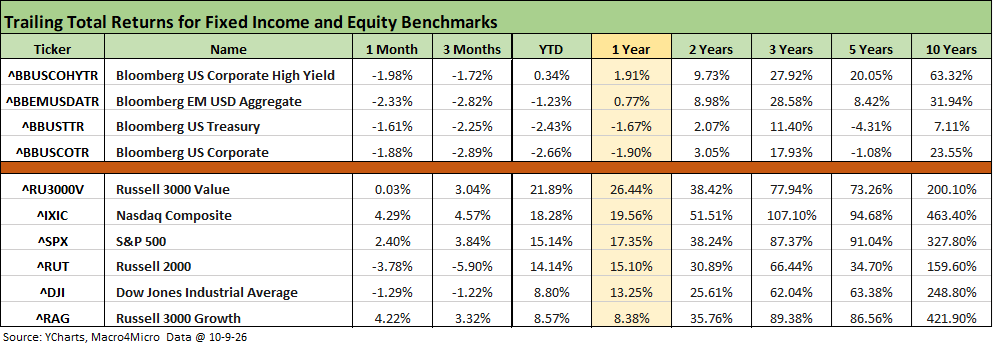
The week eased back on UST pressure by Friday, but the running 1-month and 3-month fixed income results remain in the all-negative range for the benchmarks above with 3 of 4 negative for YTD. Only HY edges into a slightly positive sub-1% range. For the trailing year, the best performer was HY at only +1.9% despite higher coupons and shorter duration. The timeline has been unpleasant for bond returns after the inflation pressure, FOMC actions and UST migration took bonds for a ride.
Equity returns remain decidedly mixed over various timelines from large caps to small caps and from growth to value. The S&P 500 and NASDAQ present very solid YTD numbers, but the narrower Dow and the Russell 2000 have been more erratic. The Russell 2000 is an important index for breadth and that has posted negative 1-month and 3-month numbers while still generating impressive YTD numbers and over the trailing year.
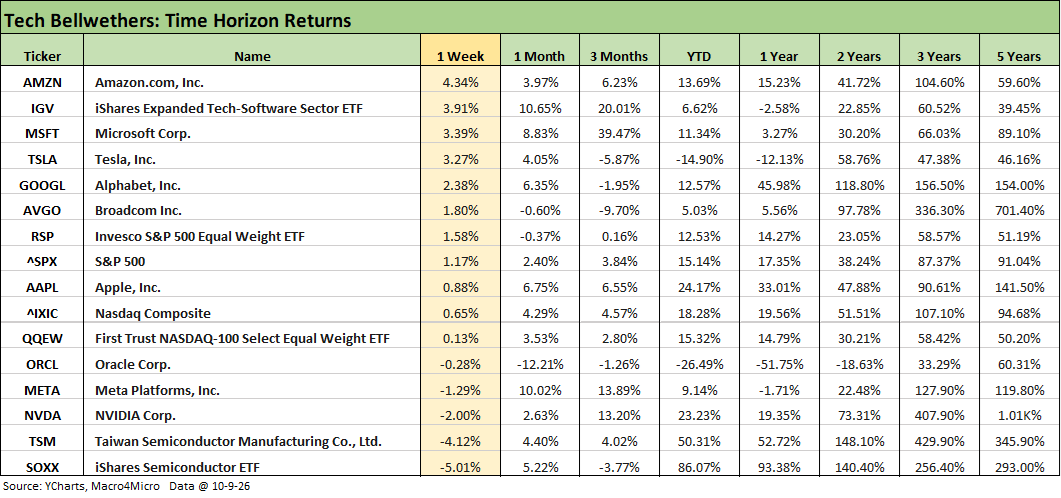
The tech bellwethers were mixed this past week with semis under pressure and software and SaaS in rally mode as we cover in other charts. We see the Semiconductor ETF (SOXX) on the bottom at -5.0% with the Software ETF (IGV) at #2 with +3.9% behind Amazon at #1 with +4.34%. For the YTD period, SOXX is +86.1% vs. IGV at +6.6% for a return differential of 79.5%.
For the Mag 7 this week, we see 5 positive and 2 negative (NVDA, META). Only Tesla (TSLA) is negative YTD with Apple (AAPL) in the YTD lead at +24.17% just ahead of NVDA at +23.2%. We see 6 of Mag 7 names positive YTD with only META among those 6 in single digits YTD at +9.1%.
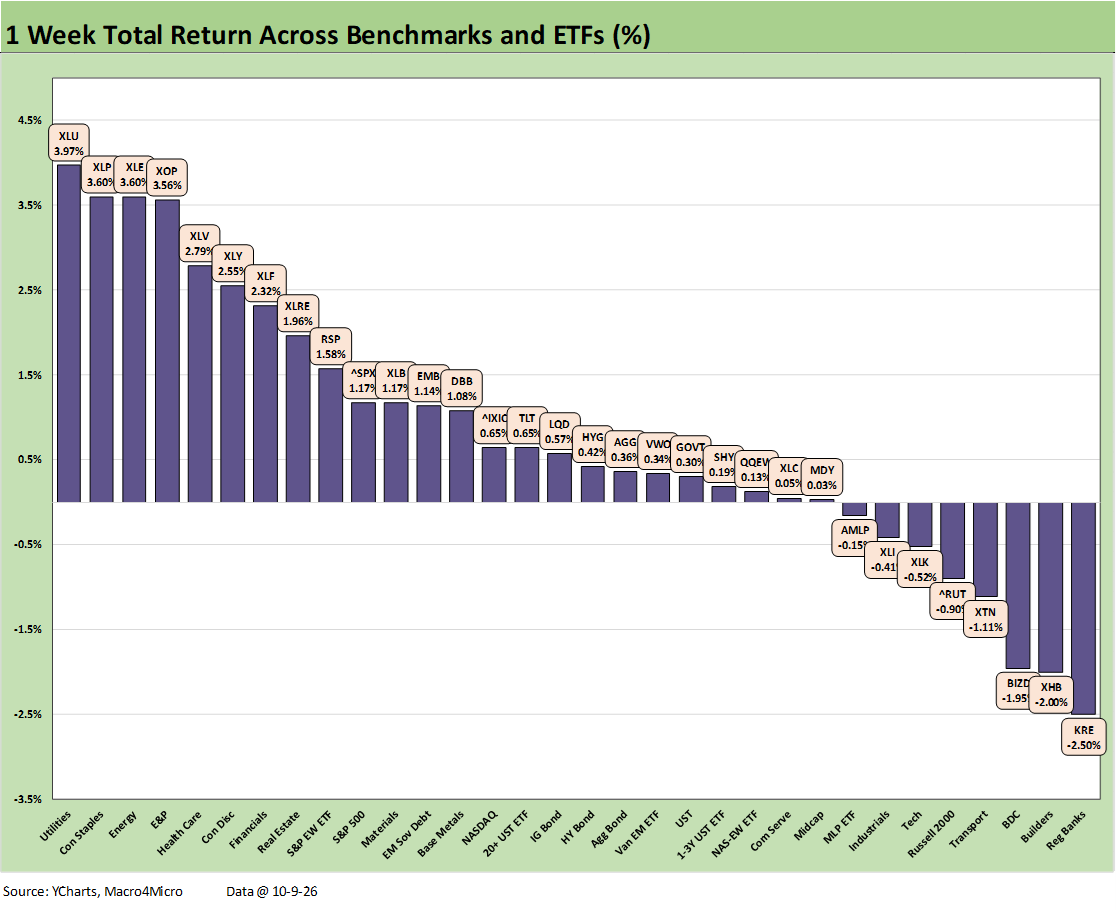
We already looked at the weekly returns for the broader group of 32 benchmarks and ETFs (see Weekly Returns: Benchmarks and ETFs 10-11-26). The score of 24-8 tells the story with a broad range of positive returns.
We saw some UST curve relief that supported bond ETFs this week (see Weekly UST Deltas: Moving Parts 10-10-26). The constructive finish on the week for longer UST also offered some support for higher quality dividends stocks. Mortgage rates remained under a dark cloud, however, with Freddie Mac mortgages moving higher to 7.4%.
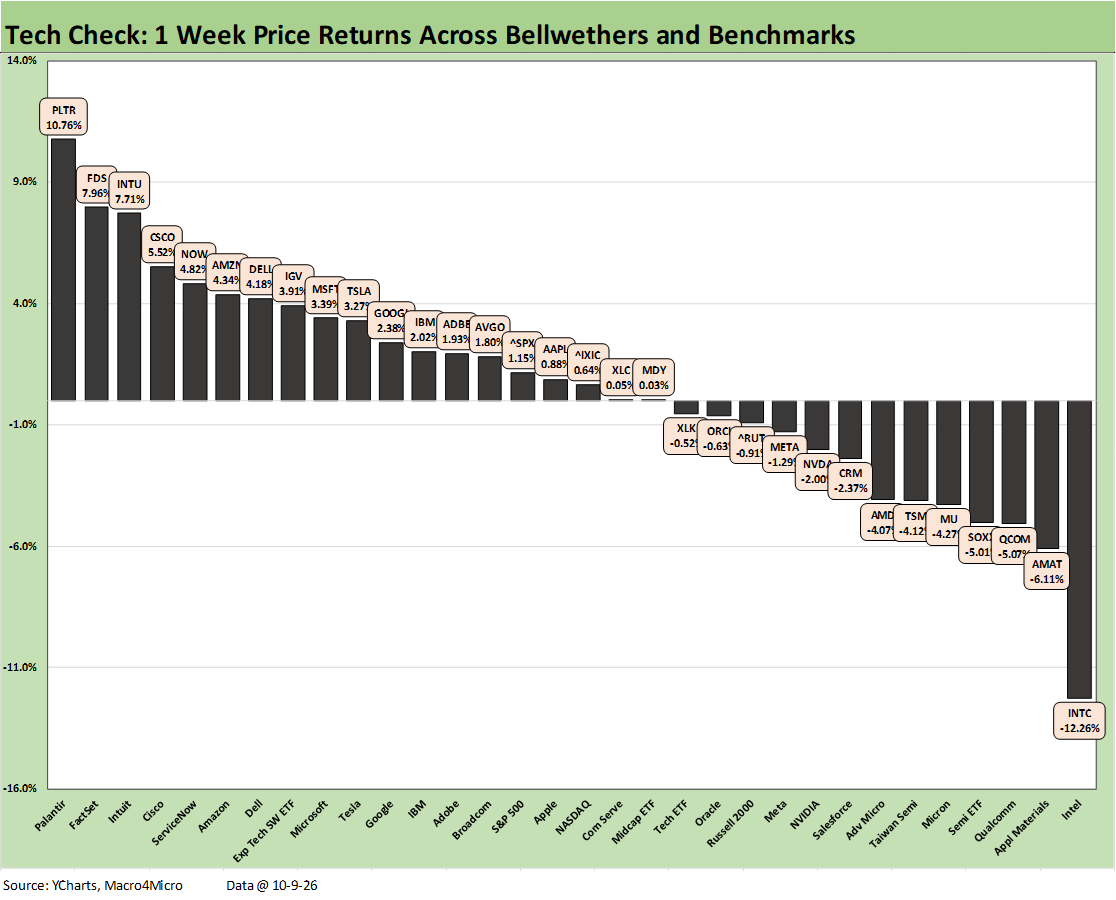
We already posted a commentary on the weekly Tech Check returns (see Weekly Asset Returns: Tech Check 10-11-26). The score of 19-13 did not match up to the 24-8 for the broader multi-industry collection as semiconductors posted up poor numbers with a heavy weighting in negative range in the bottom quartile.
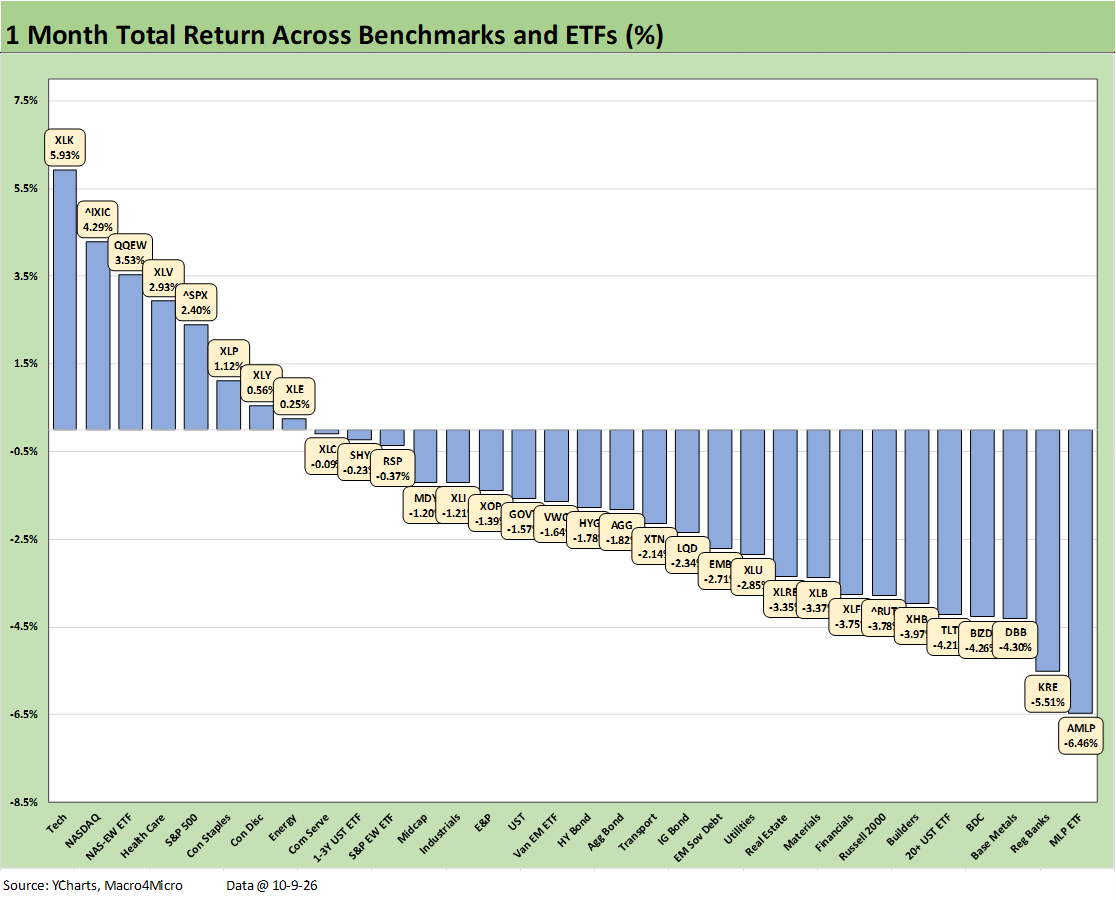
The trailing month offers a grim score of 8-24 once again with tech leading the winners. For the winners, the Tech ETF (XLK) is at #1 ahead of NASDAQ at #2, and the Equal Weight NASDAQ 100 ETF (QQEW) at #3.
We see an eclectic mix on the bottom with Midstream Energy (AMLP) in last place with a brutal month but still good YTD numbers in the top quartile and high 2nd quartile over 3 months. Regional banks and metals/commodities join private credit (BIZD) and duration (TLT) in the dog house.
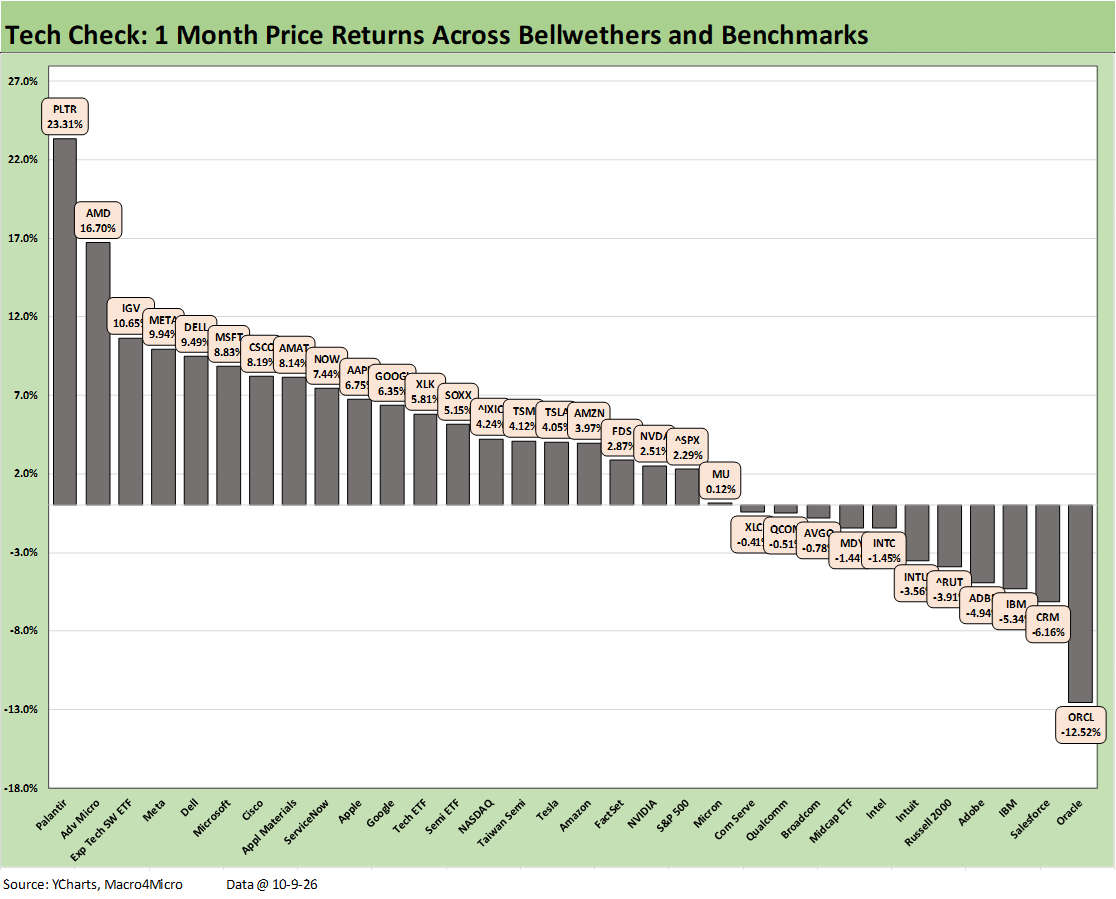
The tech check list has shown its share of wild swings across the semiconductor and software/SaaS peer group during recent weeks and months. The trailing 1-month shows the Mag 7 names at least all in positive range with META and MSFT in the top quartile. The rankings show a more blended mix in the top quartile across software, semis and AI plays. The Software ETF (IGV) is in the top quartile at +10.7% with the Semi ETF (SOXX) down in the 2nd quartile at +5.2%. For the month, IGV was joined by PLTR and MSFT in the top tier.
There was still material pain for software bellwethers for the 1-month period with Oracle (ORCL) in last place by a meaningful gap from Salesforce (CRM) in 2nd to last. Adobe (ADBE) was in the bottom tier also joined by Intuit (INTU), who remains by far the worst YTD performer in the Tech Check mix at -54.3%.
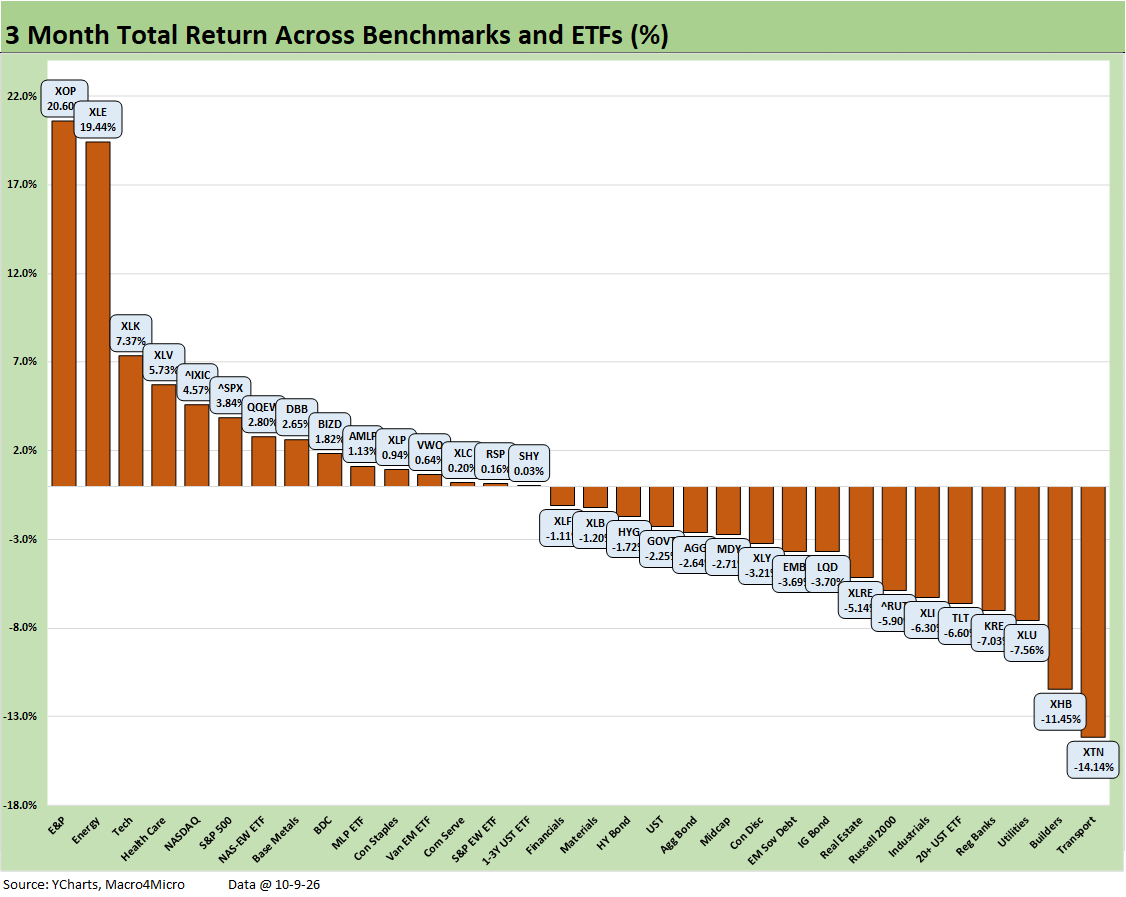
The 3-month return score for the broader group of 32 was 15-17 with the balance of macro numbers and corporate earnings offering support in 2Q26 earnings season and GDP prospects. After a very rough start to the year, the consumer sector appears back in the game while the fixed investment boom rolls on (see GDP 2Q26: Bullish Final Revisions 9-30-26, Macro Dance-Off: PCE Growth vs. Fixed Investment 10-1-26). We get our first advance estimate on 3Q26 GDP numbers this coming week.
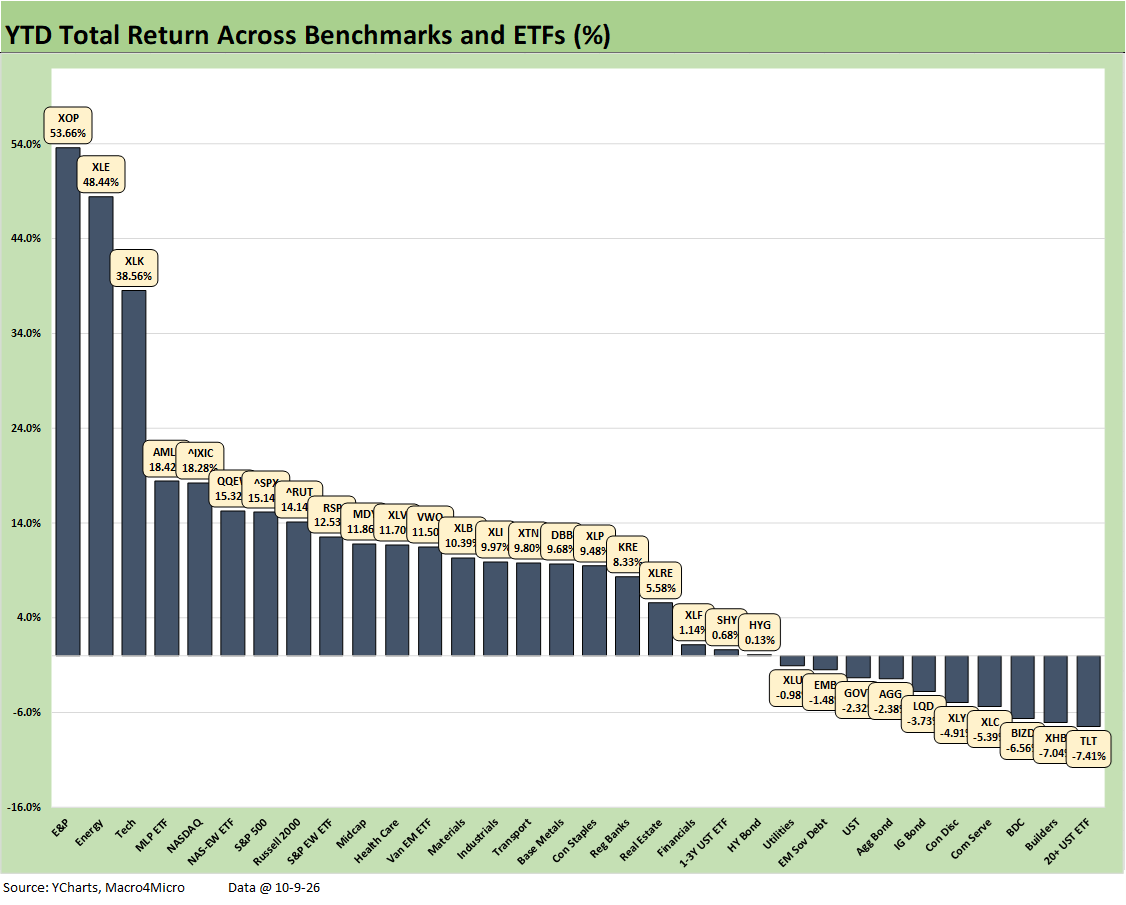
The broader mix of 32 asset lines posts a YTD return score of 22-10 with 5 of the 10 negative lines being bond ETFs. We see the long duration 20+Y UST ETF (TLT) in last place with the Homebuilder (XHB) in 2nd to last while the BDC ETF (BIZD) is 3 off the bottom.
The Communications Services ETF (XLC) and the struggling Consumer Discretionary ETF (XLY) have been highlighted regularly. For XLC, names such as TMUS, T, AppLovin, and Take-Two Interactive have been a drag. The Consumer ETF (XLY) has a wide range of weak performers such as Tesla, McDonald’s, Lowe’s, Home Depot, Booking Holdings, and TJX among others.
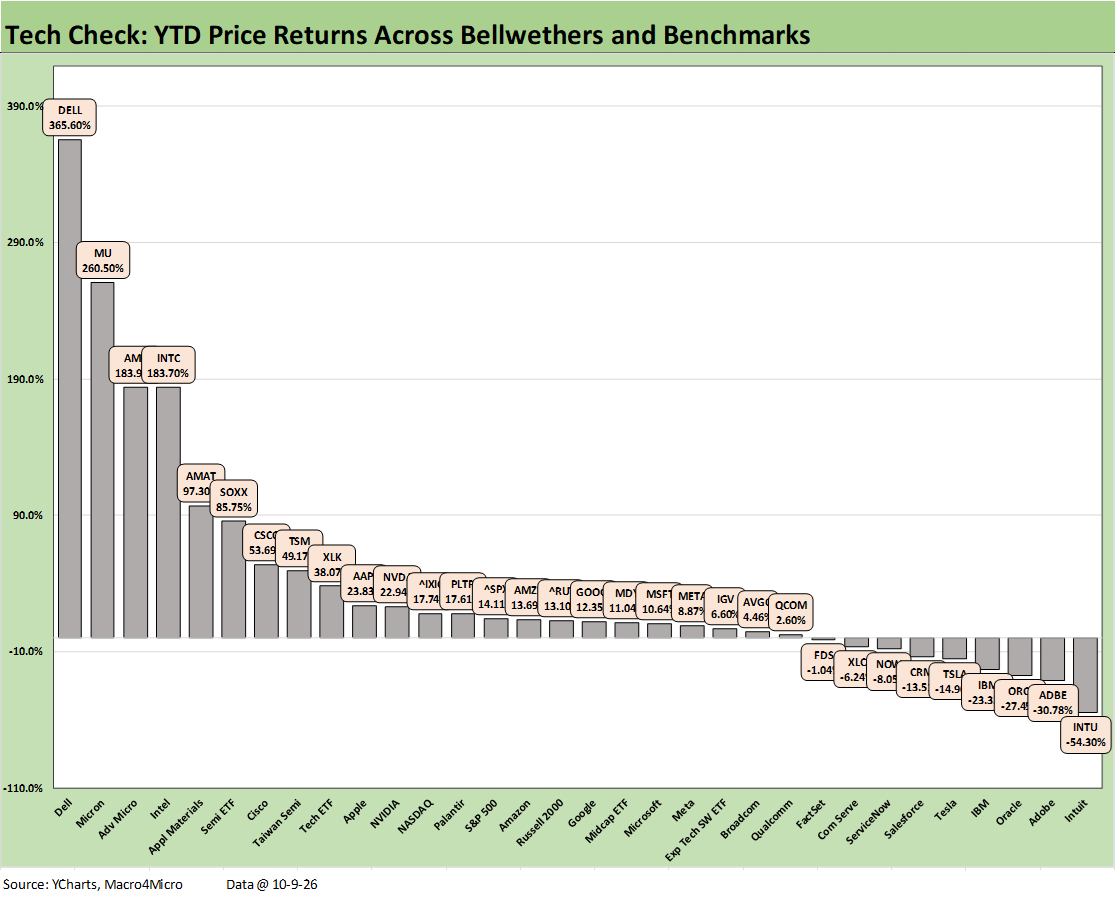
The Tech Check YTD returns are still dominated by the extraordinary, outsized returns from the semiconductor and AI infrastructure beneficiaries with a range of major software names struggling in the score of 23-9.
We see 4 asset lines in triple digits from Intel (INTC) at +183.7% at #4 up to Dell at +365.6%. Applied Materials (AMAT) just missed the 100% line at +97.3%. We see the SaaS-pocalypse victims on the right along with some bellwether software companies such as Oracle in what has been a recurring YTD theme for software. Recent value seeking has driven some rebounds.
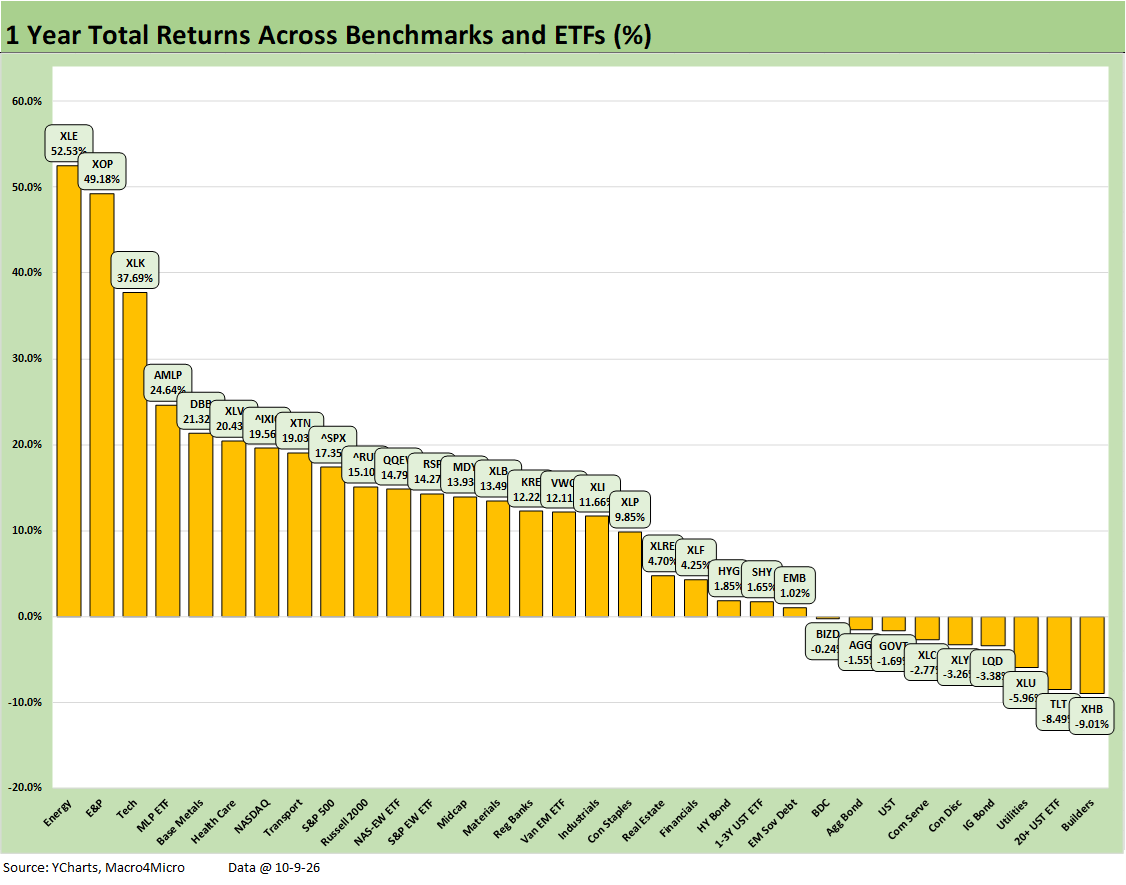
The LTM returns at 23-9 show the slow and steady increase in the number of negative LTM returns from low single-digit asset lines in recent months. The list was 31-1 at the end of June with only the BDC ETF (BIZD) in the red at that point at -13.5%. BIZD has now improved to only being down -0.24%. We see 5 bond ETFs in the red for the LTM period with the short duration 1-3Y UST ETF (SHY) and EM Sovereign Bond ETF (EMB) slightly positive.