
JOLTS Oct 2023: Lights Blinking? Dimmer or On-Off?
October JOLTS data sends more signals of a potential fade in payrolls, but it is early in the game.


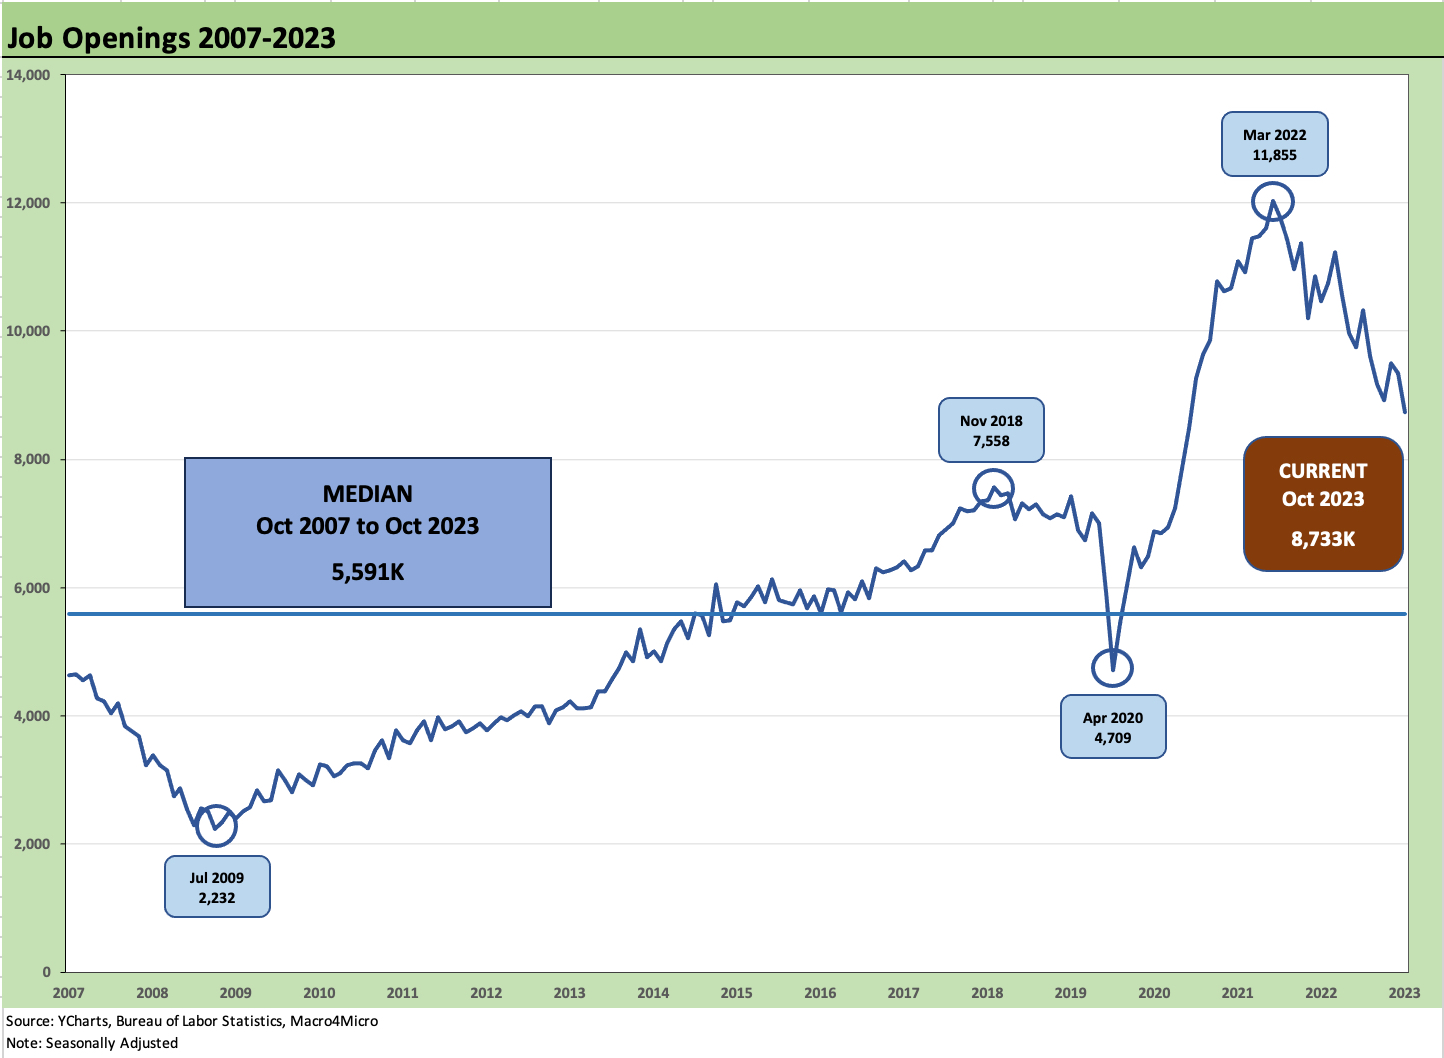
The JOLTS numbers were well below expectations at 8.7 million, down from a revised 9.35 million in September, but the needle did not move much on Hires or Separations.
While all eyes will be on Friday’s November payroll numbers (reminder: JOLTS is on a 1-month lag), the lowest job openings numbers since March 2021 gives the market an excuse to not get instantly nervous around a UST curve that has been trending down.
The employment number this Friday and CPI next week (Dec 12) hold the key to a lack of material setbacks for the bulls to wind down the fiscal year (it ain’t over yet).
We look across the usual JOLTS data points in this commentary as all of us in the market wait for more signals. Over the years, we got in the habit of using the phrase “it’s a dimmer, not an On/Off switch” when it comes to cyclical trends. This is one of those times and the dimmer is likely to start showing up more in the payroll picture into 2024 even if it can be erratic during cyclical transition periods.
Every now and then, the events go well beyond the dimmer, and the power plant gets blown up (e.g., credit crisis, COVID). Those type of events need rescues (fiscal or monetary). That would take something extreme on the event front. We cannot say we have not experienced such events before. China, Russia, Iran, etc., would fit into extreme scenarios, but that is nothing new.
Employment reduction has plenty of room to maneuver….
The theme of “absence of incremental overheating” seems secure with recent economic releases, but that does not mean that a sudden leap to a material contraction in payrolls is upon us. The month of October 2023 ended with 6.5 million unemployed, up from 6.1 million unemployed YoY from the end of Oct 2022. We get fresh numbers on that front this Friday.
The Job Opening numbers still exceed the total unemployed, but that relationship is now trending negatively. The “mix and match” limitation of where the openings are vs. the unemployment ranks is not quite as easy as reducing the relationship to simple long division. It is something worth watching at around 1.34 openings for each unemployed.
This time of year often includes a lot of headlines around job cuts in financial services with openings declining in financial services (down by 168K) while real estate and leasing is down by 49K. The usual churn in Health Care and Social Assistance is evident in the Oct 2023 numbers as well.
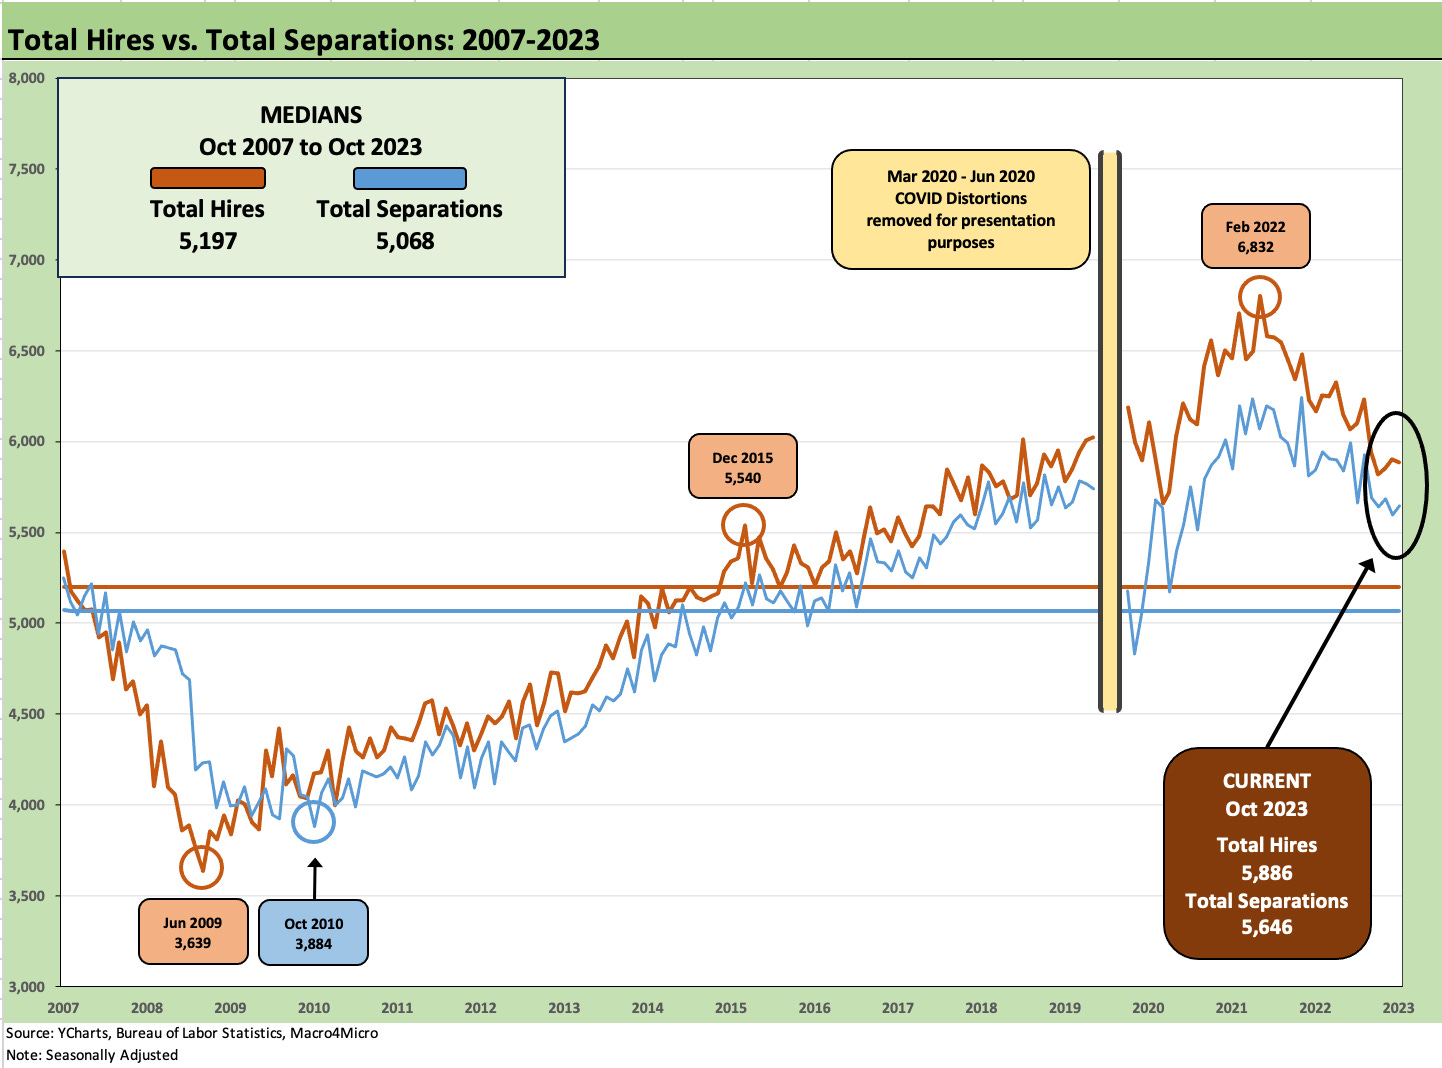
The above chart details the time series for hires and separations, and the level of activity on both fronts remains high in what is still a vibrant, services-heavy economy with a lot of two-way traffic in the lowest wage tiers. We detail the COVID gap in the chart below.
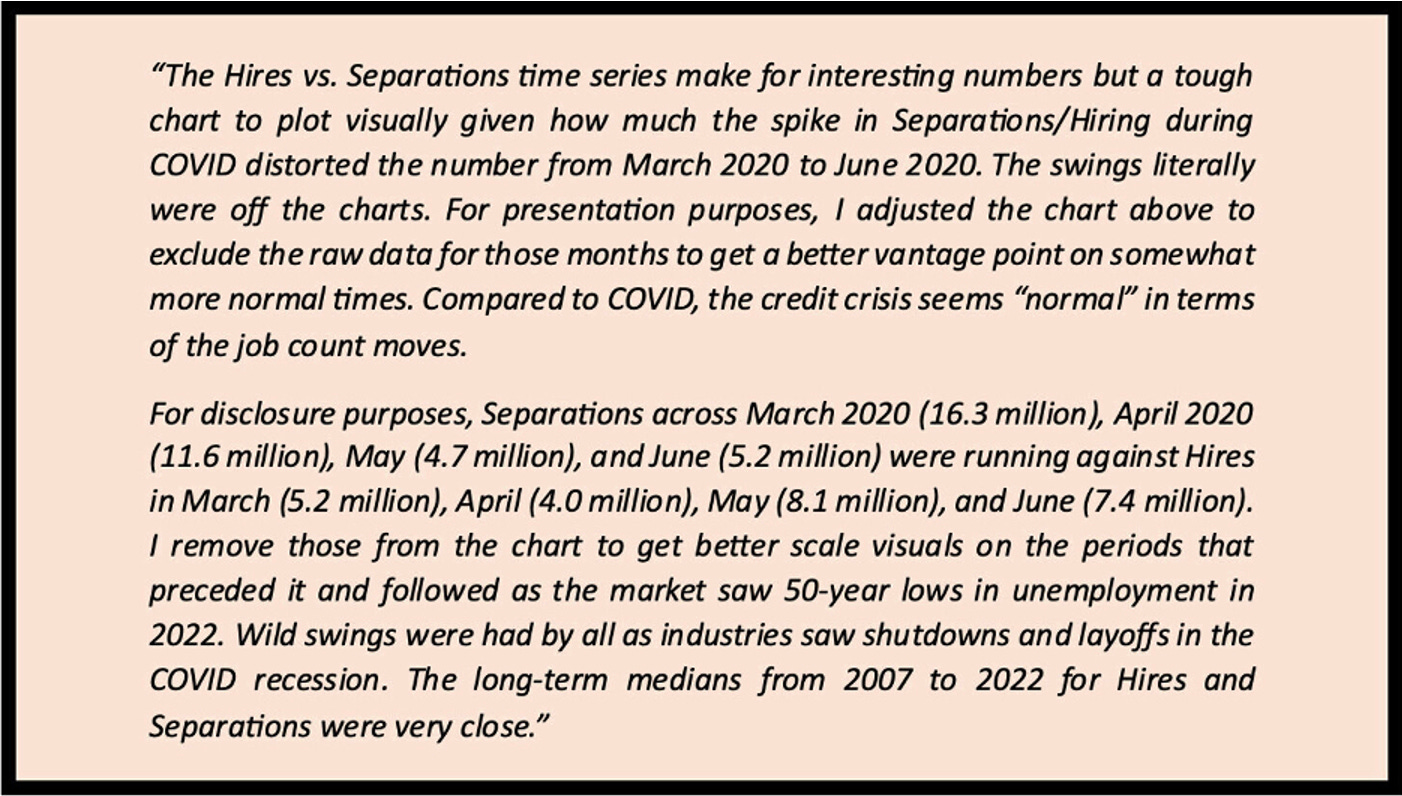
The above chart fills in the gap on the COVID numbers. This is an old cut and paste from earlier research that is worth dropping in as revisionists in the election year will look back at a period and pretend it was all a big overreaction. Those of us in urban areas near hospitals remember the daily cheering and pots clanking to salute those facing death daily. We saw temp facilities constructed to deal with the overflow and carnage.
Meanwhile, questionable characters like Ron DeSantis (who won’t say if he got vaccinated) and Rand Paul (usually more worried about his hair than a death toll) reinvent the facts of the time to make some money (and sell some Fauci hate books) and fundraise off the death toll.
A stunning loss of human life factored into the period just as the economic damage seen in these numbers is evident in the box above. It should not be lost in the noise that payrolls went to all-time highs and unemployment to the lowest rate since the 1960s in the aftermath. Vaccines helped pick up the pace in rehiring immediately.
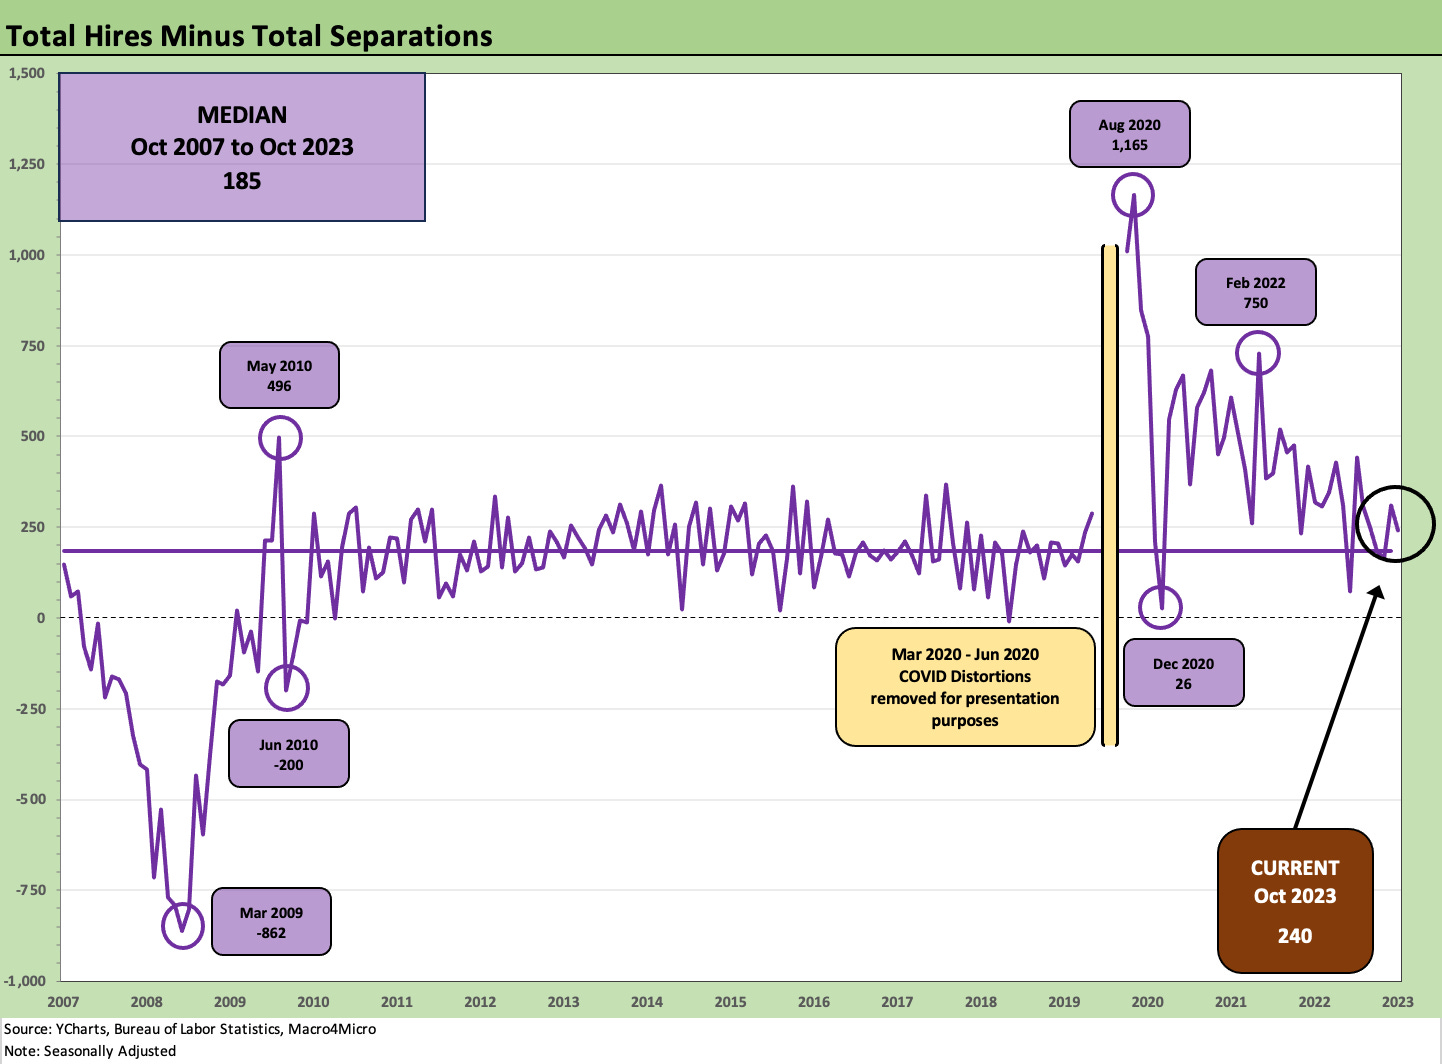
The above chart updates “hires minus separations” which continues to run modestly above the long-term median. That differential is closing in on signals of weakness in payroll counts ahead.
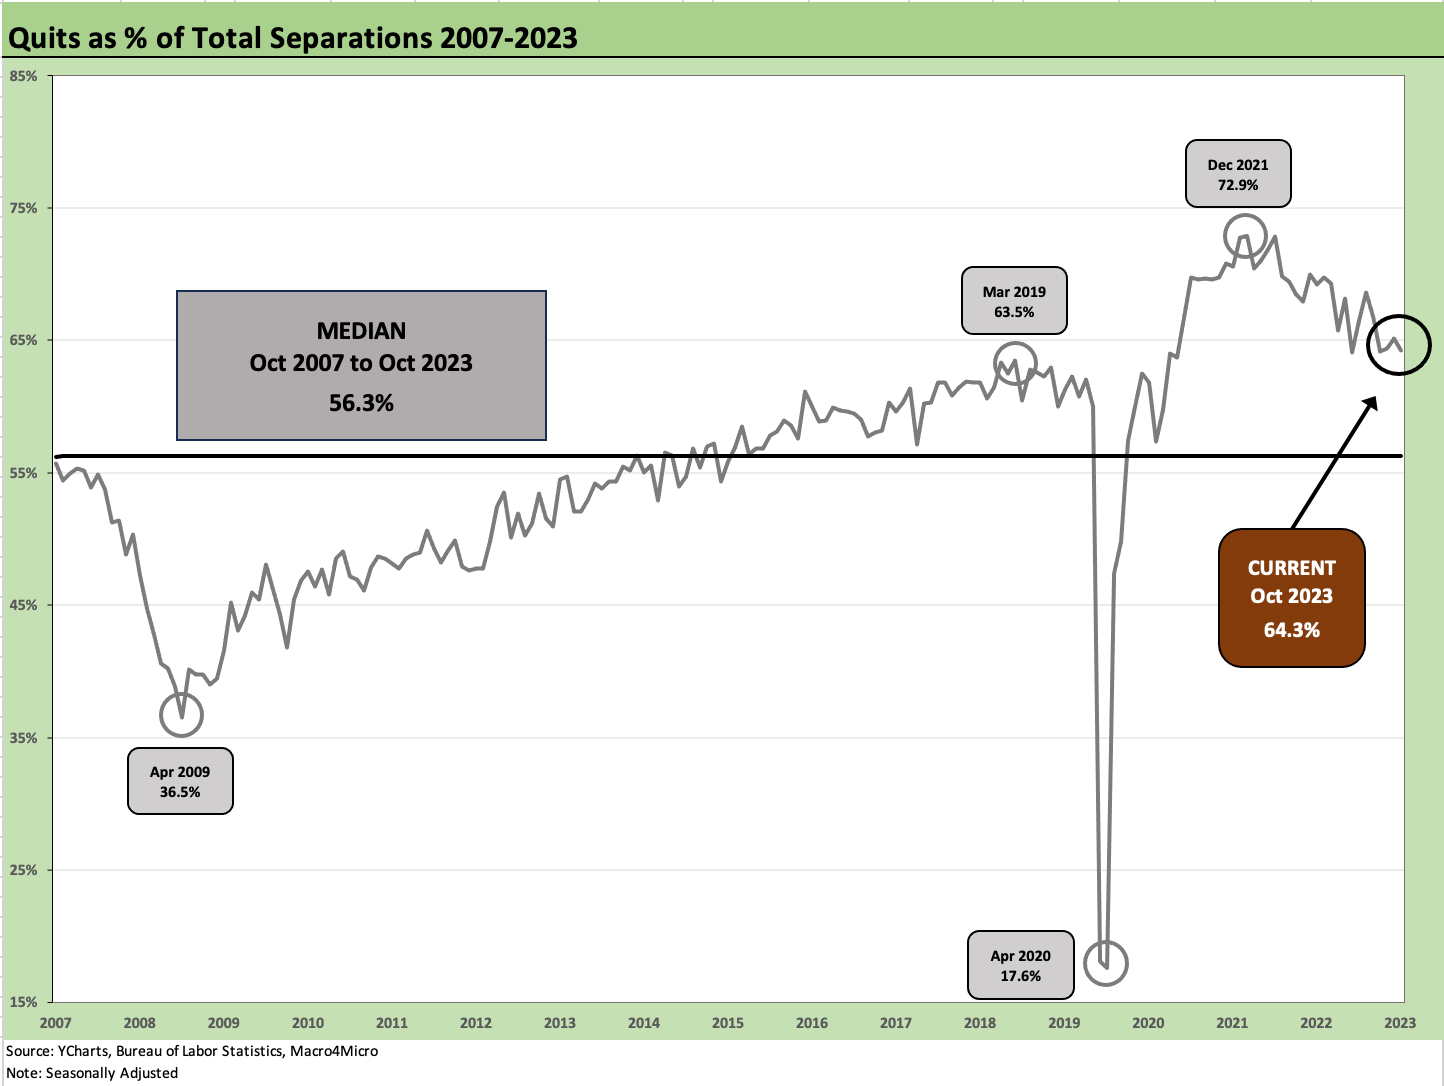
The above chart shows the Quits mix in the overall Separations numbers. The current 64.3% is above the 56.3% long term median. The “Quits Rate” (Quits % employment) using non-seasonally adjusted, revised data saw October at 2.3%. That was a tick down from 2.4% in Sept 2023 and down from 2.7% in Oct 2022. Using seasonally adjusted data, the quits rate was also 2.3%, flat to Sept 2023 at 2.3% but down from 2.6% in Oct 2022. The theory is that this shows lower confidence relative to late 2022. That’s the theory.