JOLTS March 2023: Inclement…but Surf’s Up
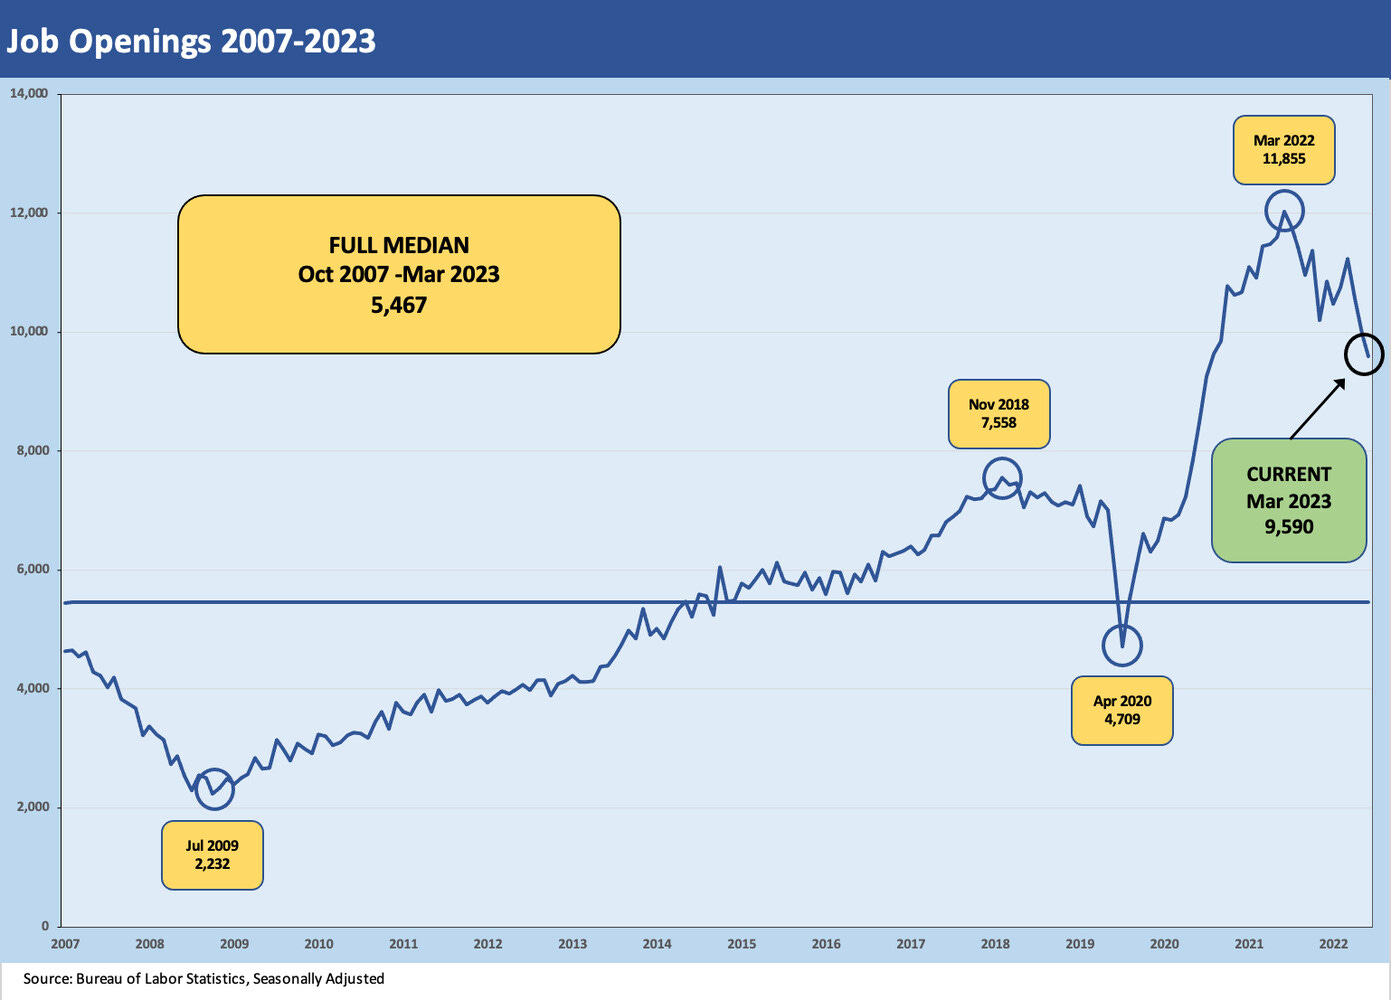
The JOLTS numbers for March should reassure the Fed as the running tally of job openings is down 1.6M from Dec 2022.
With the Fed in the flow for a two-day session ahead of tomorrow’s fed funds verdict and color commentary, the JOLTS numbers at least continue the downward trend in job openings that the FOMC will like to see.
The decline in jobs openings is below Jan 2023 and well below Feb 2023, but the tally brings the 3-month decline to around a 1.6 million reduction to 9.6 million openings vs. an unemployed number of 5.8 million for March.
The above chart plots the timeline for jobs openings through March 2023 (reminder: these are 1-month lags with the April payroll number out this Friday). The decline of 384K keeps the trend going we saw for Feb 2023 (see JOLTs: Partly Cloudy, No Lightning – Yet 4-5-23) and Jan 2023 (see A Fresh JOLT but No Shock 3-8-23).
The decline in job openings includes a few weeks of the aftershocks of the SVP collapse and the regional bank depositor panic. We look forward to Friday’s employment numbers for a more of a read on what is unfolding in the April payroll numbers after more weeks of regional bank stress.
The JOLTS tables make it easy to skim the categories of jobs by industry. Among the more notable declines was Retail Trade and a sharp decline in Transportation, Warehousing and Utilities. Private sector job openings were down by 418K seasonally adjusted while Government openings were up slightly (biased to state and local, excluding education).
The above chart frames Hires vs. Separations in gross numbers, and the trend line shows a slight downward bias with Hires essentially flat and Separations higher. There are two ways to lower a job openings total. One is to fill the job and the other is to pull the job openings on concerns around adding to payroll if revenue is not going to cooperate.
We would expect to see more openings pulled in the coming months at the very least. How Separations play out across Quits vs. Layoffs is going to get interesting. The layoffs tend to show up in the headlines for large employers, but there is a lot going on in the trenches.
The above chart plots the simple relationship of “Hires minus Separations.” The long-term median shows that Hires exceed Separations by 185K. For March, that number was +215K (seasonally adjusted). As a reminder, the employment numbers for March were at +236K adds (see March Jobs: Head Scratcher 4-7-23).
The above chart plots the Quits rate as a % of total Separations. This is a measure of of how optimistic a worker might be (or how thoroughly disgusted with his current employer) or simply reflect the question of “Do you feel lucky?” The long term median is 55.6% and March 2023 weighed in at 64.9% seasonally adjusted, down from the high of 72.9% in Dec 2021.
Layoffs and discharges were up by +248K sequentially (seasonally adjusted) after declining by 162K in Feb 2023 and rising by 244K in Jan 2023. Needless to say, large scale layoffs can be lumpy. We would expect those lumps to move higher in the coming months. The financial services sector has been quiet on this front through March. The regional banks might want to hire more risk managers.


