


The sequential weakness in the headline MoM industrial production and capacity utilization was wagged by utilities, but the manufacturing results remind the market of the strong YoY trends.
The YoY increase in total industrial production was +2.1% despite a -0.4% MoM headline driven by weak Utilities MoM of -4.3% and Mining at -0.8% with Manufacturing IP (75.9% weighting of the Industrial Production index) at +0.3% MoM.
Notable YoY winners along the “Market Groups” and “Industry Groups” (Table 1) include “Business Equipment” at +7.8%, ”Durables Manufacturing” at +4.8%, “Primary metals” of +4.8%, “Machinery” at +6.9%, and “Computer and electronic products” at +7.7%. Motor vehicles and parts” at +9.5% was an eye opener.
With production and capacity moving targets across this cycle, the 76.0% capacity utilization for Total Manufacturing was a slight tick higher sequentially with “Durables manufacturing” at 76.2% vs. 75.8% in Sept.
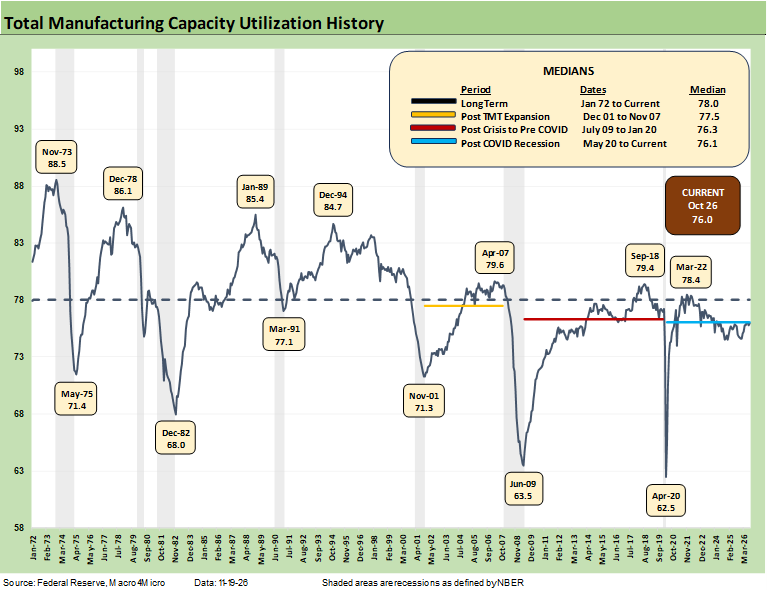
The long-term time series for manufacturing capacity utilization is plotted above. The highs and lows tell a story of some dramatic moves lower and higher across the economic cycles and a few crises. (You know you are old when you were at working age for all the lows in the time series.)
The current 76.0 is below the long-term median from 1972 of 78.0. Current levels are in the neighborhood of the other timeline medians shown.
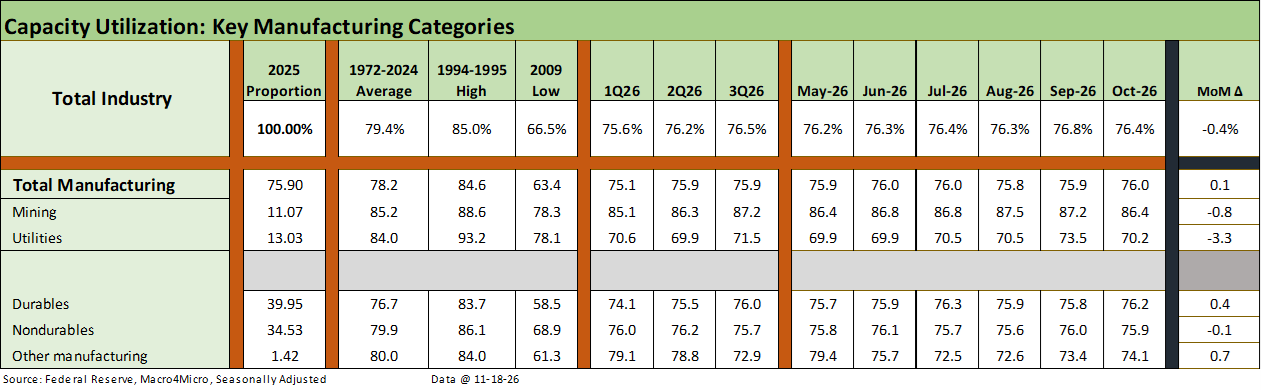
The above table breaks out capacity utilization for the major groupings including Manufacturing with Durables and Nondurables as the major focal points for us. We include a column on the right with the MoM deltas. We see the headline level at an unfavorable -0.4% but with the delta for manufacturing positive. Utilities posted a decline that wagged the headline number.
We cite some of the industrial production % moves in the bullets, but the capacity utilization trends (Table 7 of the release) can in theory be an indicator of relative pricing power as capacity rises or contracts. We discussed more of these topics in the September commentary (see Industrial Production Sept 2026: Capacity Utilization 10-17-26).
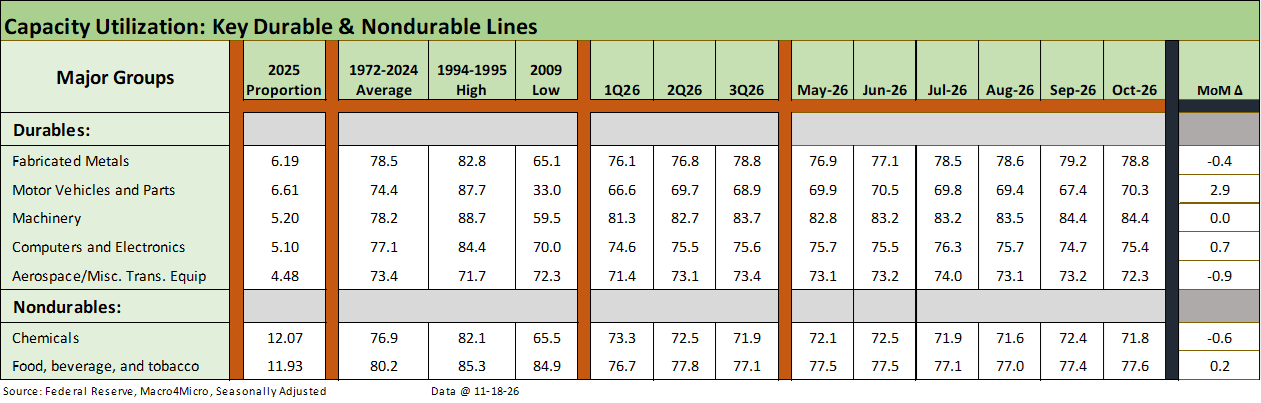
The above table updates the largest of the manufacturing industry groups. The “Motor vehicle and parts” industry line stands out with “Computers and electronics.” As we cite in all of these “cap ute” updates, the influence of capacity utilization is about more than just “higher or lower.” The trend has to be viewed in the context of product mix, pricing trends, relative cost structure, unit costs, and how that all flows into breakeven volume levels.
A major setback for many companies and industries has been the recurring pressure on costs tied to tariffs and energy. The PPI numbers have been grim and that is a leading indicator to lagging margin pressure on rising costs or to potential upward pressure on pricing (see Producer Price Index Oct 2026: Inflation Shadows Still Lurk 11-13-26).
There are secondary and tertiary effects that such cost pressures can bring around adjustments to headcount or capex (as in reductions) among other reactions that can arise to offset higher costs. That is a risk to monitor. We have seen plenty of layoffs in services industries.
For now, the payroll trends have been weak in historical context but still rising (see Employment Oct 2026: Payroll Seems Strong but is only Median 11-9-26). The questions around which sectors will see their efficiency benefit from AI is a question that will play out over time, and we certainly see it as a very hot topic in manufacturing and in the trade rags.
People often forget that automation has been a major factor in displacing manufacturing jobs. More than a few argue that the “machine vs. man” reality trumps the pressures from supplier chain offshoring. Let’s say both matter. The AI piece of the puzzle could take it to the next level and will have a more stunning impact on the services job totals than manufacturing. Financial services could be at the top of the list.