
Footnotes & Flashbacks: State of Yields 10-15-23
We update yield curve trends in a week where the UST rallied on very bad geopolitical news.


After a week of absorbing horrible stories of innocents murdered, the steady unraveling of Middle East peace, and the arrival of a war that could easily escalate, the UST market reacted with a bull flattening with duration rewarded but spreads steady and even slightly tighter.
Meanwhile, dysfunction in Washington has only gotten worse with introspection and self-assessment joining integrity at the bottom of the Potomac right next to respect for the Constitution as shutdown risks loom at a time when budget action is needed badly for defense and security.
Risk assets nonetheless had a good week as equities drove home that valuation is still prioritizing the UST curve over any expectation of a near term shift in fundamentals or a high risk of geopolitics shifting quickly in the wrong direction. We shall see about the latter.
The range of outcomes still are not signaling recession as the base case, but the Middle East and Washington just upped the ante of what could happen if too many bad decisions are made and everyone acts only in their self-interest with their chosen political cliques in DC.
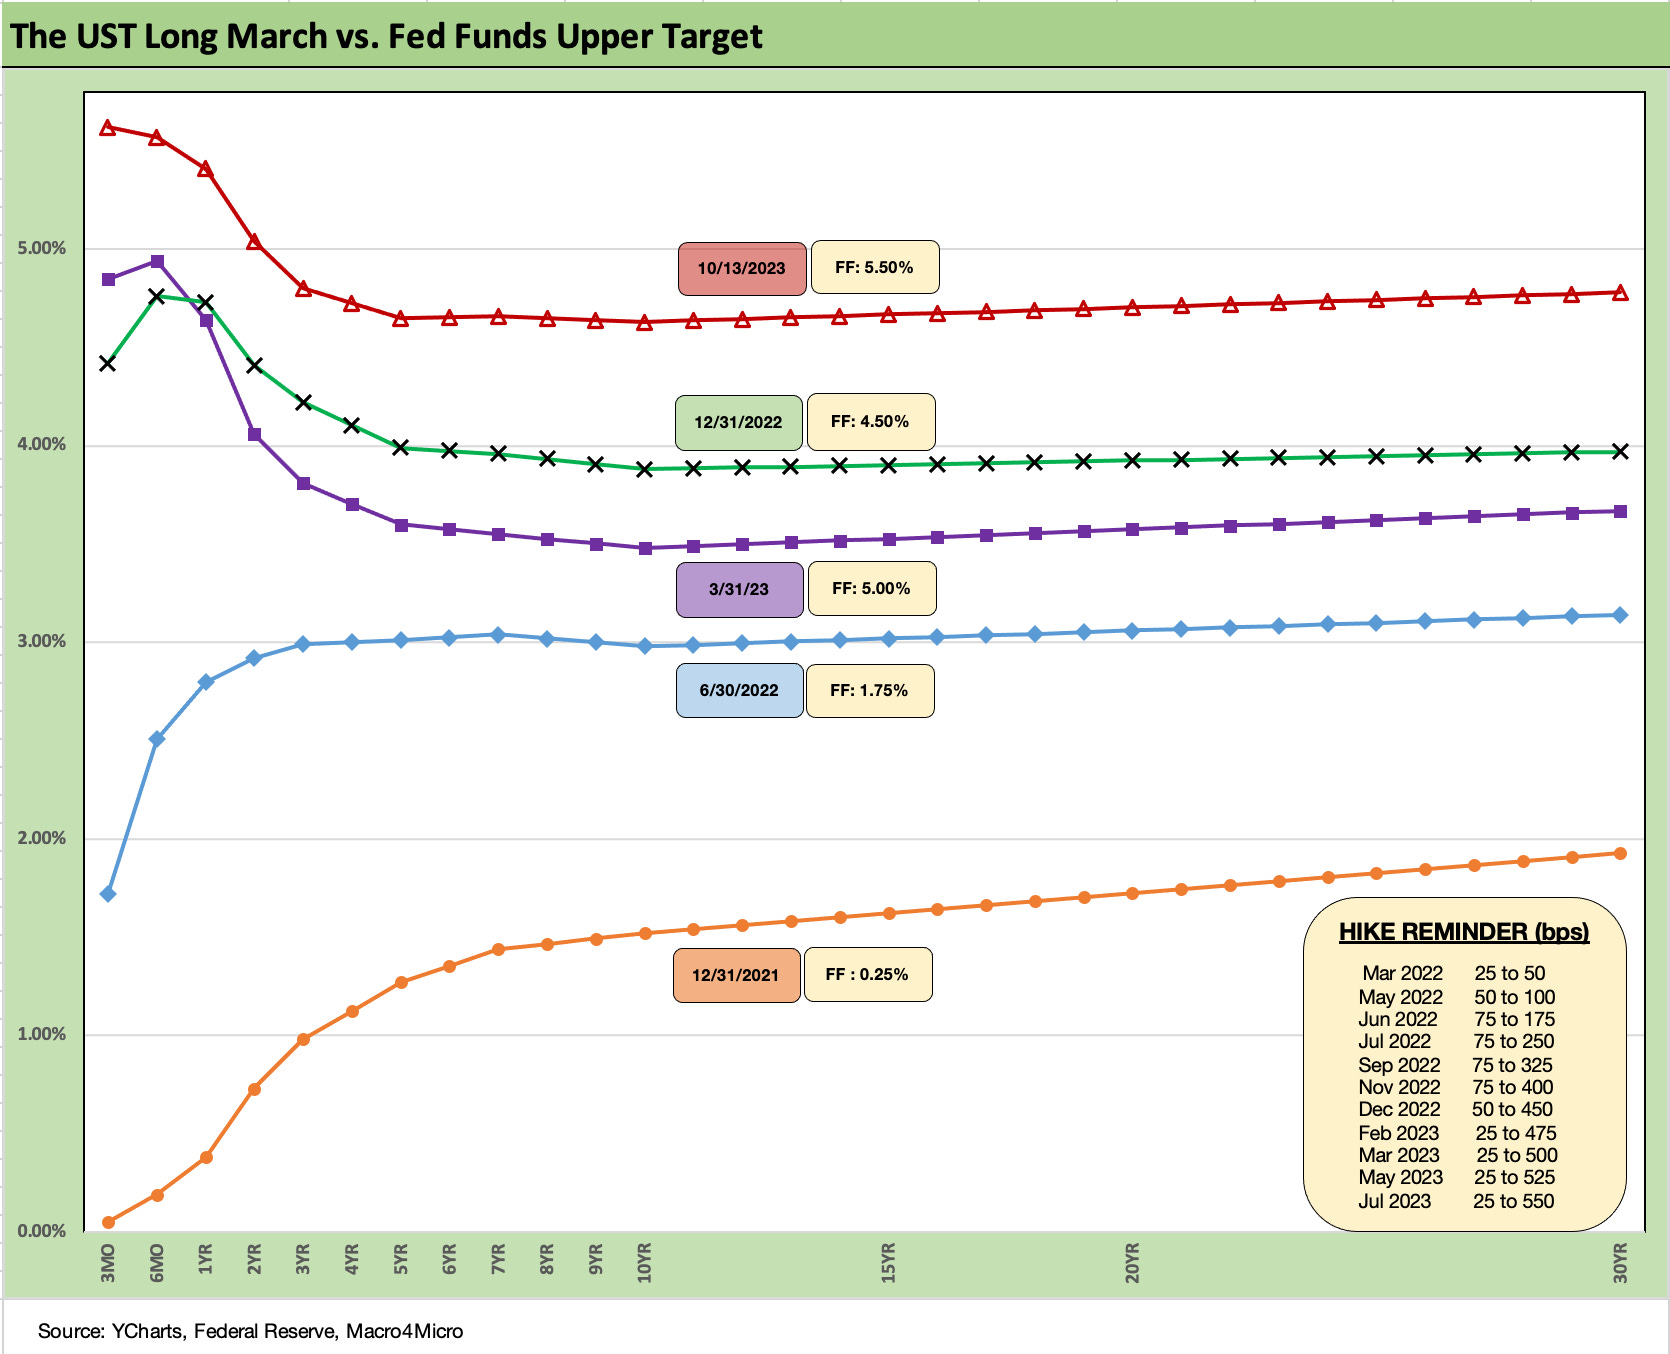
The bias seen in recent weeks was for more upward UST migration and more steepening. That shift has been something we have looked at for weeks in the weekly Footnote recaps. The above chart updates the visual of the running migration of the UST curve from the end of 2021 across the rapid and aggressive Fed tightening cycle.
The shift in the UST curve from the end of 2022 to the end of 1Q23 and then the ensuing shift higher to where we are now underscores that the debate around what the inversion meant was not so clear and a recession not so imminent as many thought last fall (see Unemployment, Recessions, and the Potter Stewart Rule 10-7-22).
Geopolitics Meets Congressional Dysfunction…
The game theory of geopolitics can get confused when the shooting starts, and the George Patton rule can get invoked quickly (“No bastard ever won a war by dying for his country. He won it by making the other poor dumb bastard die for his country.”) The term “game theory” seems trivial when wars begin. The war in the Middle East is moving that way in a hurry, but the “war at home” in Washington and on the campaign trail grows increasingly petty and small minded.
This past week, the direction of asset returns went in the opposite direction of what the typical direction might be for stocks but the logical move of the UST was that it rallied. We looked at those returns in a Footnotes publication earlier today (see Footnotes & Flashbacks: Asset Returns 10-15-23). The UST curve move this week was about natural risk defensiveness broadly as the long end saw yields decline in a bull flattener. That in turn gave equities more life while helping duration.
The credit market even saw some minimal spread tightening. Like those watching and dreading the news, the answers will come to the market soon enough, but the risks are going higher and not lower. This is not yet as bad as the summer of 1990 rolling into a fall panic with Iraq and Kuwait causing problems and oil spiking. That was a much more fragile economy and banking system and a very different US energy sector.
As someone who lived across the street from the twin towers, some events cannot go back to the negotiating rooms. Pearl Harbor and 9/11 could only end with shooting and bombing. In substance, the Hamas attack is the Yom Kippur and Six-Day War for Israel rolled into one, but with more than a little Holocaust in the underlying intent. That ends one way (war) even if some say there are more than one potential outcomes. Not for the next few months there isn’t.
We are in a very different world right now, but there are more than a few scenarios where the current situation could turn into a much bigger problem. You don’t immediately price worst case scenarios by any stretch, but the pathways from a few aircraft carrier strike forces and the mentality of the potential escalators/opponents (Iran and Hezbollah as its proxy) could set the stage for what might not be in market valuations right now in risky assets or in UST.
On the home front, one can easily argue that the more budget decisions and priorities break down, the more exposed the US and its allies will be. Everyone blames the other guy, and the sides stick to their stories in Washington. The same is true in the Middle East. The same in Russia-Ukraine. At the very least, the US needs to function. That takes a budget.
A budget is at least achievable, but things have gotten so bad that at first Congress wouldn’t and now they can’t (no Speaker) bring a bill to the floor that two sides (or is it 4?) can agree upon. The GOP needs a speaker who respects elections and is very conservative but not an unhinged white nationalist with a closet love of authoritarians. If that’s too much to ask for we’re in trouble.
An ability to for the Speaker to work across the aisle and with the President would help even if just a little (Reagan, GHW Bush, Clinton, and GW Bush managed, and even Obama had 6 years without party control). John Boehner was the one who called Jim Jordan a legislative terrorist, and Boehner is no liberal.
Whose interest gets prioritized?
Many have seen the movie “A Beautiful Mind” about John Nash and his challenge to Adam Smith’s view that the best outcome is derived from everyone looking out for their own individual interests first. Maybe Congress should watch the attached clip again and rethink how well that is going for the country if they just put themselves first.
The decisions that Congress will make and goals they pursue over the next few weeks will now have much more significance in light of what is happening (and could happen) on the geopolitical front. That will impact the markets – materially.
For now, the markets will be locking in on the macro indicators and the guidance from earnings season, but the deadline on a budget is very much an uncertainty at a time when “Men and Materiel” are moving towards what could easily become a theater of war. The next sequence of events could be mild for the US economy or devastating even just looking at logical outcomes. The hope is the scale of this war remains contained.
As everyone assigns blame for the chaos, the real villains are those that make the country look like it can’t function. Some are already saying that same dysfunction in Israel triggered the green light now for Hamas.
Those that would cause or support a shutdown in the US will be the cause of a rapid deterioration in readiness, and if events go asymmetric, the blame will be on those that said, “shut it down” (some have already said that) or brilliant things like “do a default.” Everyone knows who they are.
These are very soft variables that are hard to price into scenarios for the market. The ability to strike last-minute deals cannot be assumed. Not with this crowd. There have been too many firsts (first failed coup, first refusal to accept elections by a President and by so many opponent party leaders, first multiple indicted former President, first removal of a speaker and no replacement, etc.).
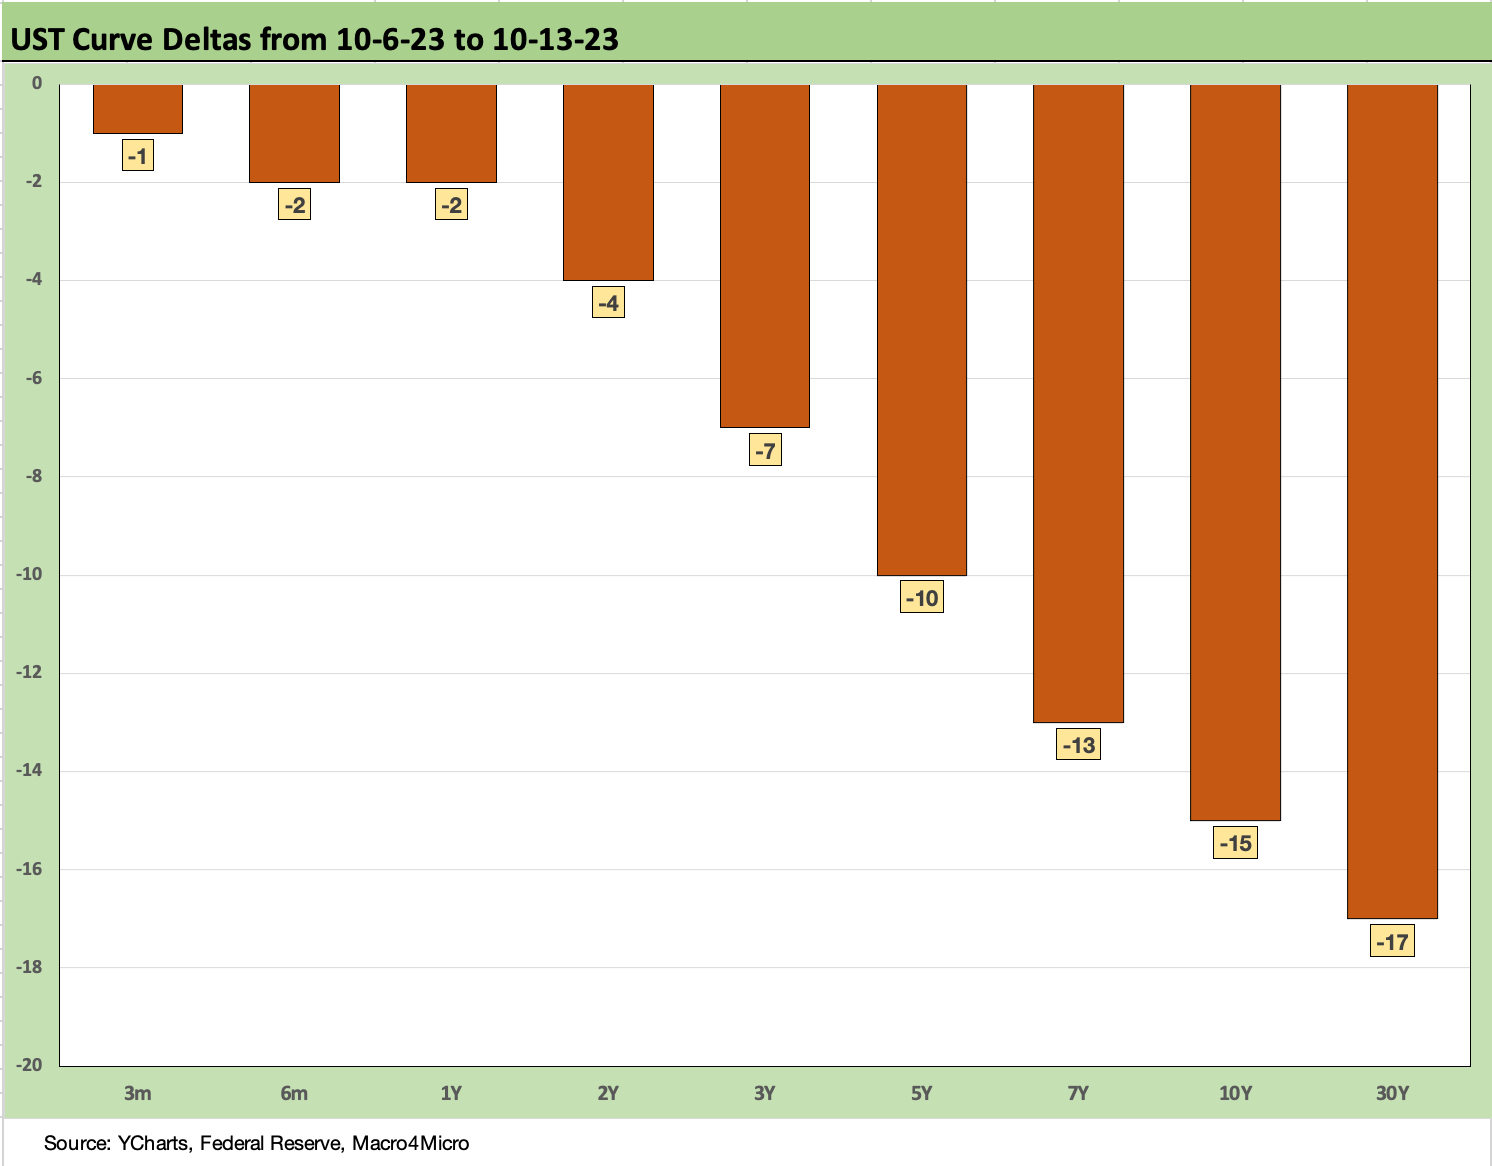
The above chart captures the bull flattening of the past week with the UST deltas by maturity. There is not a lot of mystery in the pattern. We added the TLT ETF (20+ Year UST Maturity ETF) to our asset return update this week. That ETF has posted a -45% total return over the past two years.
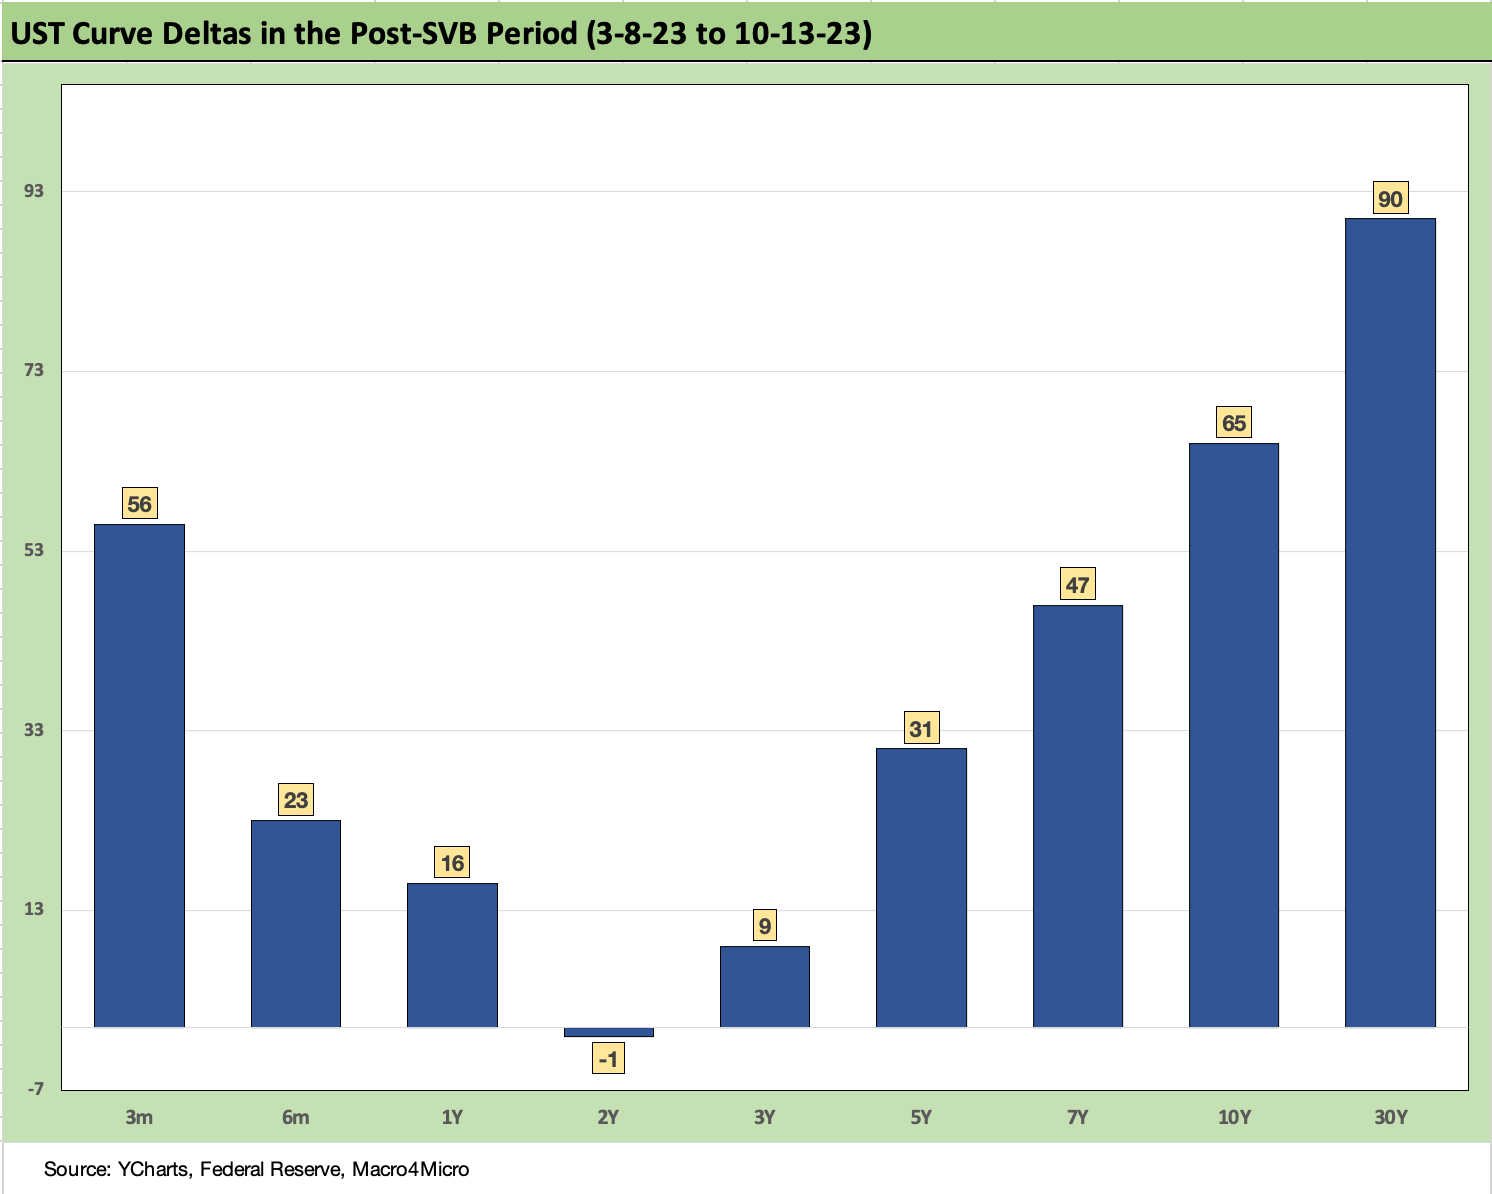
The above chart updates the UST deltas from the last “clean trading day” before the Silicon Valley Bank collapse and regional bank mini-panic. We still show a material steepening since March with duration taking the body blows.
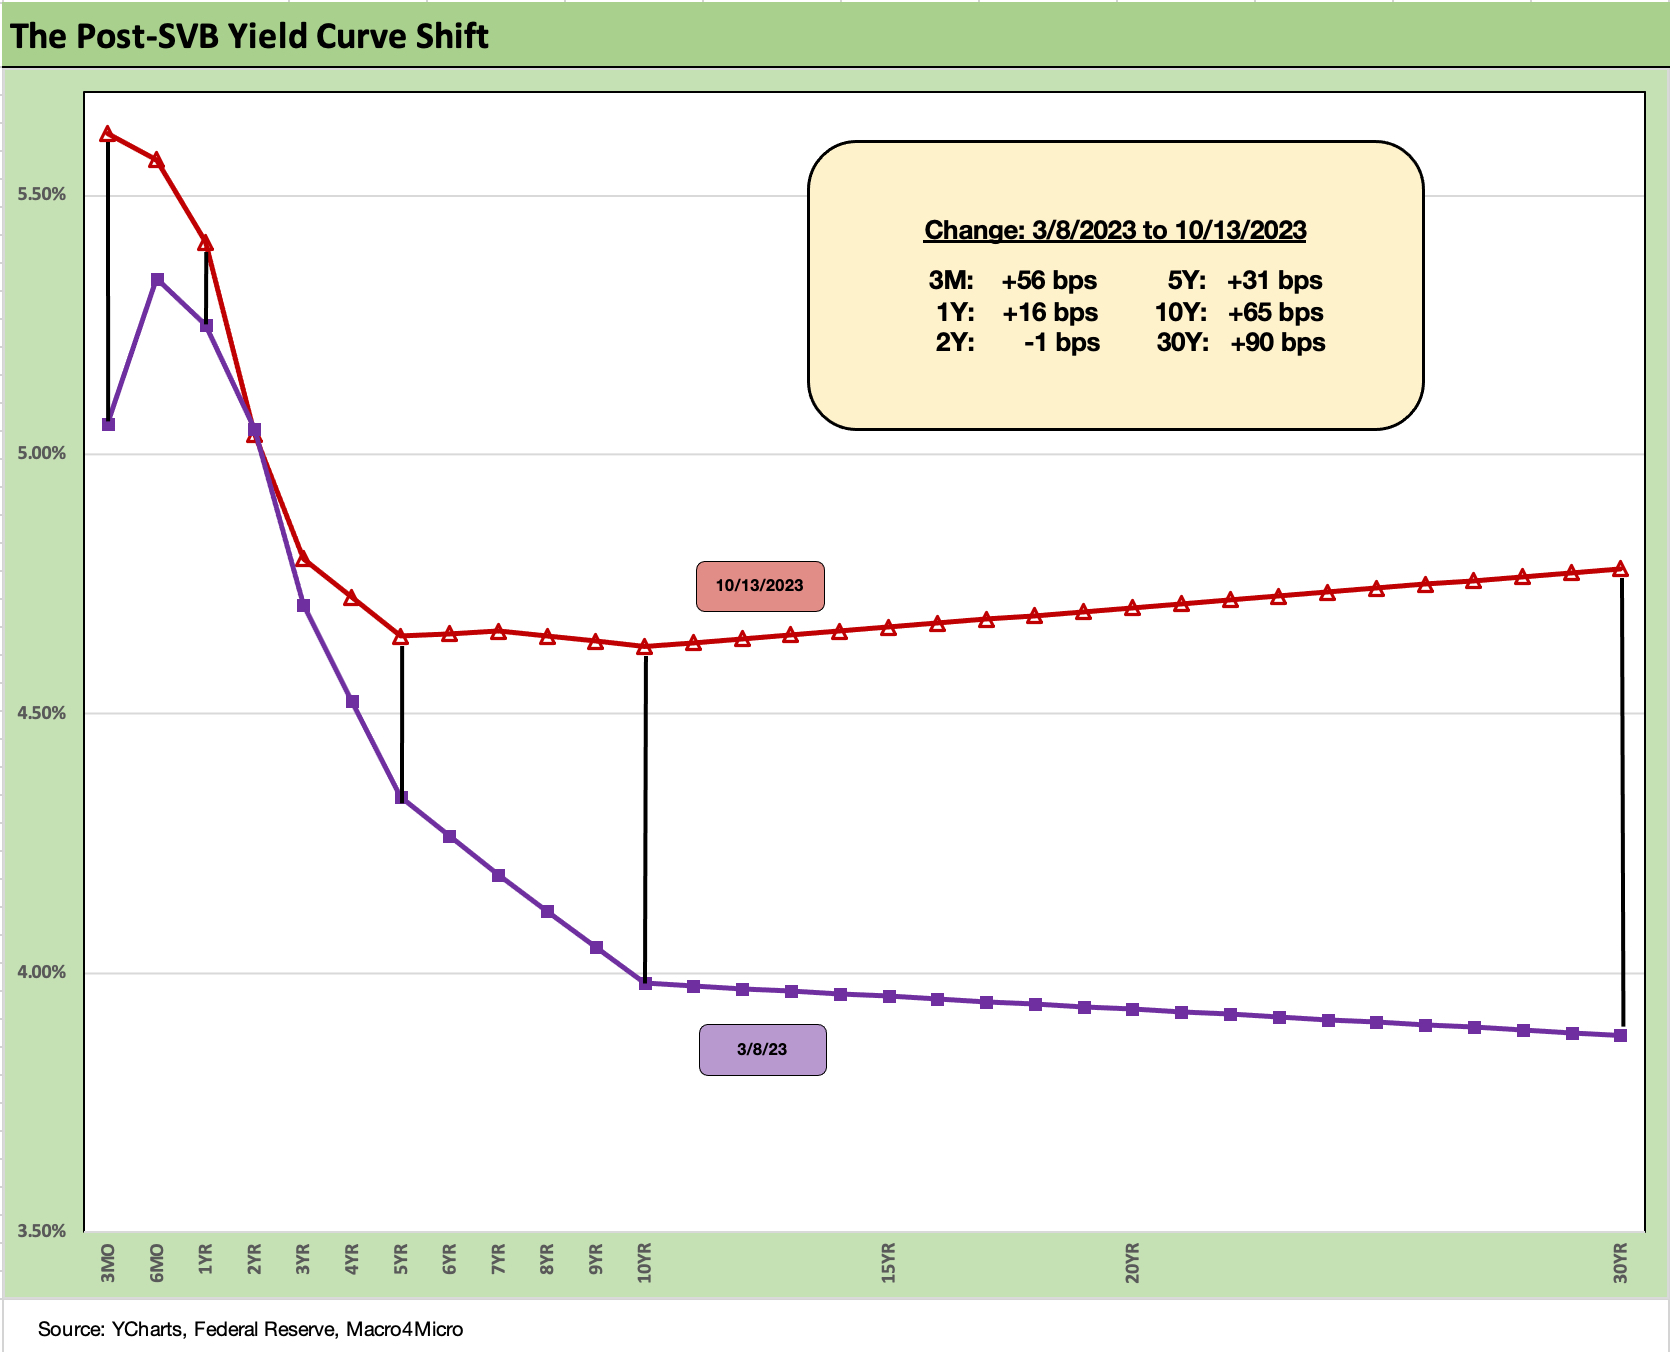
The above chart puts the post-SVB migration and steepening into a yield curve visual with the deltas broken out in the box. The bad news for bond returns in that timeline is clear enough.
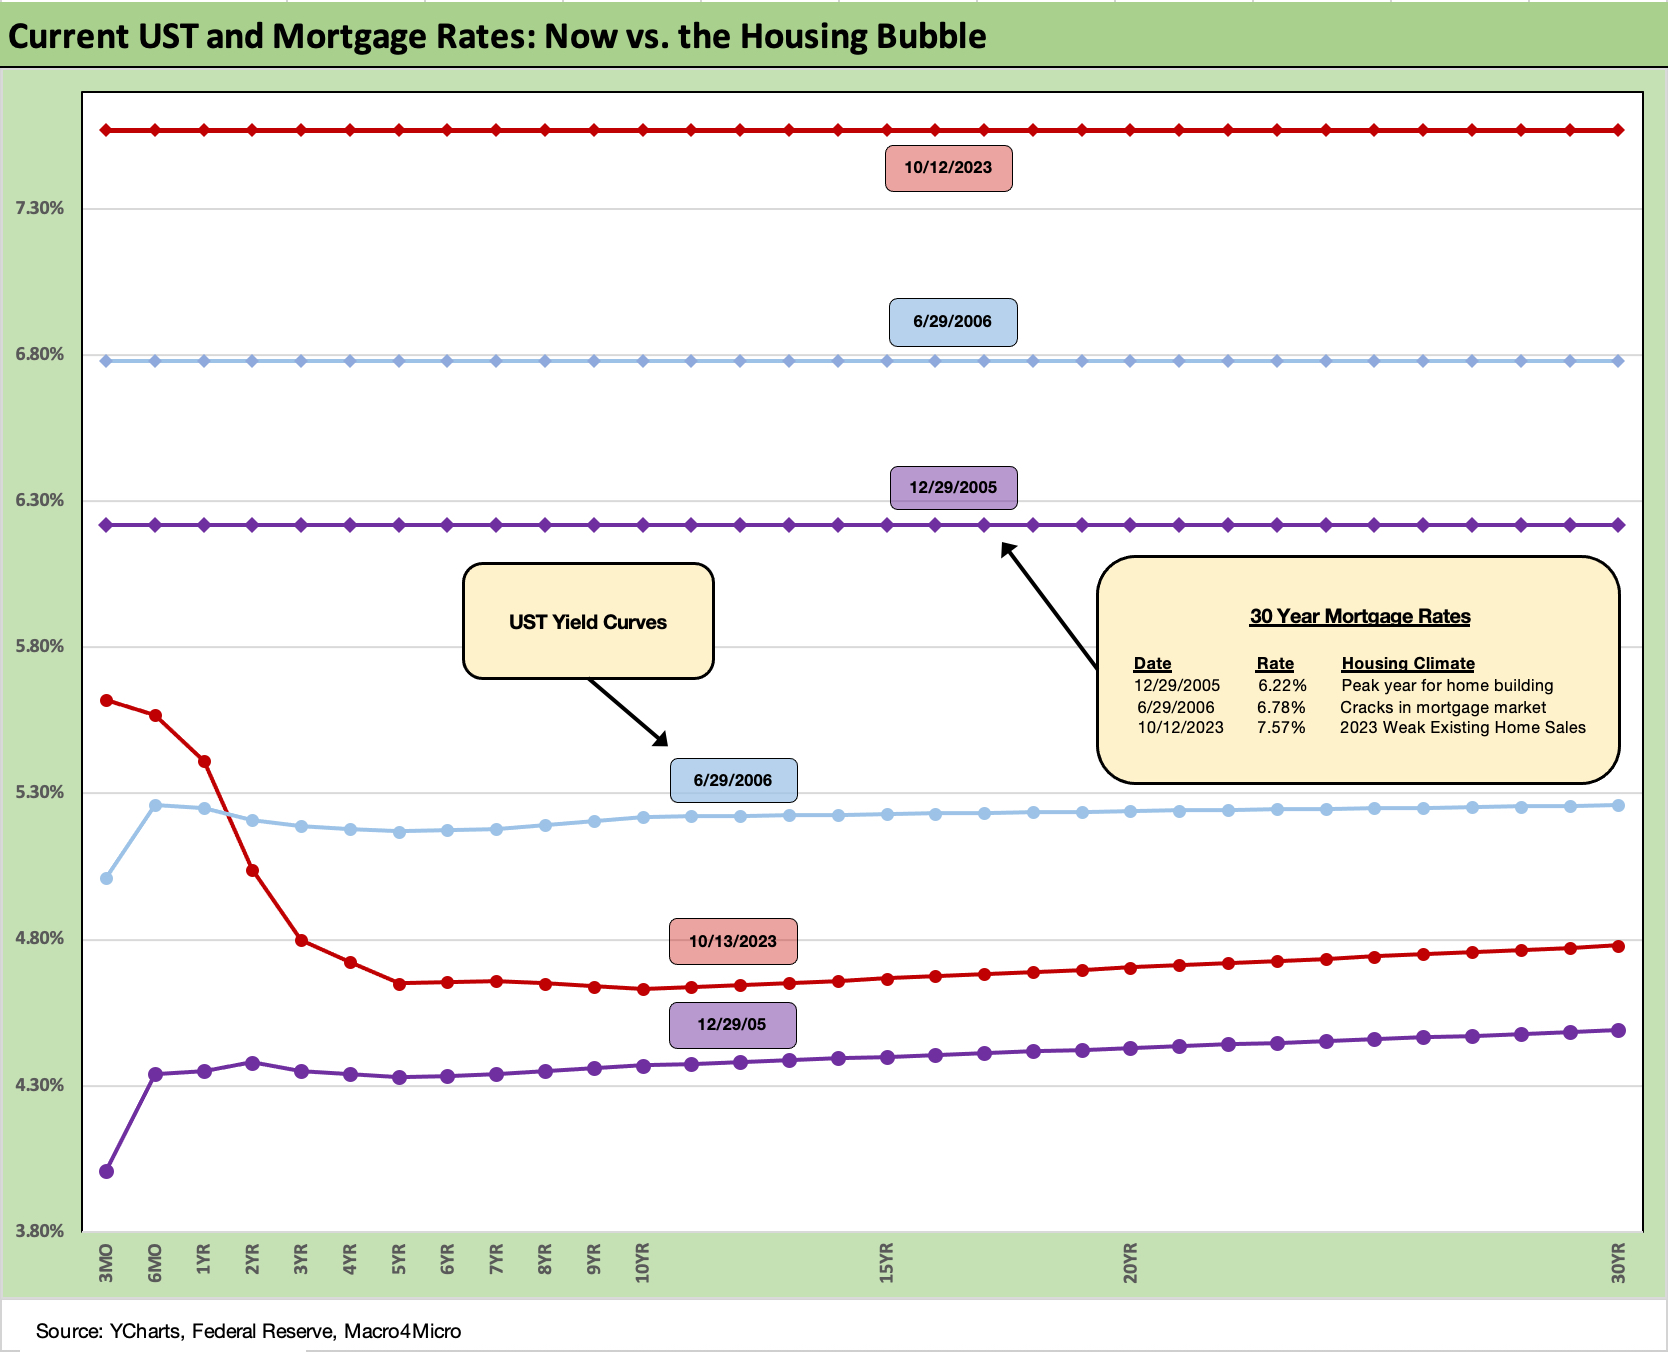
The above chart updates our weekly comparison on how the current Freddie Mac benchmark for 30Y mortgages and the current yield curve frames up in a comparison with the UST curve and mortgage rates of the peak housing years. The year 2005 was the peak homebuilding year while mid-2006 was when the cracks started to show in the mortgage securitization mania and “liar loan” peaks.
We were hovering around the 5% UST range in mid-2006, so UST rates were around what we see today. A year later, Countrywide was looking for capital (and an eventual rescue by BofA) and some of the more aggressive hedge funds were blowing up.
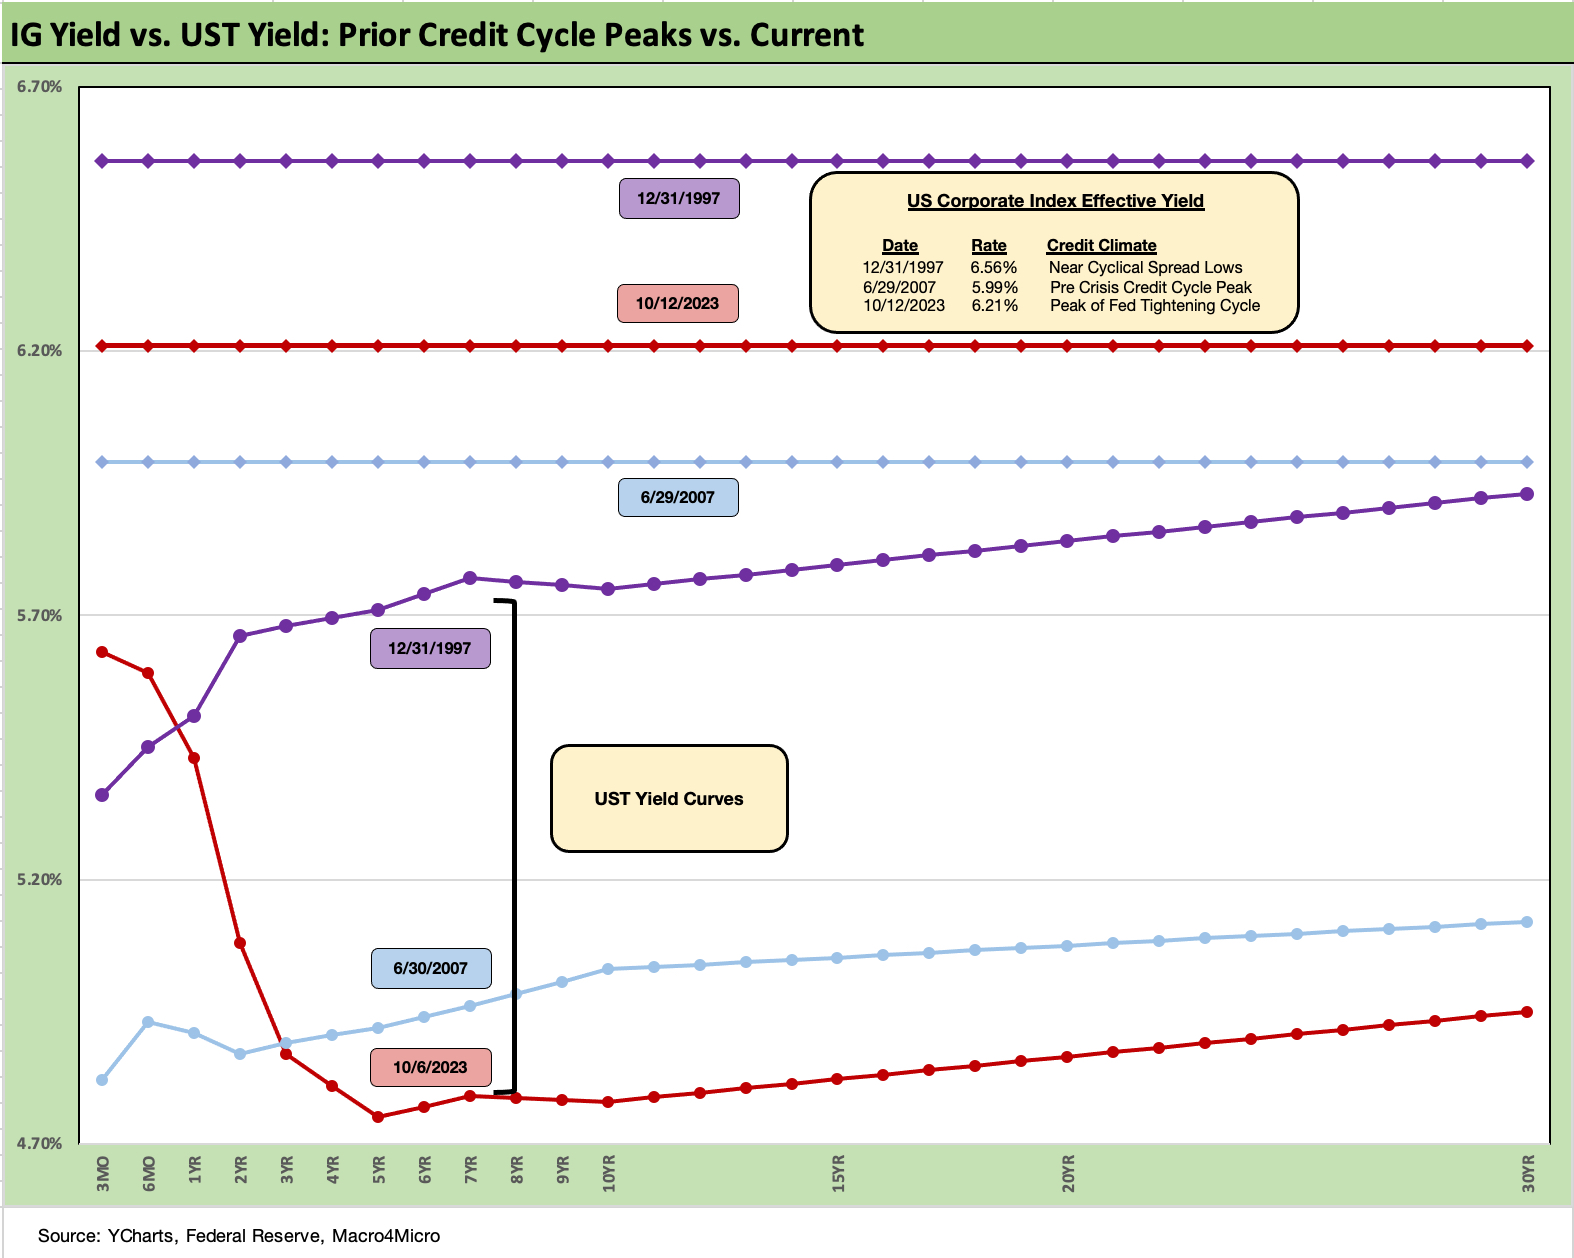
The above chart does a similar drill comparing IG index yields and UST curves to periods where the market was near high grade OAS lows such as late 1997 and mid-2007. Spreads were much tighter in those peak periods relative to the +127 bps to close last week in the ICE IG index. The +70 bps for the index at the end of 1997 was much lower (the low was in Oct 1997 at +53 bps) and +100 bps at 6-30-07. As we know, a lot can happen in a hurry even in IG as later 2007 and 2008 showed.
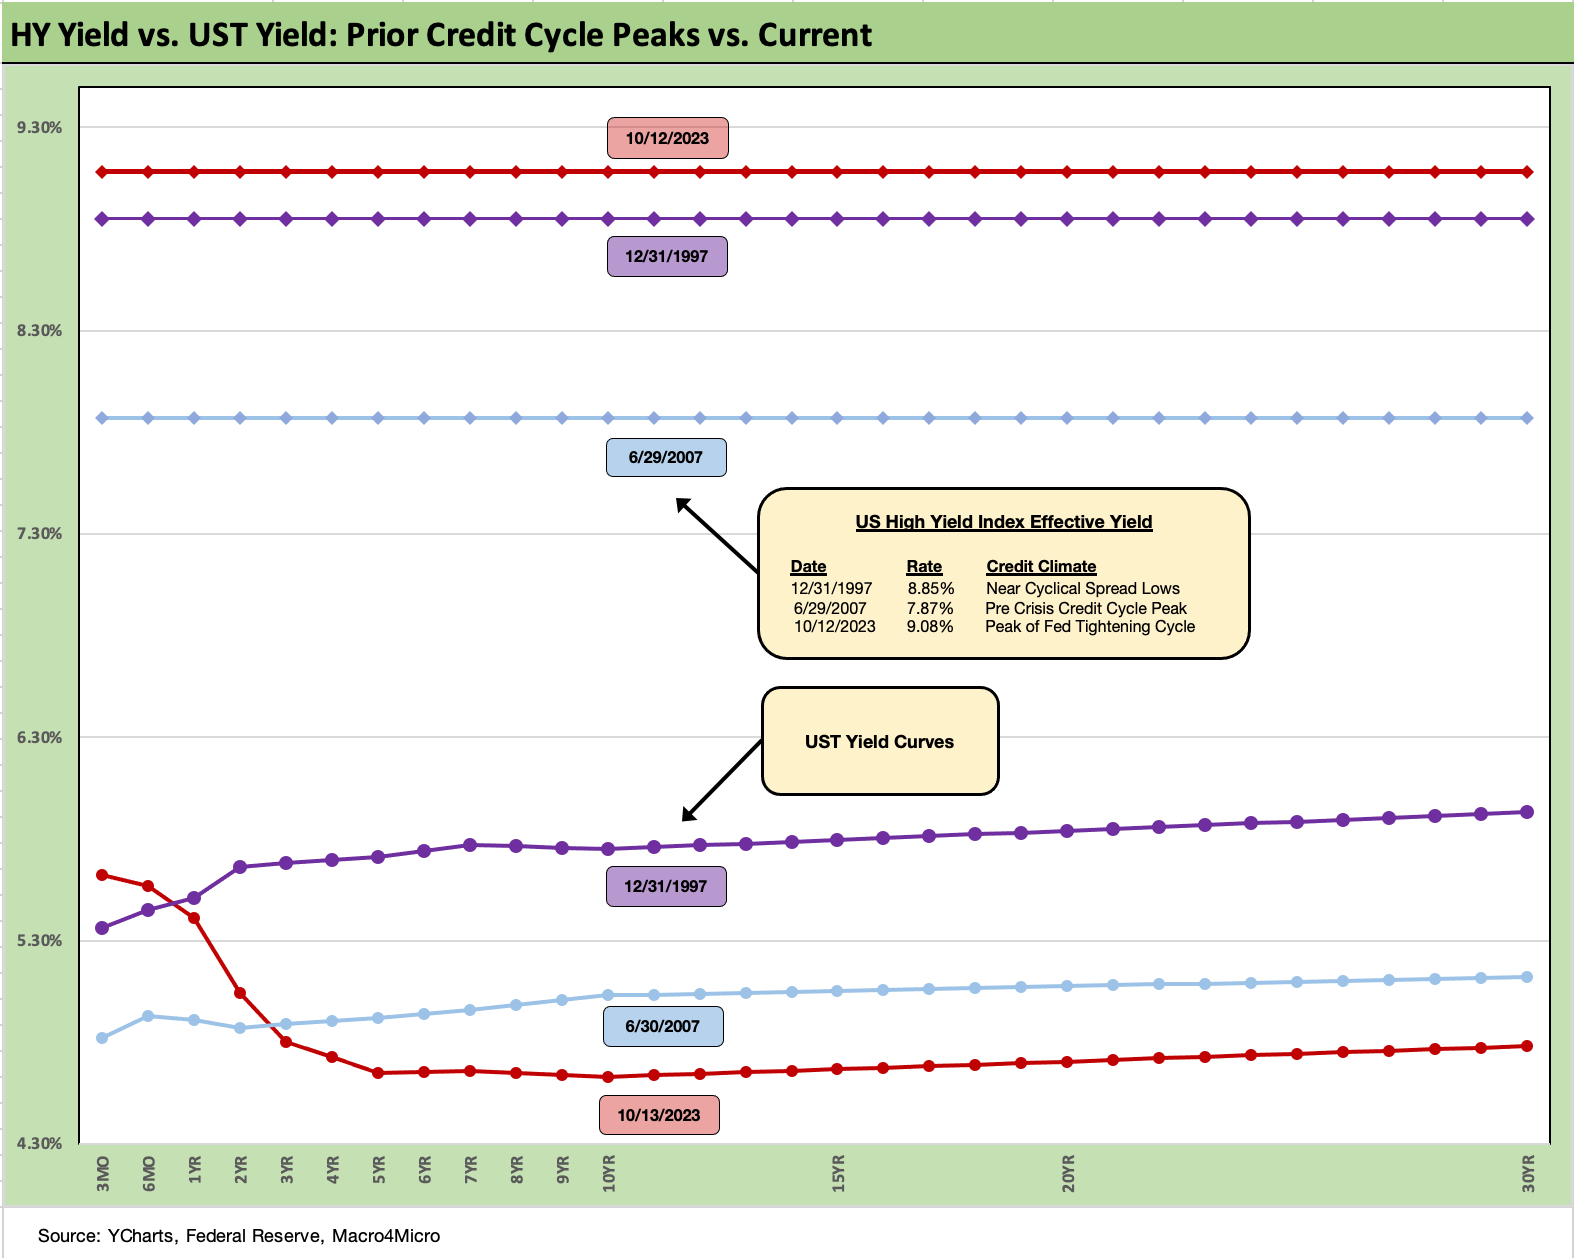
The above chart does the same drill for US HY as we did for the IG markets, and we use the same dates. We see HY OAS back in June 1997 at +296 bps (12-31-97) although HY OAS had been inside +250 bps in Oct 1997 (+244 10-17-97).
During the crazy period of June 2007 as the market fuse was burning down, we saw HY OAS of +298 bps on 6-30-07 (as tight as +244 on 6-1-07) vs. the +430 bps to end the last week.
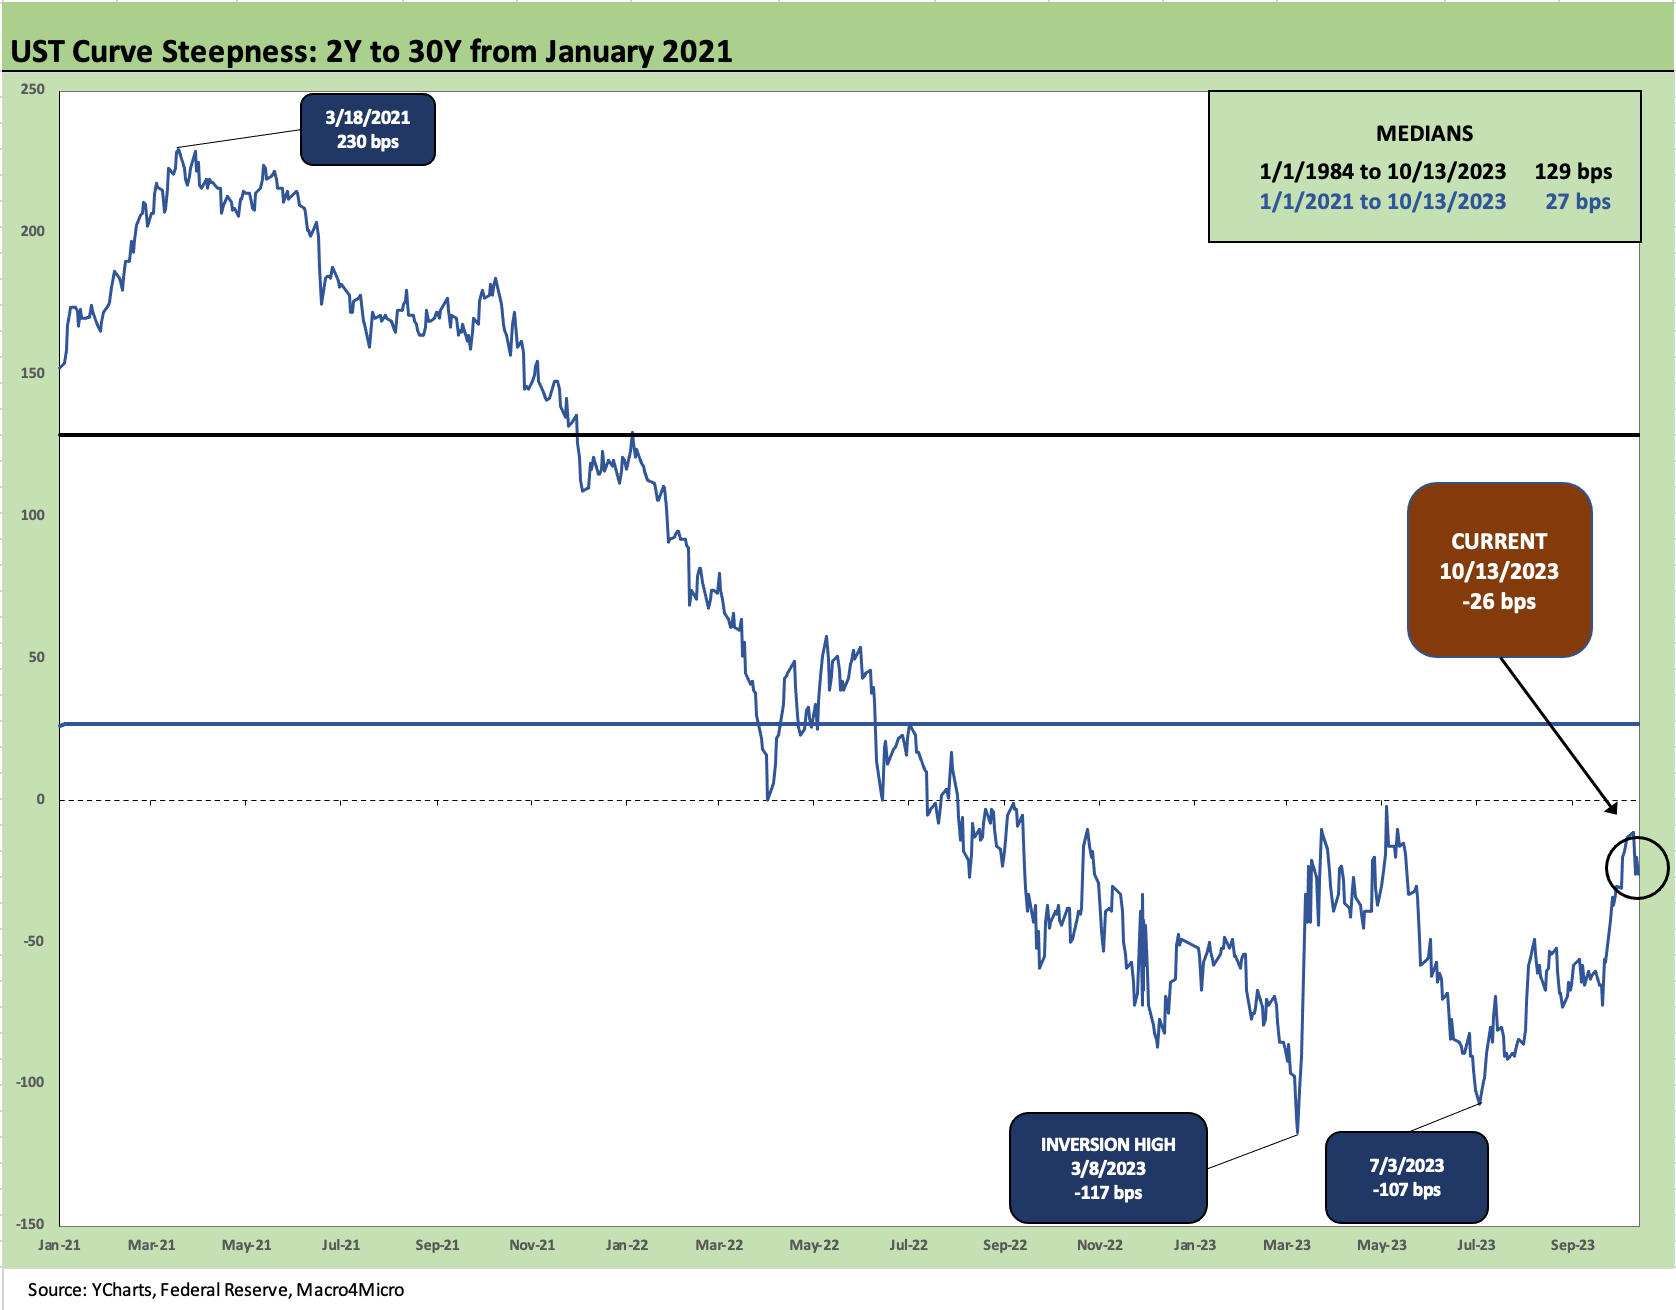
The above chart updates the 2Y to 30Y slope for the latest mini-flattening this past week. We see 2Y to 30Y at -26 bps or materially below the peak inversion pf -117 bps in March 2023 and -107 bps of early July 2023.
The above curve plots the shorter timeline from early 2021 for better visuals, and the median across that period was +27 bps vs. the post-1984 median of +129 bps.
We looked at longer term timelines across the cycles in earlier commentaries and Footnotes publications. We have been focusing on the curve slopes since we started posting articles last fall (see UST Curves: Slope Matters 10-25-22, UST Slope Update: Some New Inversion Highs 12-8-22). The curve slopes tell a story around reaching for yield and encouraging risk taking, but the inversion tends to get most of their focus as recession predictors.
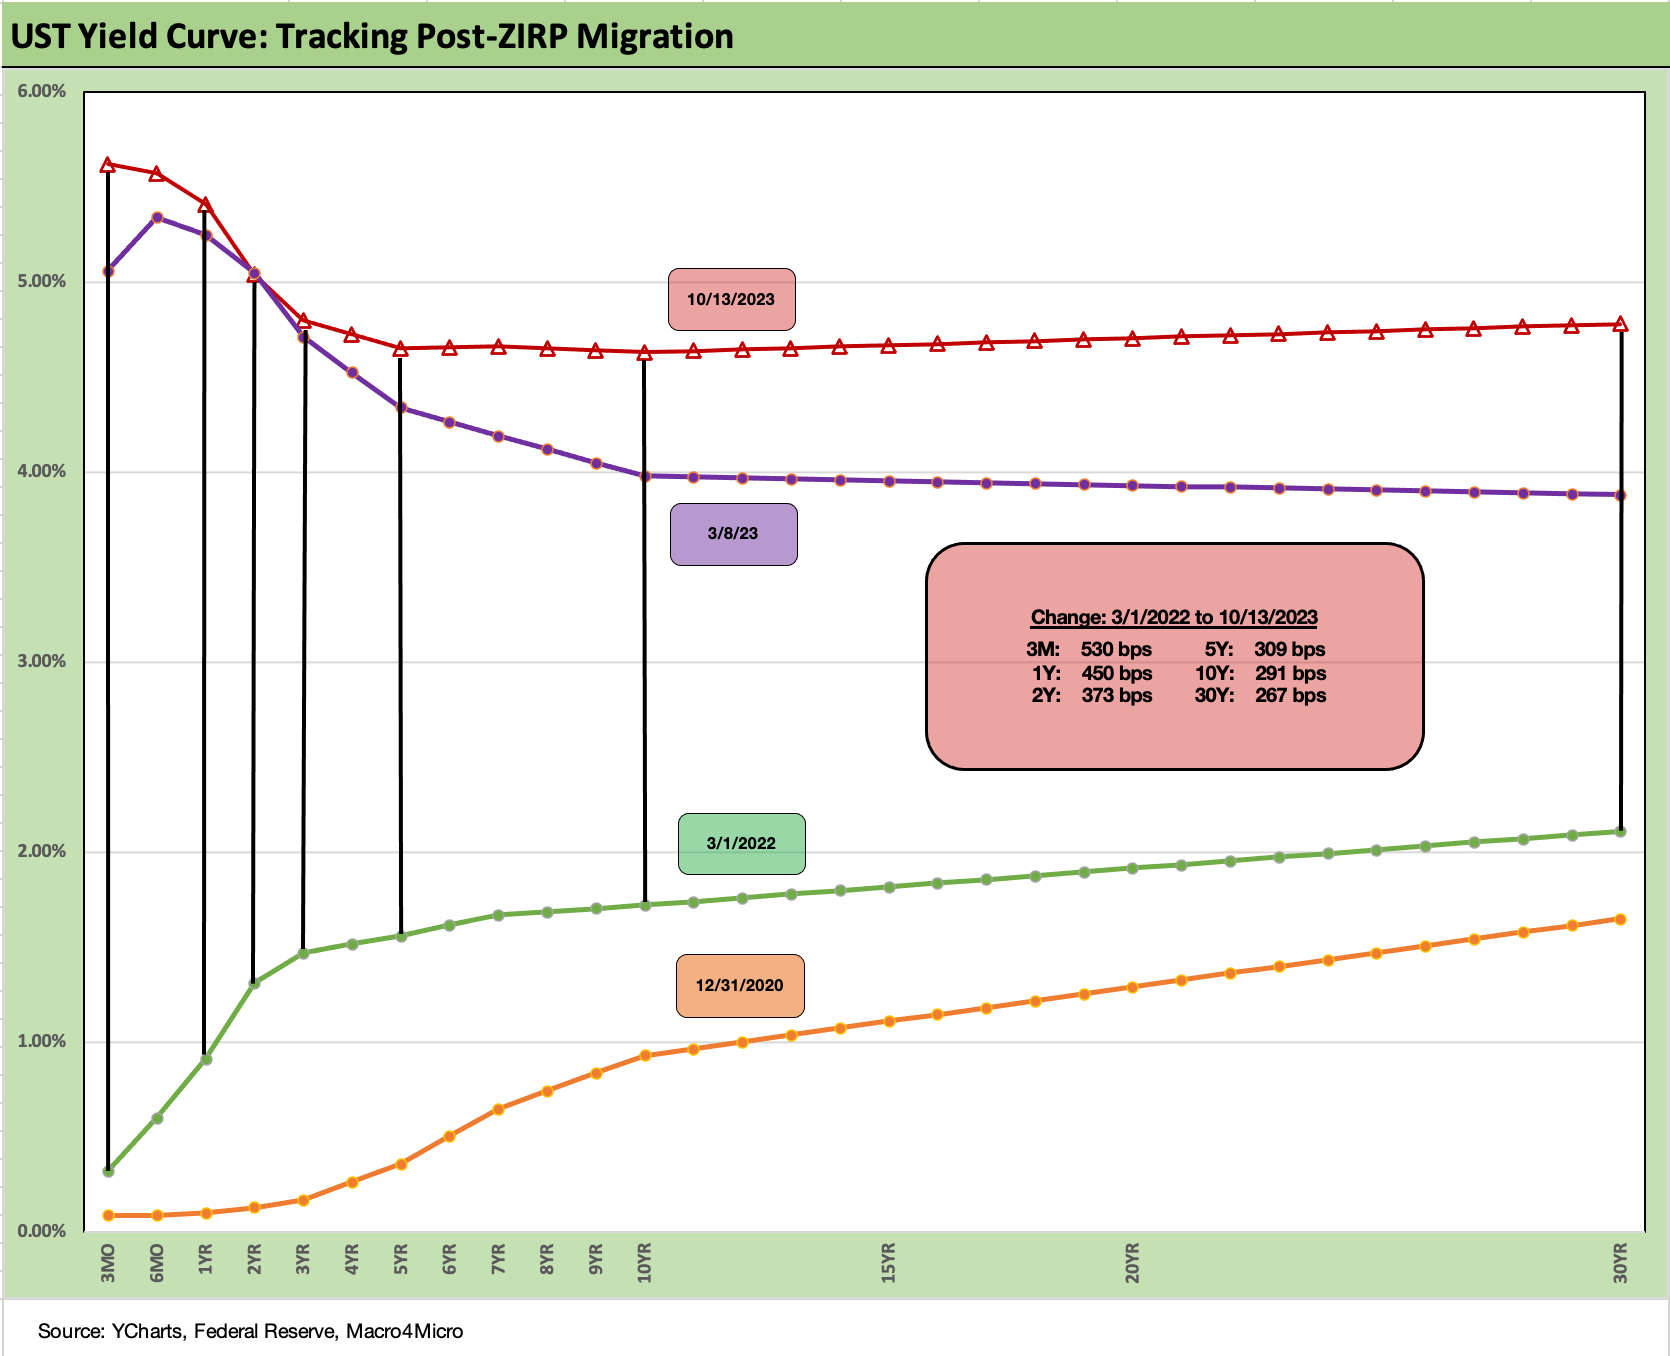
We wrap this week’s Yield Footnotes with our usual chart that shows the running UST curve differentials for maturities across the curve. As we all know, ZIRP ended in March 2022. The path is still a bear inversion that lately has been seeing some bear steepening playing catchup.
The Fed will remain data dependent from here, but we hope that is macro data and not missile inventory, cancelled flights, and government employees off payroll.