
FedEx Corp: Costs and Capital Allocation Lead the List
FDX F3Q24 earnings drew a double-digit pop in the stock even with the tepid cyclical signals while credit quality stays stable.


Decent profitability trends and margin results relative to expectations and constructive guidance from FDX helped drive the stock, but the macro signals (notably volumes) were slightly negative in the US metrics mix.
As a major global player in freight and logistics, the FDX report offered some support for the balanced cyclical view and offers a “check” in favor of FOMC easing at some point while the bullish price action for the often-volatile FDX stock was tied more to cost cutting and buyback news.
For bondholders, the increased stock buyback planning does not change the rock-steady BBB tier credit profile of FDX.
The fact that leverage is lower now than before COVID makes a statement on FDX financial resilience even after over $41 bn in cumulative capex ($34.1 bn) and buybacks ($7.2 bn) from 2019 to 2024 across a period where events served as catalysts for structural change in the various freight industry subsectors (notably in the air, on the ground, and new services).

We looked at FedEx in considerable detail in recent commentaries (see FedEx: Stability Counts, Complexity Challenges 1-23-24, Credit Crib Notes: FedEx Corp (FDX) 1-23-24), and the company’s operating fundamentals remain reassuring with respect to FDX’s financial profile. Higher margins despite soft revenues are tied more to cost actions at this point (structural costs, headcount, variable compensation accruals, etc.), but the high level of discretionary cash flow (capex, buybacks) highlights FDX’s operating liquidity strengths.
The multiyear structural changes underway and a stable balance sheet keeps FDX credit quality in a solid comfort zone. Credit quality is anchored and is reflected in the trading levels of FDX inside the BBB tier corporate comps. In the context of many of the BBB tier industry groups, FDX presents a lower business risk profile than more cyclical and commodity-driven sectors (e.g., energy, materials, etc.) or leveraged financial issuers with uncertain systemic risk variables and holding company structures.
A gyrating stock keeps making headlines…
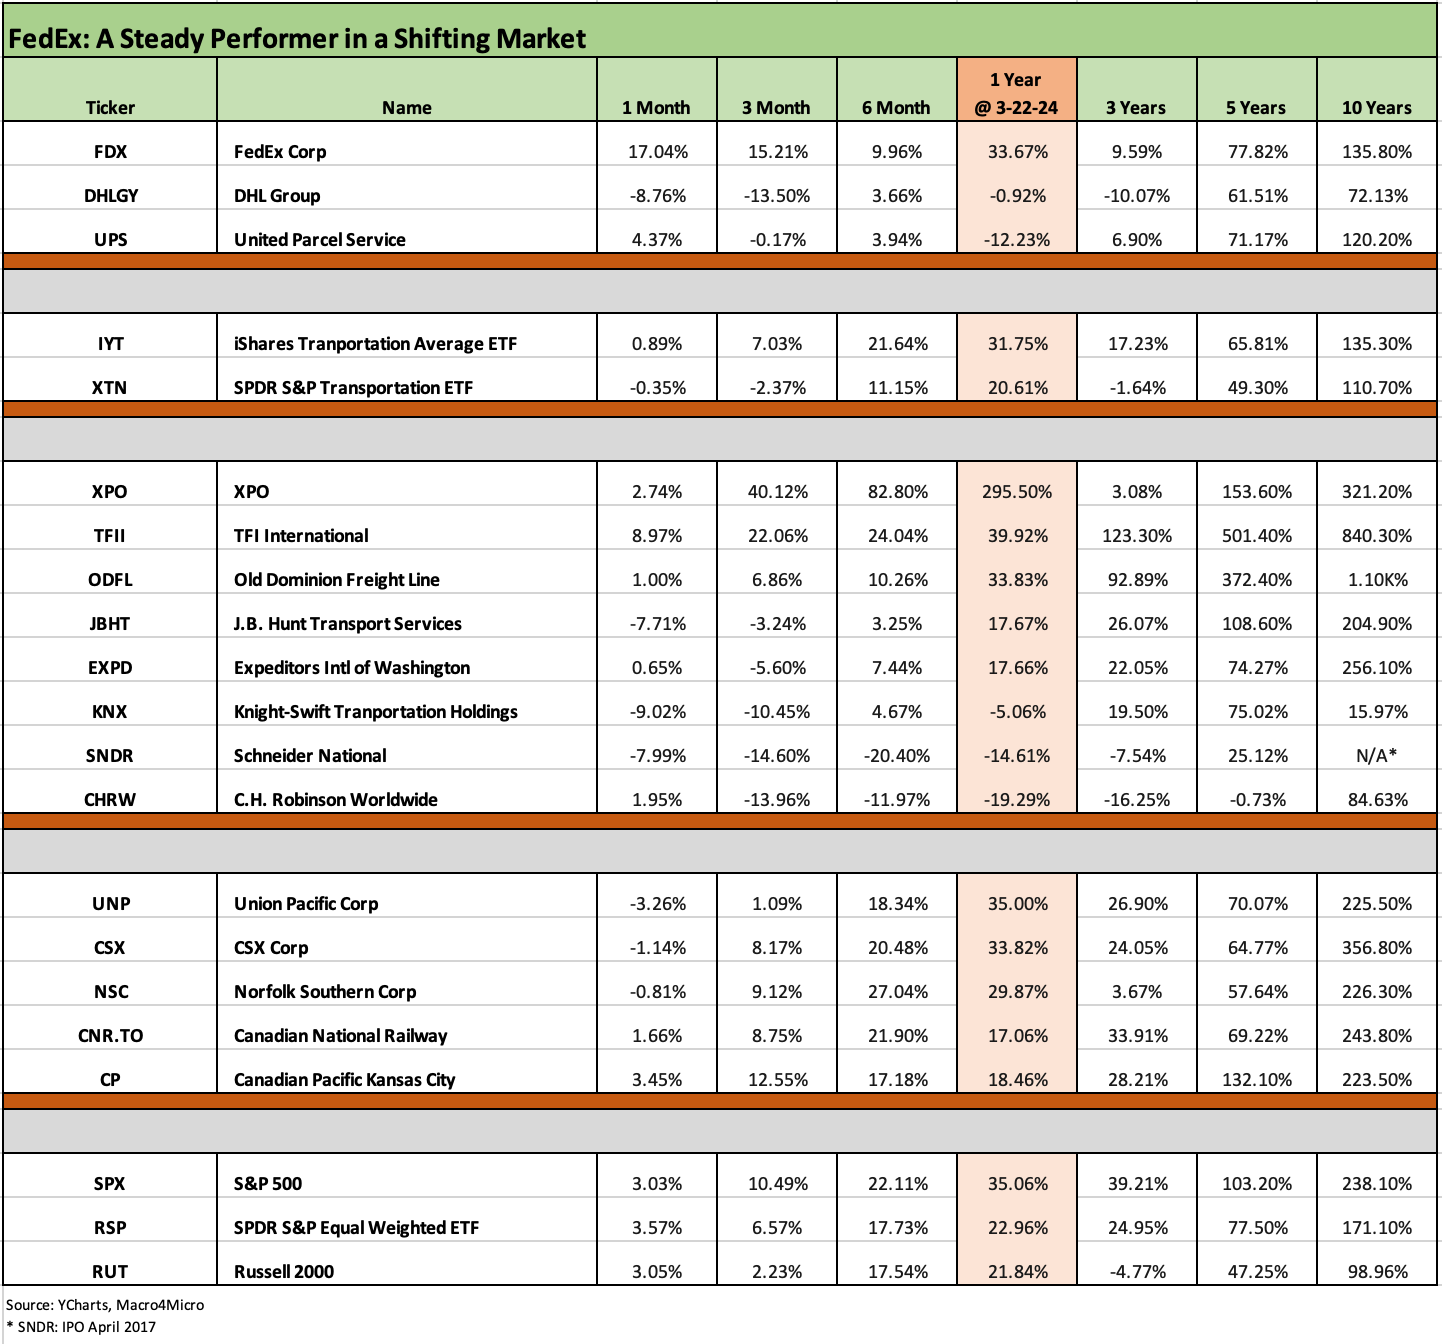
As noted in the stock chart above (FDX vs. UPS vs. the XTN ETF), FDX continues to post sharp swings in it stock as it goes through a multiyear restructuring program. The transition underway at FDX is changing its business model on how its Express and Ground operations meld. Part of that process is scaling the costs across its main business segments accordingly.
On a positive note, the stock performance reflects good news vs. peers and the market. FDX has outperformed across the period from just before the onset of COVID through recent days. There is no question that the peaks and valleys of the stock moves stand out.
Cyclical questions, structural change drive the story…
Lower volumes in the Feb 2024 quarter (F3Q24) are not telling a cyclical bullish story, but results beat expectations on the multiyear operational overhaul (and drove a big FDX equity rally on the week). FDX disclosure is quite detailed each quarter in both its press release and in its quarterly stat book. FDX offers a very granular and objective look at what is going on across so many pockets of the economy, so it provides a useful macro view.
We looked at a subset of those macro metrics in our Crib Note on FDX, and we again reviewed the extensive array of details on volumes and yields in the mix. Overall, we see a disproportionate mix of modest declines and cyclically soft numbers in the line items. In other words, it was not a positive set of measures on how the US economy is performing right now. The fact that FDX can post lower revenue and still generate higher margins is the main takeaway on how they are performing in a tough market.
Many investors who are positive on FDX take the longer-term view on the company’s strategy and how they are performing during the operational overhaul. Billions are coming out of structural costs and operating efficiencies coming with the changes underway and still ahead in FY 2025 with more coming later. Entire supplier chains and leading transport services operators are also seeing a lot of change. An absence of aggressive action would be a bigger problem.
We read a fair amount of freight and logistics trade rags, and the rate of change is at a breakneck pace after the COVID supplier chain shocks. The changes are intrinsic to the growing level of protectionism and supplier chain realignment as well as more than a few unpredictable geopolitical stress points (notably China vs. US).
After a period of volatility in the freight and logistics sector with all the COVID dislocations of supplier chains, the market will continue to see structural changes. That includes such highlights as the shifting role of Amazon in the broader transport services industry and the collapse of a major LTL trucking leader (Yellow). Those both directly impact FDX. In the case of Amazon, it is competition and more rapid change in e-commerce services. In the case of Yellow, it is an opportunity to capture share and for the industry to rationalize capacity.
The market needs to prepare for more of the same pressure from trade “evolution” (devolution?) and protectionism and the retaliation risks that come with it. All the freight players are framing trends in the brick-and-mortar activity in North America from production to warehousing. Every trend from greenfield onshoring expansion to brownfield reshoring to friendshoring matter in planning. There will be more questions on what a “friend” is as evident in the growing tension with Mexico.
For FDX, the balance of operating metrics seen in the most recent earnings reporting season (and the FDX 3Q24 numbers) support the constructive but cautious cyclical tone prevailing in the market these days. The cross-section of freight players and their stock price action detailed above are not signaling fears of recession, but volumes have seen a lot of examples of weakness and rate competition. The good news for FDX is that their stock action is right in the hunt.
For FDX narrowly, the scale of the FDX cost cutting actions and business model springs from its various initiatives (One FedEx, Network 2.0, more recently the Tricolor strategy, etc.). The programs run into billions in cost savings and mitigate downside risks from ecommerce evolution, the rise of Amazon in transport services, and the risk of much more trade tension in 2025 that could keep the income statement volatile.
FedEx: Into the Weeds
In the charts that follow, we update the operating results, segment performance, balance sheet trends, and key cash flow line items as capex is past its peak and more buybacks are in the planning process.

The above chart shows higher profits and margins for F3Q24 and the same for the 9 month YTD numbers. Margins are still not back to 2019 levels and are below the 2021 level when pricing power favored the freight players in the supplier chain crunch. Revenue ticked lower in F3Q24 and YTD even as profits rose. FDX is calling for a low single-digit decline in revenues for FY 2024 (May 31 fiscal year).
Among the various timeline challenges ahead, FDX cited the potential to renew (or lose) its contract with the US Postal Service (USPS). The costs to be taken out of Europe could reach $600 mn in FY 2025, and the slow integration of Europe will continue. The consolidation of Express, Ground, and Services is going to generate some challenges in framing the trend lines for the new reporting segments in historical context to pre-COVID periods. FY 2025 will bring a lot of new segment disclosure and breakdowns.
Costs have been the main driver of margin improvement. The usual mantra of “you can’t cut your way to profit growth over the long term” is being heard in the market and is true enough, but these structural changes that are taking out costs in a changing market are critical and will also open up new sources of services revenue. The cost reduction is heavy on “defense” but also includes a lot of “offense.”
The company has discussed the various restructuring programs at length in analyst meetings (see FedEx: Sweeping Restructuring Plan as FDX Seeks Rally from Recent Setbacks 4-9-23). The challenge to get more value out of the European expansion (TNT acquisition) is featured prominently in the operational game plan.
The high-level theme music is reduced capital intensity, more efficiently integrating a valuable asset base, modernizing facilities, continuing to invest tech and digital, and continuing network optimization. Given the growing complexity and shifting trade flows inside and outside the US, the complexity of the freight and logistics is putting pressure on all the subsectors to “up their game” and adapt while also creating new revenue stream opportunities.
The industry will obviously get its latest challenge to operational dexterity with the bridge collapse in Baltimore. Getting product from point A to point B just got harder again with Baltimore being critical in many freight categories, including autos.
The recurring theme of high IT spending being necessary given more data driven and digitally dictated business lines continues. That is all part of the shifting business model and expansion of services available for shippers. FDX (and UPS) cannot stand still when the theme of change cuts across many of the subsectors we break out in the broader peer chart above.
The margin trends are supported by the cost actions that will take out $1.8 billion in FY 2024 and $2.2 bn in FY 2025. The company has made some material headcount reductions of 22K over the past year. FDX cited SG&A reduction of $350 mn YTD and $150 mn in F3Q24. The operating profit guidance for FY 2024 is an estimated adjusted operating profit of $6.3 bn.

The above chart breaks out segment numbers with Express still struggling as their largest business segment, Ground is performing well, and Freight remains steady. The financial metrics still leave a lot of room for improvement as the Express issues are addressed. As we covered earlier, the new fiscal year 2025 will include new segment disclosure. The market was happy with the Express numbers relative to expectations, but that unit has a long way to go as it moves into the new segment reporting structure in 2025.

The above chart highlights the asset intensity of FDX but also the steady and stable balance sheet metrics since pre-COVID days. Total debt % Cap and Net debt % Cap are both lower at the most recent balance sheet date (2-29-24) than at the end of 2019 on the way into COVID.
Below we detail the key cash flow lines and ambitious capex and buybacks that have not undermined the FDX balance sheet. Over $34 billion in capex from 2019 through F3Q24 and over $7 bn in stock buybacks still show lower leverage now vs. 2019-2020. Leverage has remained in a stable range since FY 2021.

The above chart also updates running capex numbers and the mix of capex by types. The FY 2024 estimate for capex is $5.4 bn, which marks a sharp decline from $6.2 bn in FY 2023. Aircraft outlays have peaked and are expected to decline to $1 bn by FY 2026. FDX indicates that Capex % Revenue will also decline from this point. Capex % Revenue was 6.8% in FY 2023 and 6.1% YTD 4Q24.
For buybacks, FDX accelerated its buyback rate in F3Q24 for a total of $2 bn YTD and will finish FY 2024 with $2.5 bn. FDX got shareholders excited with a new $5 bn buyback program approval by the board to “augment” the $600 mn remaining under the old 2021 plan.
See also:
FedEx: Stability Counts, Complexity Challenges 1-23-24
Credit Crib Notes: FedEx Corp (FDX) 1-23-24
FedEx F4Q23: Company Comment 6-21-23
FedEx: Sweeping Restructuring Plan as FDX Seeks Rally from Recent Setbacks 4-9-23