Banks and Macro Nerves: When Regional Becomes National
Excerpts from Footnotes and Flashbacks: Week Ending March 19, 2023
Even though we spend a lot of time looking at issuers and industries, it has been hard to look away from the banks in recent days. You can reward yourself for good behavior by looking at a Lennar or FedEx earnings results, but the fate of the economy from here in the US is more tied into the banks and the threats of credit contraction.
We had covered the spread reactions over the weekend across the credit tiers (see Spreads Across Tiers: Decompression + Volatility 3-18-23), in IG (see IG Corporate Spreads: Tough Pathway, A Few Doors Ahead 3-19-23) and HY (see US HY Spread Histories: Weird Science, New Parts 3-19-23 ).
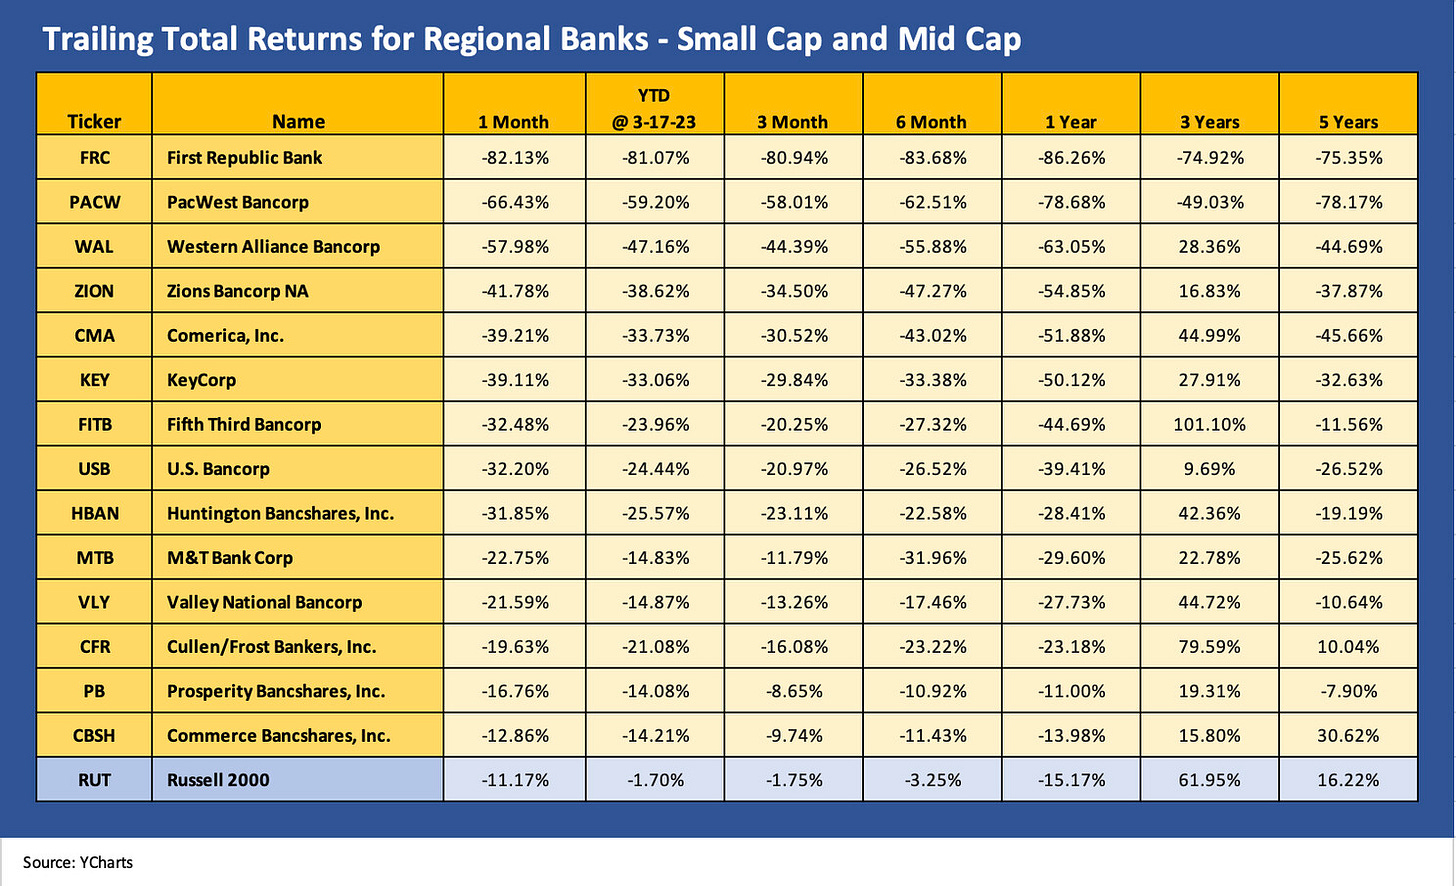
The story line is not pretty even if just in the question marks around the bank system risk appetites and funding profiles. The chart below hammers home how much the regional banks have been impacted as the stocks plunged. Some rallied today on the hope factor and the simple reality that the conversations are favoring additional support (even if contingent) for small banks and community lenders.
There is not much interpretation needed in the following chart.
The mix of banks above is more weighted toward small cap than midcap banks as typically defined, but the term “regional” applies. Only two are over $20 bn in market cap and only five are in double digit billions. The outlier on the high end of market caps on the list is US Bancorp (USB) as a large cap name at over $50 bn threshold which we added as a measuring stick and as a high-quality bank. All the banks are feeling the heat.
We looked at some of the myriad chart collections making the rounds the past two weeks and selected names that had high securities holdings in the mix or high Held to Maturity (HTM) and AFS portfolios or “all of the above.” We sense many are looking for the perfect ratio to capture a replay of SVB, but it is just not that easy. The easiest way to calm nerves is to focus on unrealized losses vs. equity since SVB was so hideous in that one metric.
The reality is that handicapping deposit flight risk (the push of a button in most cases) will not be handled by telling people you don’t have a bad ratio or two using some metric that highlight what a house of horrors SVB had become. Such actions also put you in the legal and regulatory crosshairs if you start narrowing investors’ attention – especially when they see the stock price action detailed above. Numerous banks are scrambling to retell their stories in a low confidence market backdrop, and that is only going to do some much.
We throw this chart in the mix here in part for dramatic effect (it looks like a shale oil or E&P chart from 2015) but also as a reminder of how broad the pressure is on bank management teams to watch out for shareholder interests and try to balance that with the major customers and communities. Tightening credit would be the opposite in terms of customers. That is no easy task and will roll up somewhere along the way into a view on credit contraction or defensive lending and what it might all mean in the coming months.


