


Not easy being a real estate broker these days…
We look at some UST and mortgage rate histories. This week put another ugly data point on the board with 7.5% in the Mortgage News Daily survey on Friday that came at the end of a horrible week for UST. By Friday, duration was crying out for mercy.
The mortgage headwinds may be “old news,” but the monthly payment affordability stress and refi headwinds continue to constrain the ability of sellers and buyers alike to make life decisions, move up, downsize, cash out, or fund key financial challenges (retirement, tuition, weddings etc.).
The sub 4 million volume levels are a long way from the 5 million and 6 million handles of 2021-2022. Affordability is defined more by monthly payments than home prices even as the median home prices in existing sales YoY have increased for 40 consecutive months.
While political “speechifying” brings promises to make housing more affordable, the ability to change basic mortgage math is not cooperating as inflation remains higher and record US deficits are a risk that only increases. We just saw a fresh record high deficit month for October as US interest costs in the budget are hitting a record in budget share.
The existing sales headline number of 3.75 million was down -5.5% MoM and -8.8% YoY to the lowest since August 2010. Inventory levels rose in unit terms MoM and YoY with “supply months” rising to over 5 months (vs. 4.7 months in Sept) with the weaker selling rates.
Sales rates declined in all 4 regions with the critical South region down by -8%, the West down by -14.5% YoY, the Midwest down by -8.2%, and the smaller Northeast region down by -4.1%. 3 of 4 regions were also down MoM with the Northeast flat. We get housing starts this coming week.
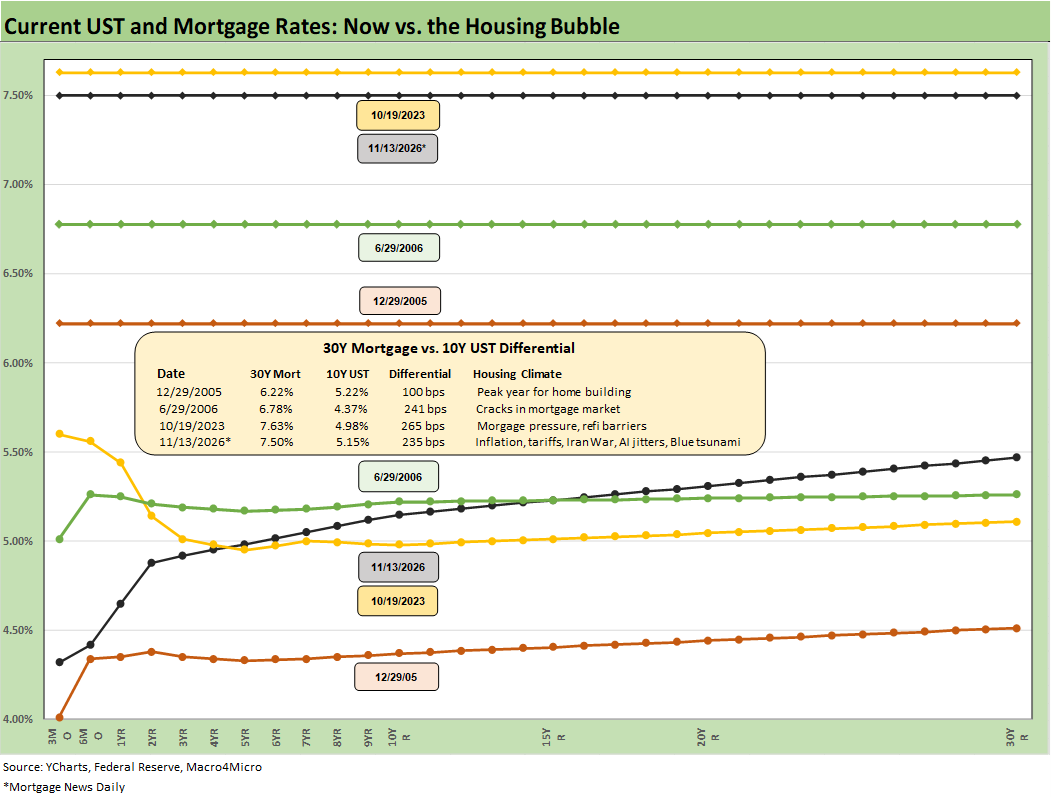
For the above chart, we revisit the UST yield curves vs. mortgage rates across some critical periods over the housing cycle bubble years (2005, 2006), during the peak mortgage period of fall 2023, and as of this past Friday close. The year 2005 was the peak homebuilding year during the bubble while mid-2006 marked the period when the subprime RMBS challenges were starting to get flagged. We use the Oct 2023 date when mortgage surveys away from Freddie were citing some 8% levels.
We detail the yield differential between the 30Y Freddie Mortgage benchmarks vs. the 10Y UST. For this past Friday, we switch over to the Mortgage News Daily survey rate for Friday given the lagging effect of the Freddie rate setting process (set on Thursday midday) on its high-quality mortgage criteria.
The steep sell-off in UST to wrap the week sent the Mortgage News Daily level to 7.5% or 32 bps higher over 3 days. The lagging weekly Freddie Mac benchmark (Thursday release) was 7.11%, down from 7.18% the prior week and 6.24% the prior year. The takeaway is that the Friday rates show upward pressure on mortgage rates broadly unless something at the macro level sends the curve sharply lower.
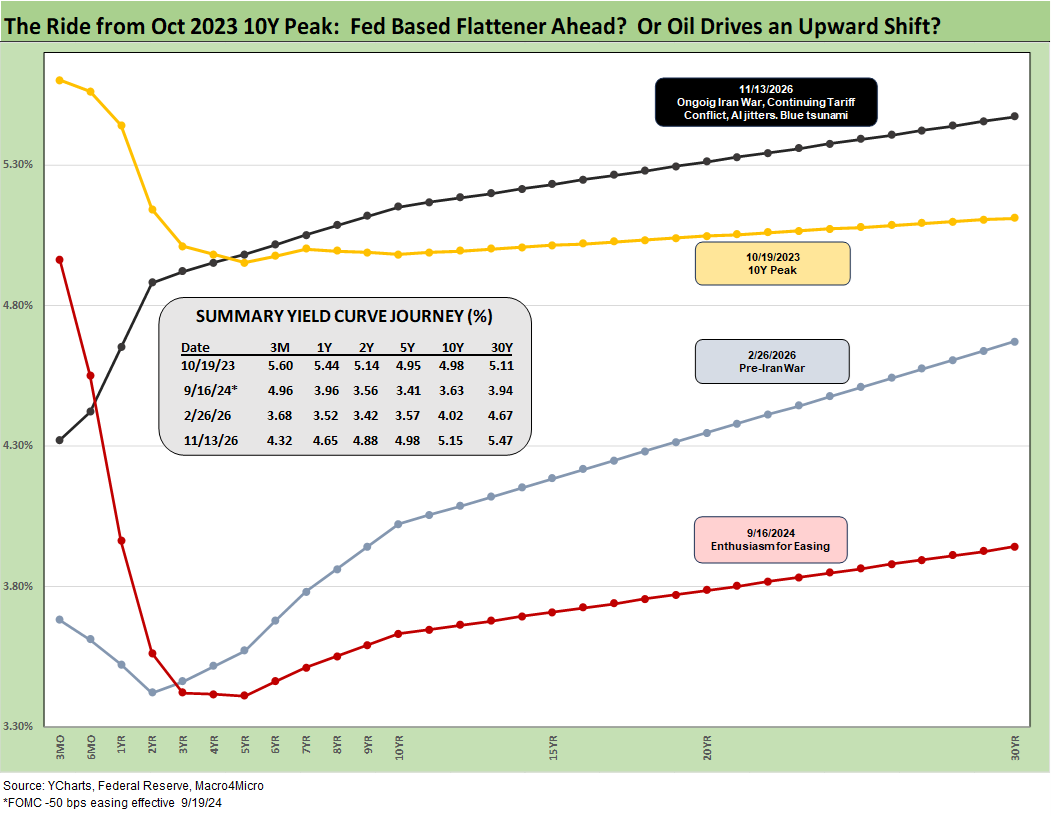
The above yield curve chart details the big shift lower from Oct 2023 with its inversion shifting down into Sept 2024 and the start of the easing cycle into 4Q24. The 2025 period (not shown, see The Curve 12-15-25) saw a fairly dramatic steepening on the way into the late Feb 2026 UST curve before Iran sent the curve materially higher to where we ended last week with another tightening move almost assured in Dec 2026. The FedWatch odds for 1 hike to 400-425 bps at the Dec FOMC meeting hit 95% as we go to print, up from 65.7% 1 month ago.
The odds of another tightening to 425-450 bps in January 2027 are now up to 71.1%. That is not good news for mortgages even if oil will cast an important vote on the slope of the curve.
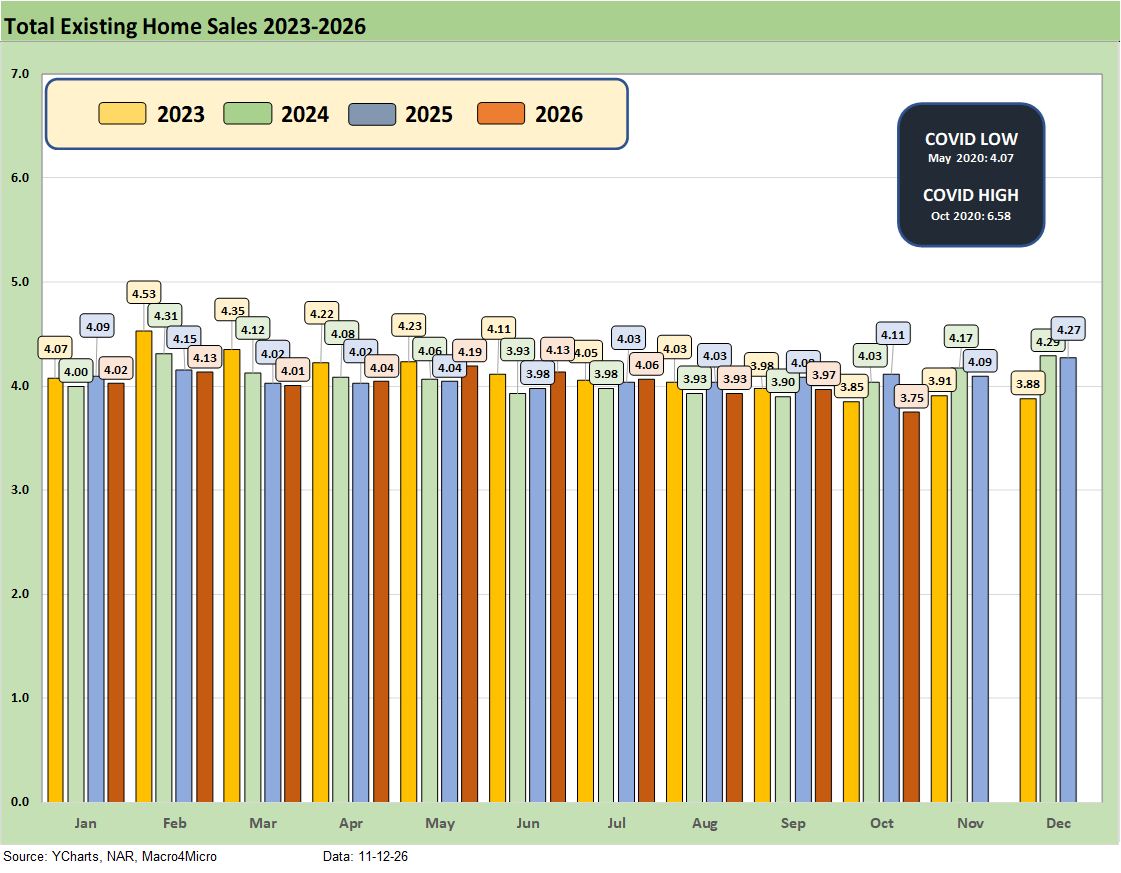
The above chart details existing home sales SAAR run rates by month from January 2023 to October 2026 with 3.75 million in Oct after 3.97 million in Sept. That was down from 4 million handles in July and June. As a frame of reference, during 2021 and 2022, the market had been posting 6 million and 5 million handle existing home sales volumes.
The recent existing home sales totals are starting to look more like the late 2023 period when mortgages had peaked (see Existing Home Sales Dec 2023: Rerun of Multi-Decade Low 1-19-24). That makes sense given current mortgage rates now above 7%. The Freddie Mac 30Y mortgage rate has moved within a 200 bps range since the Oct 2023 peak.
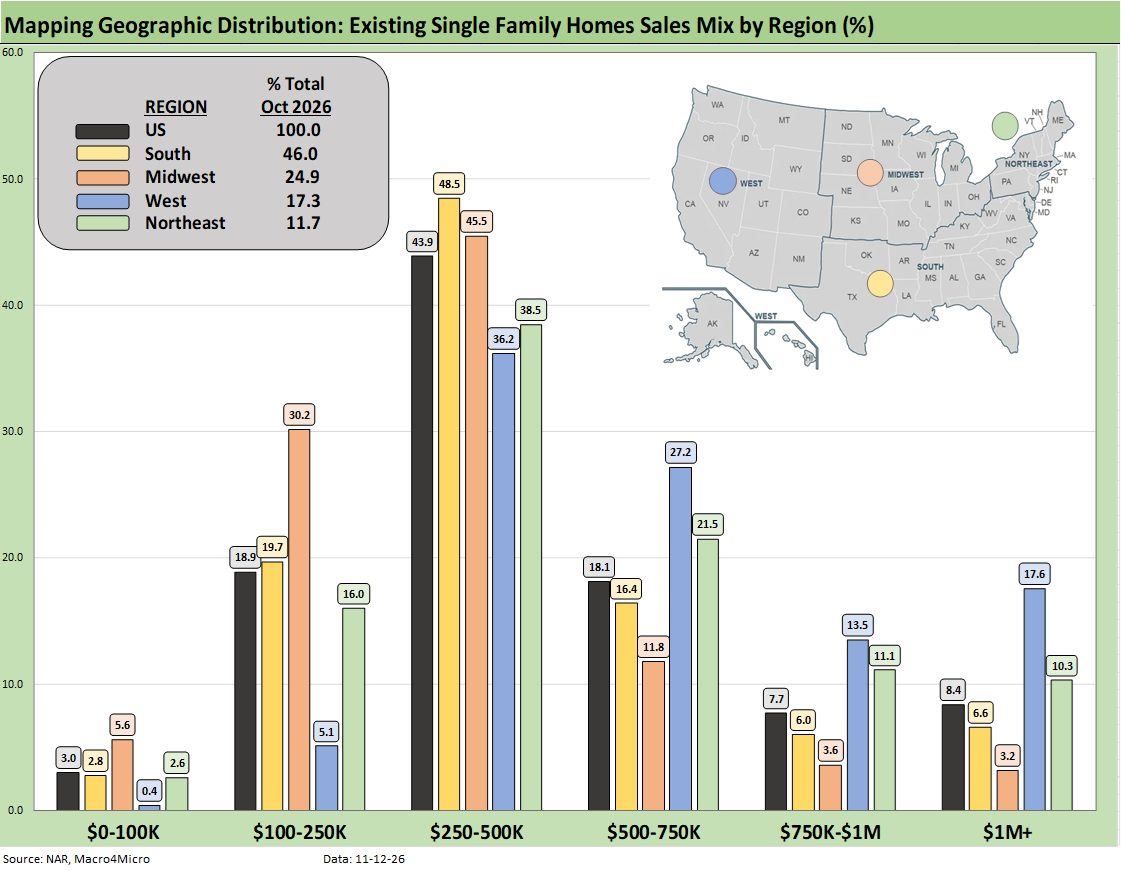
The above chart shows the geographic mix of volumes and details on price mix by region. The South is the main event in single family volumes whether new or existing at around 46% of total volumes.
For the bar chart, we break out the mix for each region by price tier. For example, the South shows around almost 49% of its existing home sales volume in the $250K to $500K range and almost 20% of its sales in the $100K to $250K bucket.
The high cost of homes in the West (notably California) is clear enough just by glancing at the bar chart with over 17% at prices over $1 million. The second highest region in the $1 million club is the Northeast at over 10%.
We see a major concentration across the regions in the $250K to $500K range although the $100K to $250K bracket for the Midwest stands at over 30%. The West shows a high share of over 27% in the $500 to $750K bracket, which again underscores how expensive the West region price tags remain in national context.
The map explains what states are in each Census region. There is a very wide range of home price profiles in the West and Midwest states.
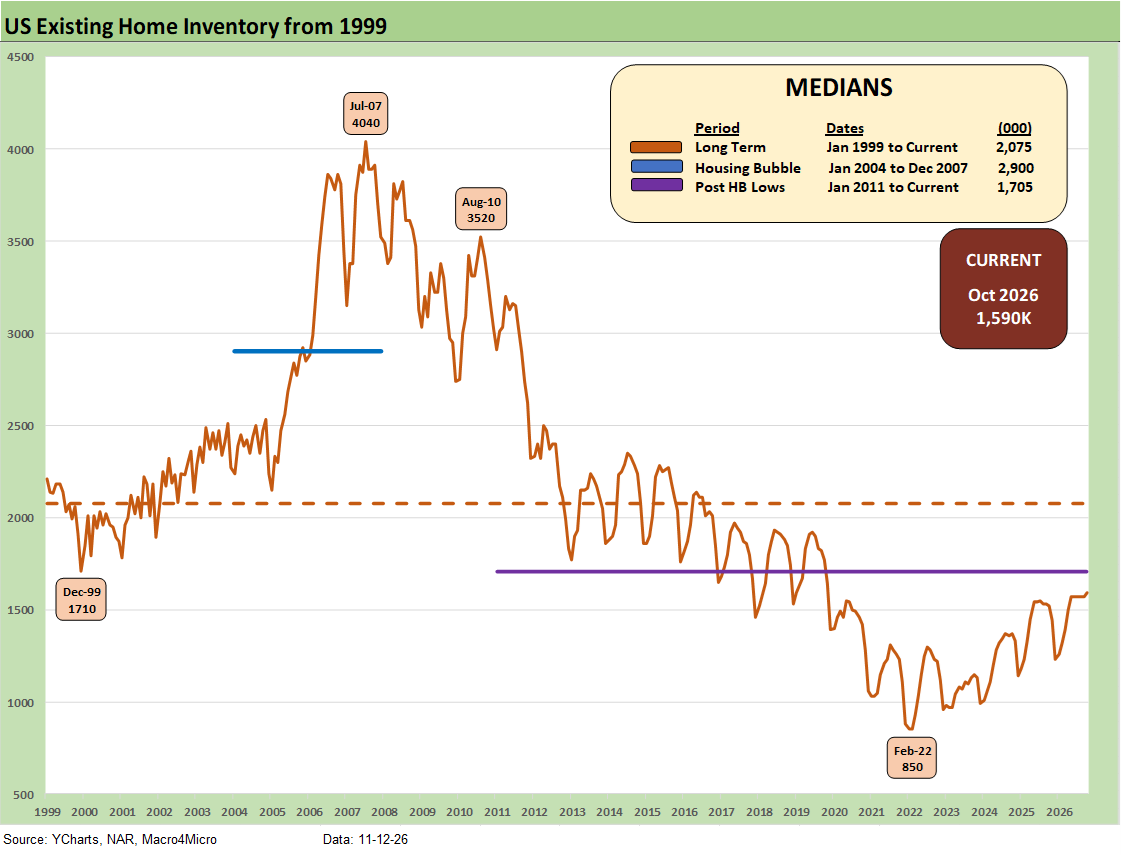
Inventory for total existing homes ticked higher MoM to 1.59 million units for +1.3% MoM and +4.6% YoY. Current inventory is well below longer term medians including 2.08 million for the post-1998 median. The median from Jan 2011 (homebuilding low) to current times is 1.71 million.
In other words, existing home sales inventory remains low even if the level is materially higher than the stunning low of 850K of Feb 2022 ahead of the end of ZIRP and start of the tightening cycle in March 2022.
The existing home inventory balance had shown a steady rise off the sub-1 million lows of 2022. Inventory had risen to the 1.3 million handle range in 2024 before dipping back down to a low of 1.14 million to close out 2024. We bounced off those numbers in 2025 to get back above 1.5 million handles before the move lower to 1.2 and 1.3 million handles and then back to current levels near 1.6 million.
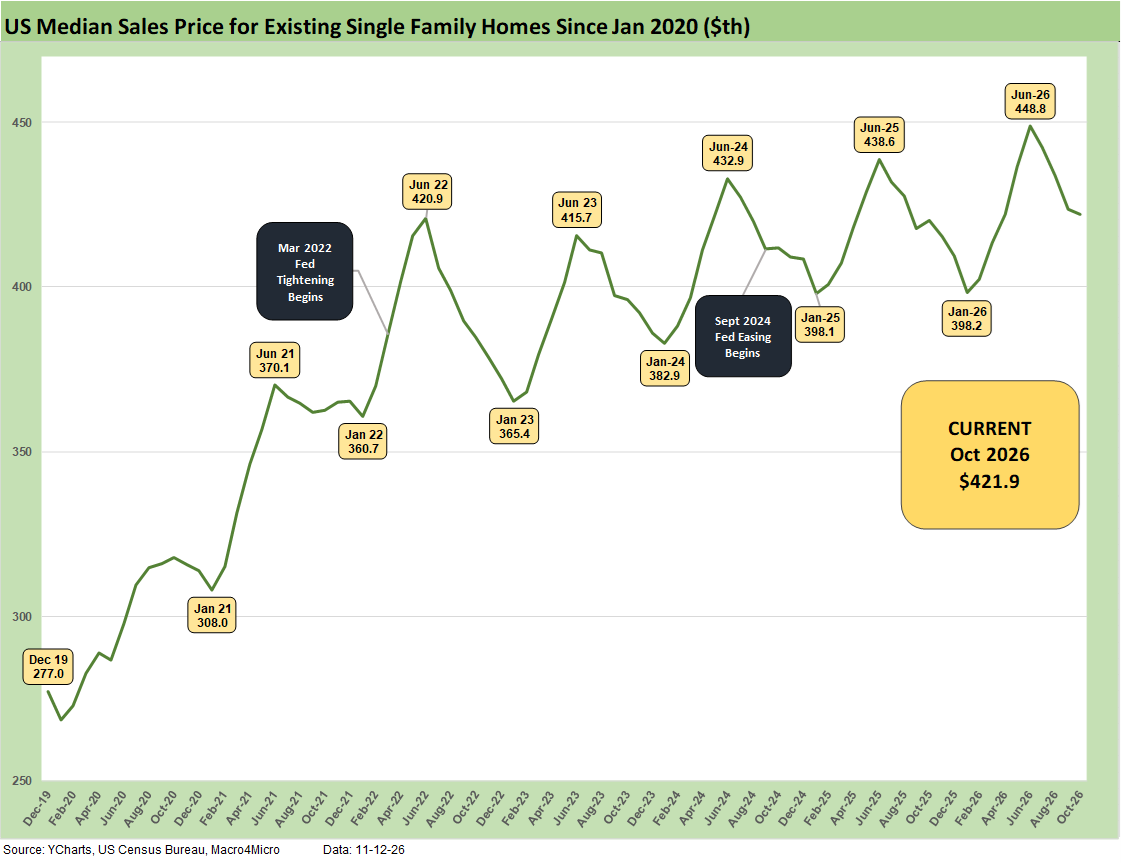
The above chart updates the median price for existing single-family homes at $421.9K (vs. $416.7K for total existing). The median price in Oct 2026 is dramatically above the $308K level back in Jan 2021 and $277K in Dec 2019. Mortgage rates were in a different zip code in Jan 2021 and were below 3%.
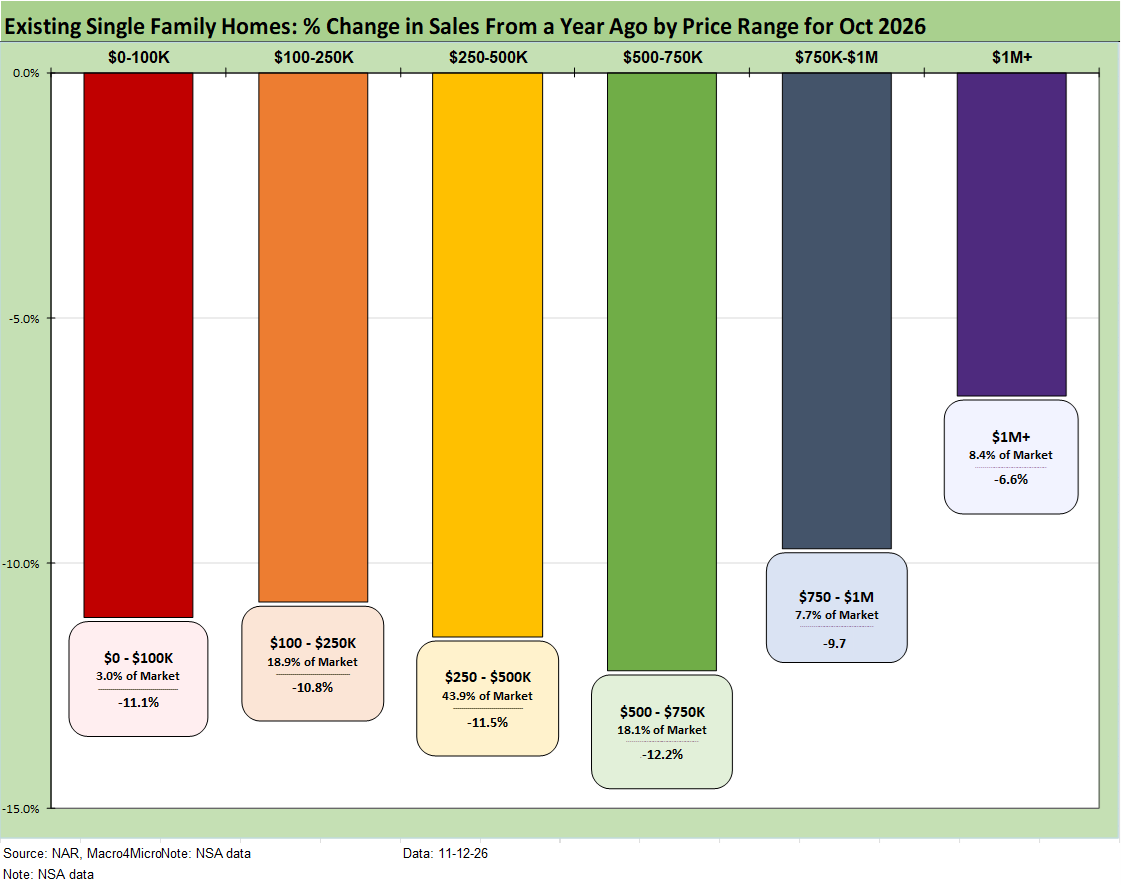
The above chart shows another angle on the sales mix across the price tiers. We just lift the numbers off the monthly handout for single family homes released by the NAR each month. We highlight the double-digit declines in volume across 4 of 6 tiers except the $1 million tier, which was down by -6.6%, and the $750K to $1 million tier, which was down by -9.7%.
Higher price homes and wealthier buyers have had a better time across this cycle, but every price tier is fading now. The “K recovery” certainly applies in housing given the mortgage pressure on monthly payments. The medium tiers and select higher price tiers are starting to show some wear and tear.
The general pattern (better heeled buyers are still in the hunt) has fed the dynamic of homebuilders targeting higher price homes vs. starter homes. Meanwhile, the funding costs of a home purchase (new or existing) are a deterrent to “move-up” sales by existing homeowners facing much higher refinancing costs if they are sitting on 3% and 4% handle mortgages. That remains a major headwind for existing home sales volumes as well as new homebuilding volumes in “move up” homes.