
Iron Mountain: Top 10 BB Tier Bond Issuer, Underrated, Equity Flying High
We update IRM’s strong credit fundamentals for FY 2023 performance as IRM stock rockets ahead of a wide range of benchmarks and industry groups.


Iron Mountain (IRM) is one of those quiet bond issuers that flies under the radar screen despite ranking #7 by face value in the HY index BB tier and in the Top 20 at #16 in the total HY bond index.
The credit profile of IRM is stable in terms of the credit metrics trend lines, but that “stable” assessment needs to be qualified by our view that the company is underrated as a mid/low BB by the agencies since we see business risk, predictability of cash flow, asset protection, and overall financial profile as deserving higher quality ratings.
The favorable fundamental trend line of IRM is seeing more support in the equity markets than from the rating agencies as IRM has been a material outperformer vs. numerous benchmarks and most notably vs. REITs and various business services issuers and industry benchmarks and ETFs from Tech to Industrials.
The ability of IRM equity to so glaringly decouple from REIT and real estate “peers” should have by now earned a fresh look from the rating agencies on how they rate this company as a borrower. Something is clearly working in IRM’s operating and financial performance.
We like IRM as a core BB tier holding and for crossover buyers and BBB tier investors stepping down across the speculative grade divide.
We picked up Iron Mountain some years ago after its transition to REIT status. I wanted to cover it just on the basis it was such a large issuer in the credit markets and was certainly under-researched by the street. I was aware of IRM as a legacy HY name with a big balance sheet, and the transition to REIT status was part of a similar wave across numerous industries. We saw real estate intensive “service” companies (including some large telecom providers) embrace REIT status to reward shareholders with a pass-through structure. “Service” is somewhat of a loaded (and negative) term in IRS regulatory-speak for REITs, but that is in substance what many REITs provide.
We have published some detailed research on IRM on Macro4Micro since our inception including a detailed credit profile (see Iron Mountain: Credit Profile 4-15-23). The main themes since IRM first started the protracted REIT conversion process over 10 years ago revolve around IRM’s sustained ability to grow the asset base, drive higher cash flows, demonstrate very predictable margins, and invest in growth initiatives such as data centers. The objective numbers and performance since then attest to the success of the strategy.
We cover the IRM history in the credit profile launch piece, and the timeline has seen sustained growth on both sides of the balance sheet as well as in cash flow redeployment into data centers and tactical acquisitions. Dividend demands naturally climb every time shares are involved in a deal (e.g. $1.8 bn in equity in the 2016 Recall acquisition), but the deals bring material increases in asset protection and cash flow.
IRM has been heavily about growth capex as evident in the capex programs of recent years, but the acceleration in M&A in 2016-2017 after the conversion also brought in business lines, human capital, and expertise to better arm IRM in targeting areas of growth for deploying free cash flow from high margin legacy business lines. For shareholders and financial strength, the strategy has been quite successful. IRM did not want to be just a dividend stock and was striving for valuation multiple expansion toward the high value end of the peer group in REITs. IRM EV multiples are still below many peers, but IRM is closing the gap.
As a disclosure item, I have owned the stock in the past and sold it in the green as rates rose and the income aspects of the stock were less appealing, and I was getting defensive on income stock market dynamics. I clearly sold IRM too early as the multiple expansion pitch and growth aspects of IRM have been gaining more traction in the market. The buzz around AI and the need for more data center capacity for AI and cloud business needs have been spilling over into IRM market commentary. They outpaced consensus in their leasing activity during 2023 (megawatts target) and could surprise again in 2024. Their new asset lifecycle business (discussed in prior commentaries) also has been promoting optimism.

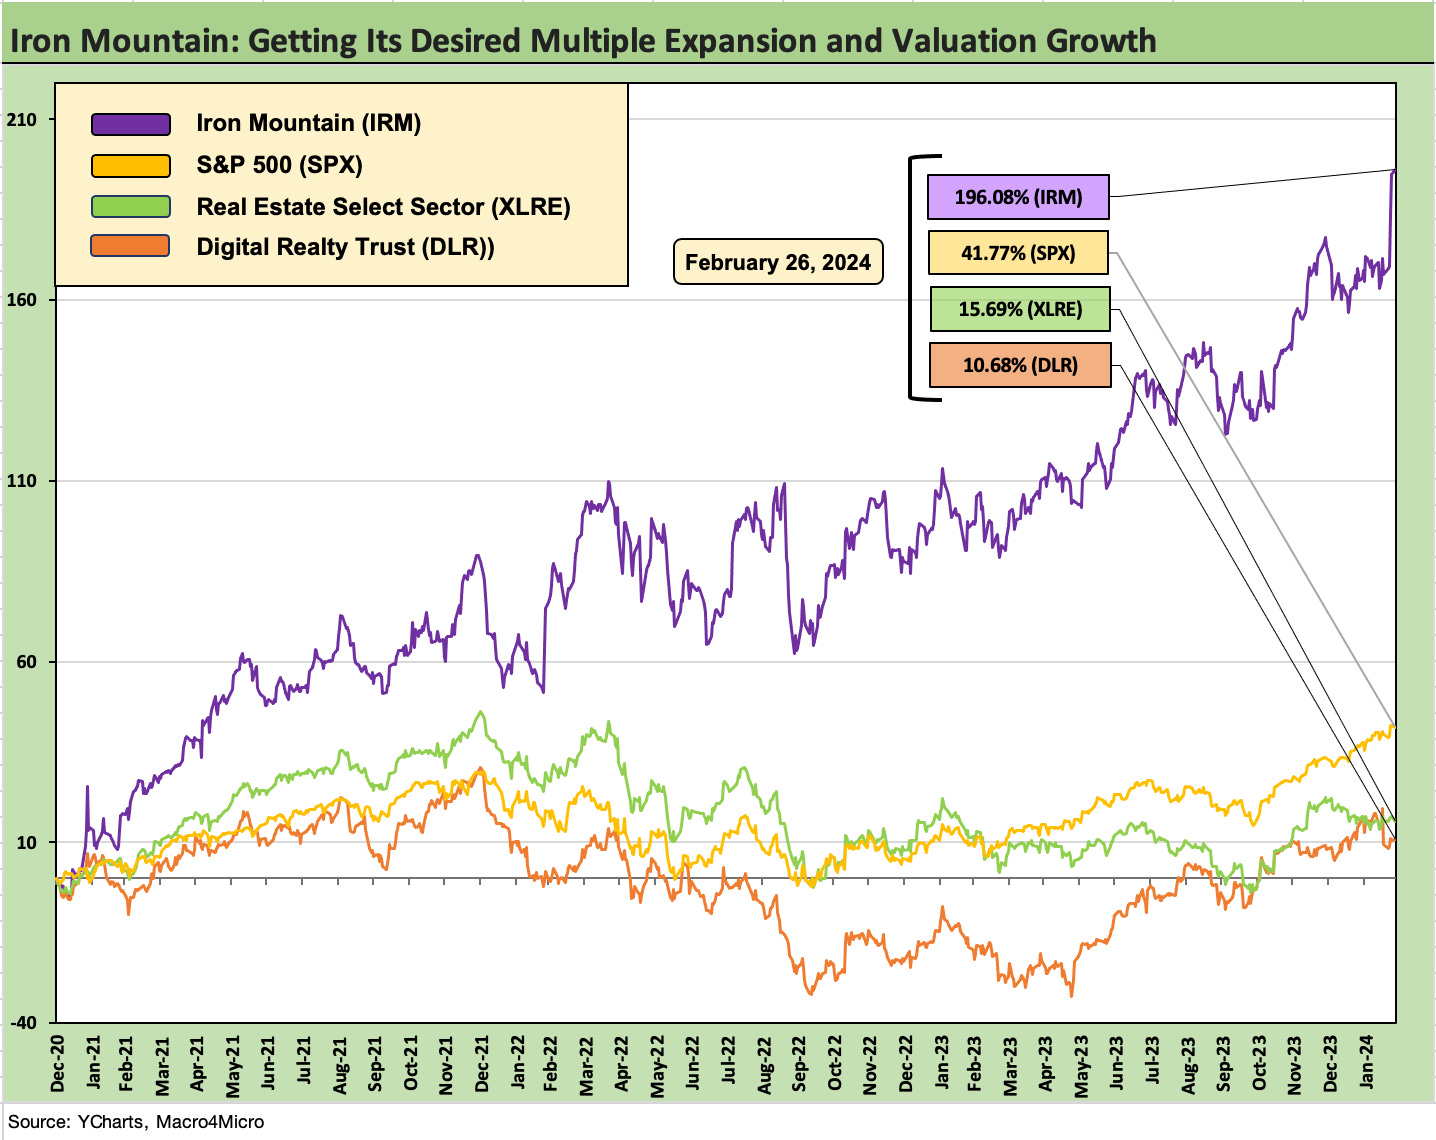
The chart above frames IRM stock in the context of broad market indexes and narrow benchmarks (industry ETFs) as well as a handful of leading REITs (storage and data centers). We also include a few HY market service bellwethers (URI, ARMK, ADT). We line them up in descending order of 1-year total returns. IRM stacks up very well and is positioned at the high end of this broad range of industries and issuers. Some of these companies rank among the best in their space.
As always, IRM is a tough comp in terms of an apples-to-apples mix. We found the 1-year and 6-month performance of IRM equity vs. the Tech ETF (XLK) and Industrials ETF (XLI) notable. That 6-month period includes some wild yield curve swings. IRM clearly crushed the REIT and real estate benchmark ETF (XLRE). IRM vs. Digital Realty (DLR) made for an interesting comparison as well.
The unique (more than just “distinctive”) business mix of IRM across Records and Information Management (“RIM” covers both “paper” and digital information) and Data Centers sometimes leaves the name in the sell-side orphanage. REIT equity analysts are hesitant to pick IRM up in equities, but the company does have some solid business services sector coverage dating back across the pre-REIT years.
Meanwhile, the high margin growth business over in data centers usually sees the data center equity analysts (REITs or otherwise) steer clear since the RIM segment still dominates the business mix. On that note, RIM segment revenues ran in 4Q23 at over 8x IRM’s Data Center segment revenues. The 44.7% RIM segment EBITDA margin underscores that is not a bad thing, but the future growth story still revolves around free cash flow from RIM underwriting a healthy dividend and reinvestment in Data Center expansion.
Solid operating performance and segment consistency…
We update the operating highlights chart below for 4Q23 and full FY 2023 numbers. Rising total revenues in both Storage Rental and Service is a positive sign. Those rising revenues also come with high absolute consolidated EBITDA margins that stay consistent across history. Service revenue has risen each year since the disruptions of COVID sent 2020 revenue materially lower after the stagnant Service top line in 2018-2019. Both lines are at a high in FY 2023 and both higher YoY in 4Q23.
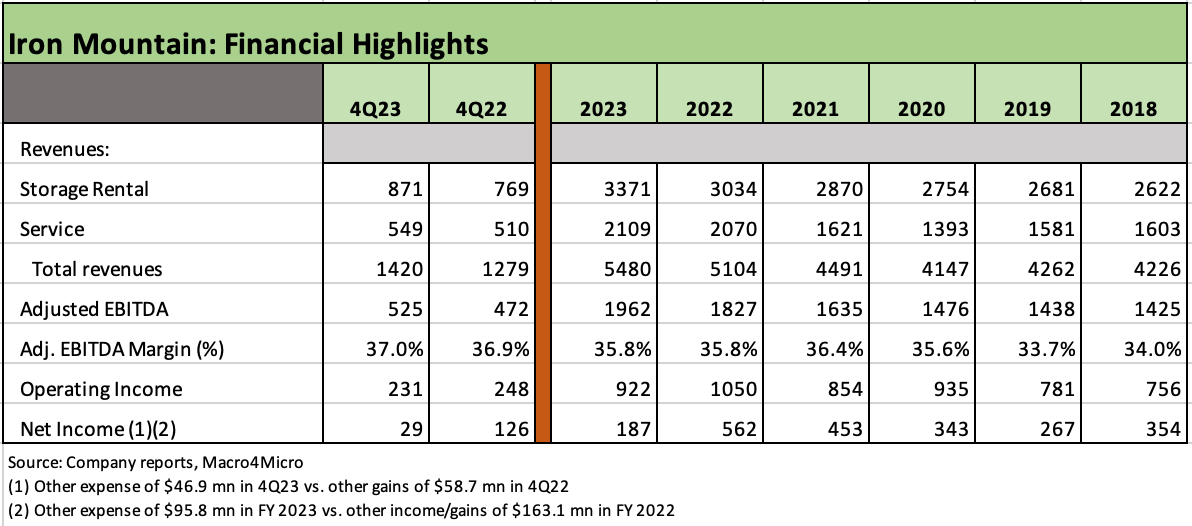
The above chart details the EBITDA margins, but it is worth highlighting that Storage Rental gross margins are closer to 70% at 69.8% for 4Q23 (71.4% in 4Q22) while FY 2023 gross margins came in at 70.3% for FY 2023 vs. 70.9% for FY 2022. Service gross margins were 37.9% for 4Q23 and 36.6% for 4Q22. FY 2023 Service gross margins were 35.1% while FY 2022 was 36.2%. Those are very hefty profit margins that you do not see very often outside the world of tech and software.
Organic growth was +10% in 4Q23 for storage rental revenue growth with pricing a lead driver. The revenue growth of 10% constant currency in 4Q23 was ahead of the +8% for FY 2023 vs. FY 2022. The guidance for FY 2024 called for +11% in revenue at the midpoint, +12% in adjusted EBITDA, and +9% in AFFO, so the growth story continues.
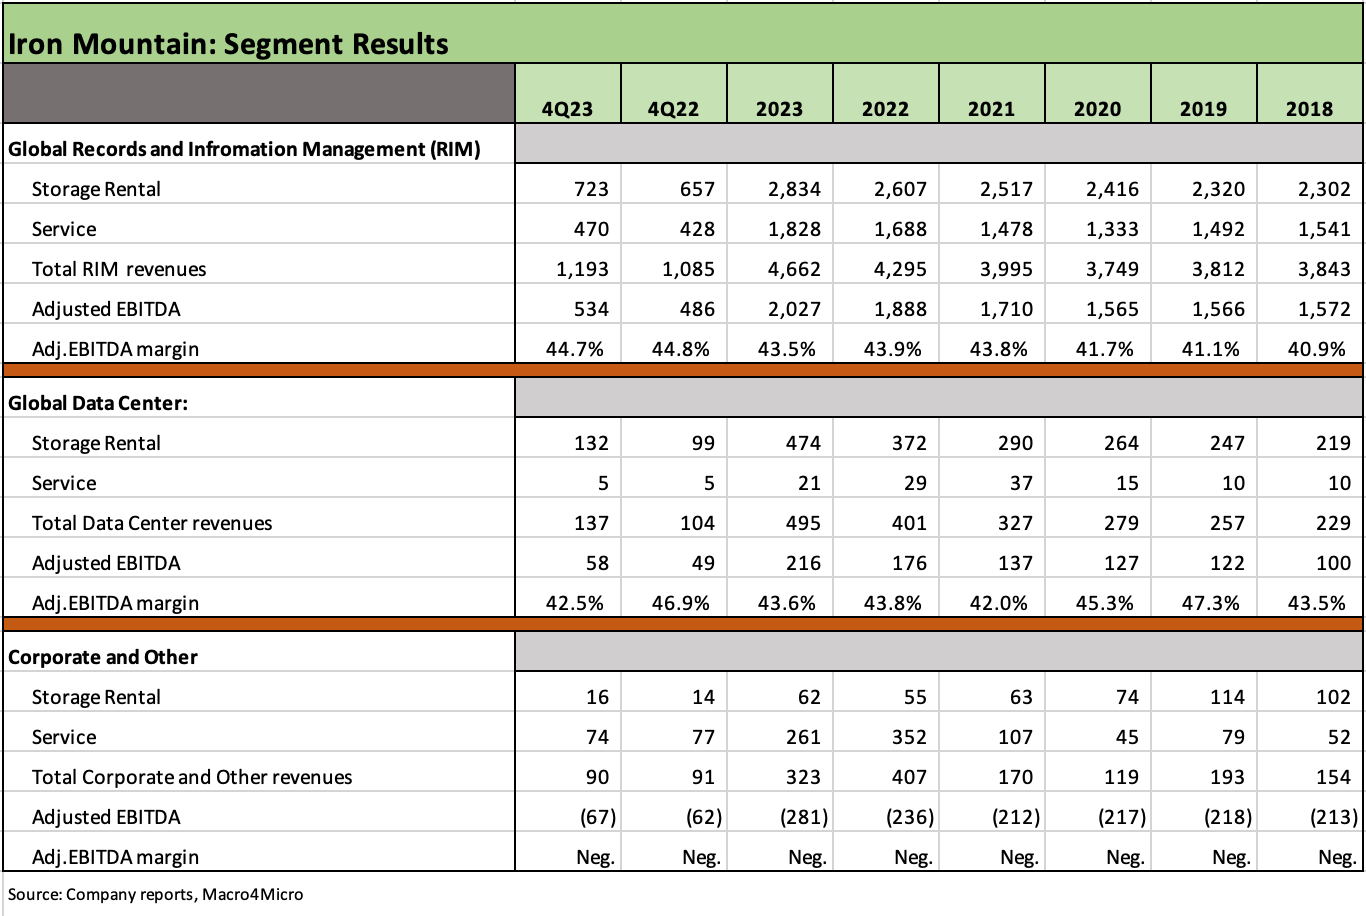
The above chart breaks out segment and revenue profitability and margin trends as RIM and Data Centers just see the top line continuing to grow. The segment margins show higher adjusted EBITDA margins in both major segments flat to higher than 2018 on materially higher revenues. Considering a pandemic, inflation spike, near trade war in 2018-2019, and a massive tightening cycle along the way, that performance tells a story around predictability of earnings and cash flow that makes for a very strong credit.
Steady cash flow and AFFO funding major growth capex expansion…
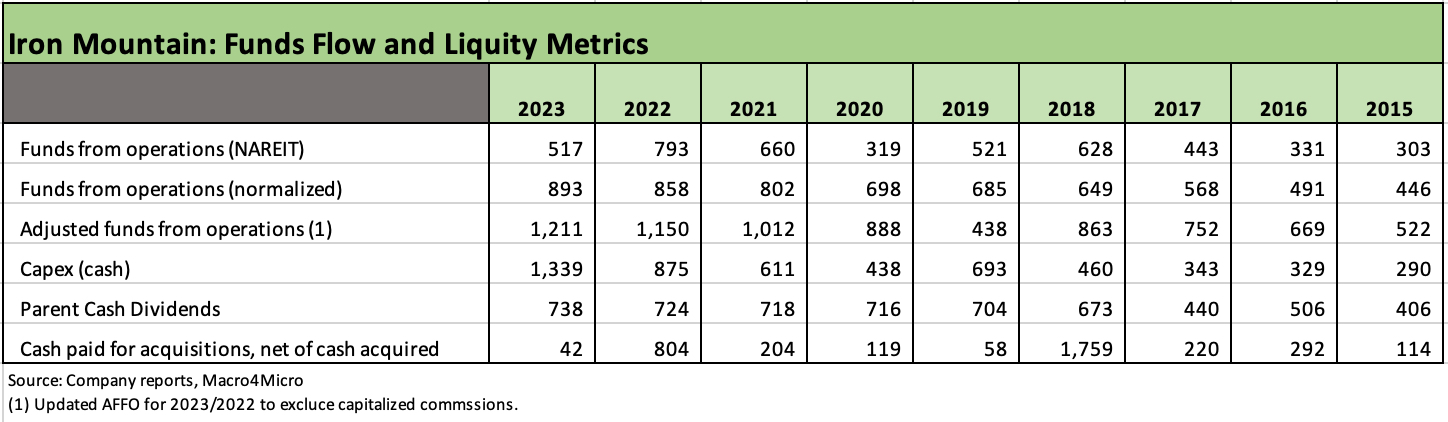
The above chart updates the funds flow, capex and dividend lines for IRM (Note: A dividend payment timing issue distorts the 2015 to 2017 trend line. Each of those years saw dividend hikes). Capex has multiplied 4.6x since 2014 in a sign of the times with IRM’s massive growth initiatives.
The dividend demands also continued to rise and are up by almost double over the same time frame. The fact that leverage is lower over that time frame as detailed further below helps tell a story around how IRM can prudently undertake a capex program of this scale with some tactical and strategic acquisitions along the way.
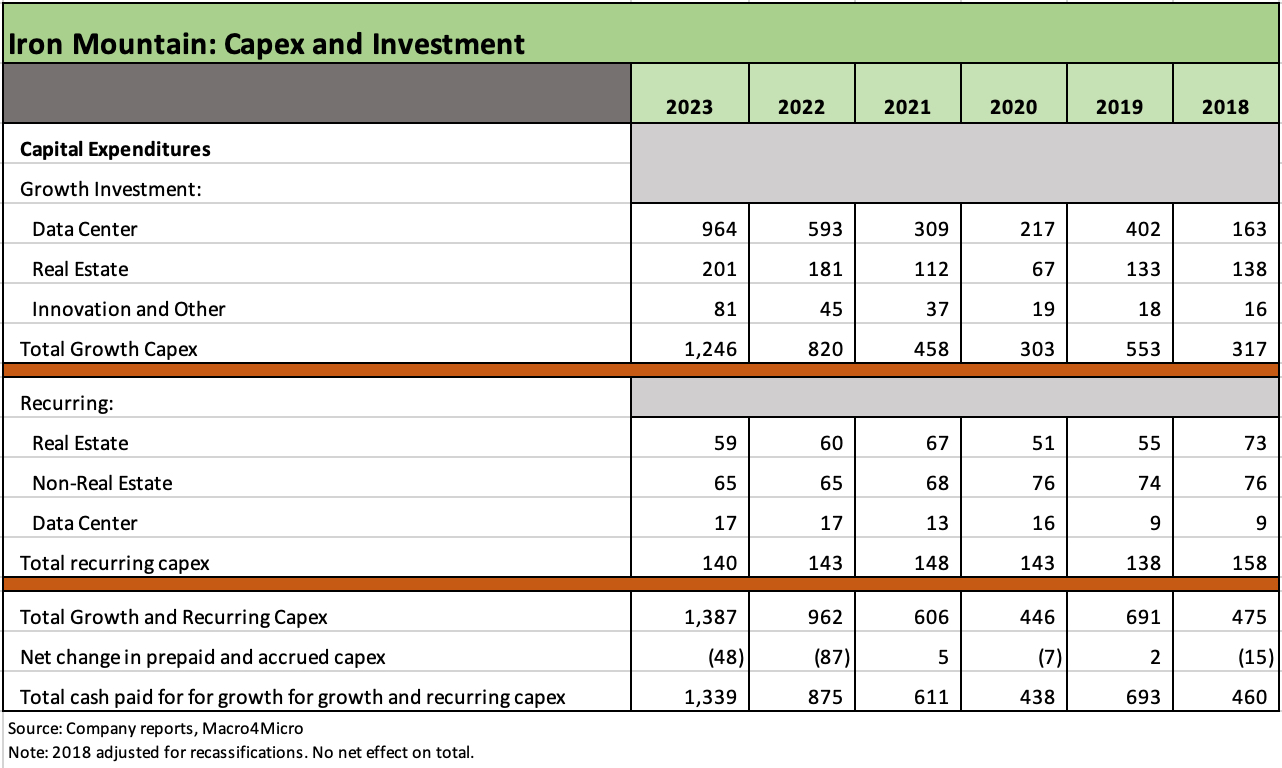
The above chart breaks out the moving parts of capex as we have detailed in earlier reports. This chart brings the line items up to date with the similar theme of high RIM margins driving impressive free cash flow from that segment to reinvest in growth opportunities in the higher margin Data Center unit. Recurring capex needs are low, and the capex budget is about driving higher cash flows and margins in the future as more capacity comes online.
Balance sheet holding in well, leverage around multiyear lows…

The above chart continues the themes discussed in our Credit Profile and Credit Crib Note on IRM. The asset base has multiplied by 2.7 fold since 2014 with PP&E up 2.5 fold. As noted a few charts earlier, adjusted AFFO has also posted a very healthy rise over this time frame. The net lease adjusted debt leverage is still well inside limits at 5.1x, and we would add 5x leverage is more in line with many IG rated REITs.
IRM has always had a busy capital structure across loan layers and bonds and across multiple currencies (and multicurrency options in various bank lines) given IRM’s extensive international presence with sterling (GBP), Aussie dollar (AUD), and Canadian dollars (CAD) on the debt footnote checklist. Those borrowings fit the local currency asset and revenue/expense exposure for IRM’s global operations. They have an extensive array of global lender relationships and an established bond market presence.
Given this history of reliable profit margins and a profitable reinvestment plan with low recurring capex in RIM, the theory should be that this business risk presents less risk for a name such as IRM that has seen its EV multiples rise over this period of expansion into the mid-teens near 16x and is still below many peers. Self-storage REITs carry higher EVs while Data Centers get 20-handles. Industrial REITs are also 20 handles. So how is 5x leverage for this company an issue in its credit ratings?
If you view IRM as a leveraged HY service company at 5-handle leverage, the conclusion is different on bond relative value than if you view IRM as a very high margin RIM and Data Center operation with a clear plan to sustain accretive investment. That plan is now supported by years of execution. We embrace the latter description.
Note: The photo at the top is Clint Eastwood in the Eiger Sanction, which was released in May 1975. At the time, the economy was in the back end of the worst contraction since the Great Depression. Stagflation and contraction were painful, and Arthur Burns (Chairman of the Fed) had his hands full. As he testified before the Senate in May 1975: “During the past two quarters, real gross national product has declined by 5 percent, and the level of industrial production is now 12 ½ percent below last September. This is the steepest decline of economic activity in a long generation.”
That was a tough climb.
See also:
Iron Mountain: Good Climb, Summit Unknown 11-10-23
Credit Crib Note: Iron Mountain (IRM) 11-10-23
Iron Mountain: The Quiet Man 4-16-23
Iron Mountain: Credit Profile 4-15-23