Industrial Production: Ticking in Stereo
Industrial Production is ticking higher as a UST default count is ticking down.
"Debt ceiling proposal delivery...COD or DOA?"
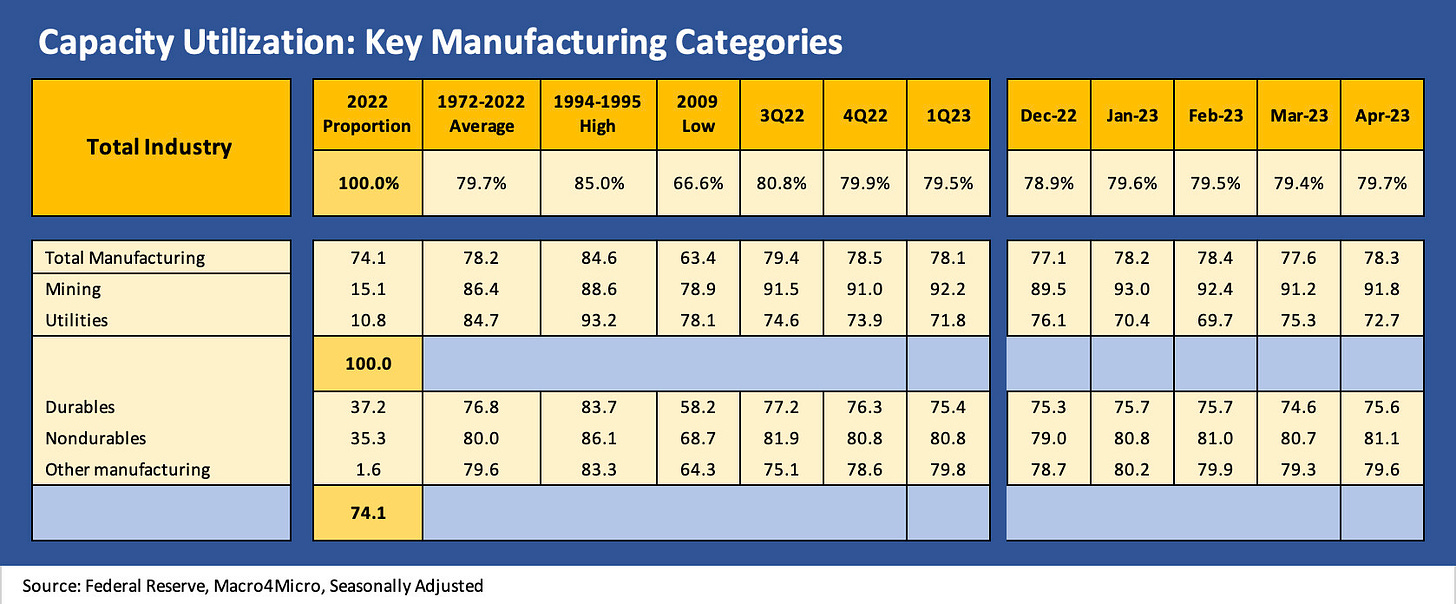
Capacity utilization metrics ticked higher sequentially but are down YoY after a year of interest rate pain and inflation, some lingering supplier chain effects, and elements of confusion around capital budgeting and inventory stocking for 2023.
That other ticking sound is the same one we keep hearing from Washington even if operational managers and customers avert their eyes for now.
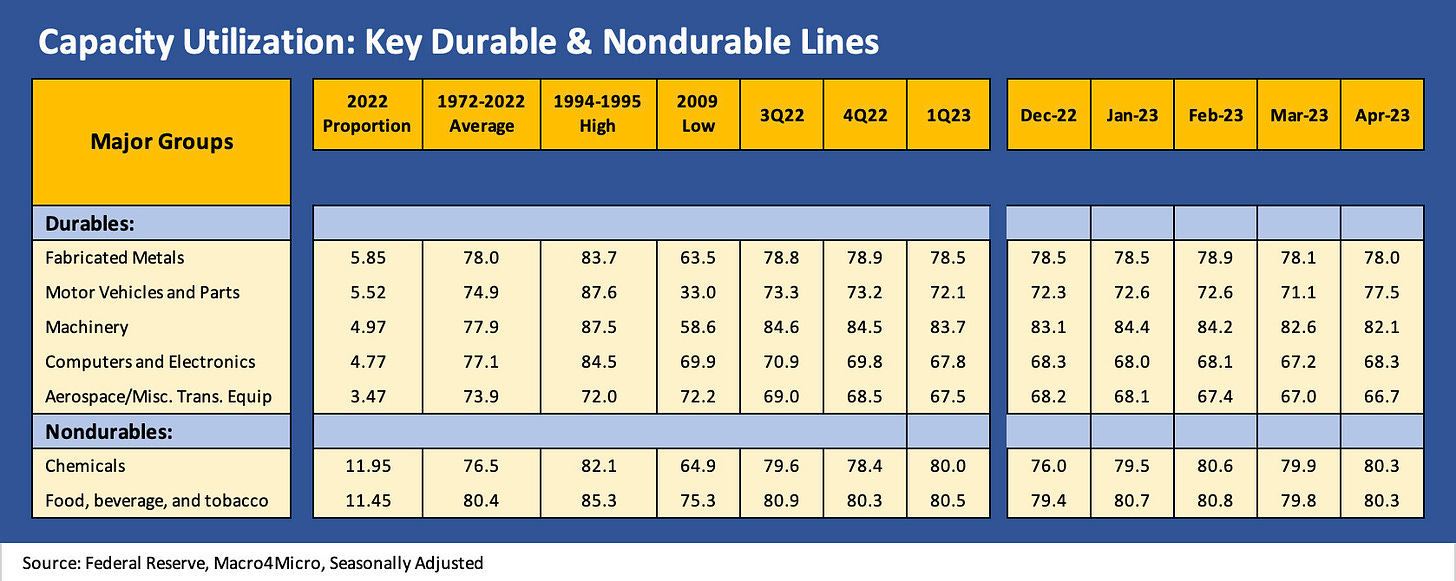
The sharp move higher in Motor Vehicles stands out while Aerospace and Machinery were softer.
The above chart updates the timeline for capacity utilization for Durables and Nondurables. We liked to use the capacity utilization metrics more than the IP Index since capacity utilization (“Cap Ute”) tends to resonate with those looking for signs of pricing power by sector and especially in a market where inflation and PPI are monthly fixations. The relative ability to pass along wage costs, raw material costs, and the supplier chain cost pressures that have been in the manufacturing ecosystem this past year have all been very important factors for either inflation or corporate profitability and profit margins.
We update this chart each month, and the recurring reality is that post-crisis Cap Ute rate median is well below the pre-crisis level. That 79.7% for Total Industry is right in line with the 1972-2022 average, but this current cycle generally sees companies operating with lower breakeven rates after all the restructuring actions and automation strategies since the credit crisis. In other words, the manufacturing sector is generally more profitable even with lower Cap Ute rates this cycle. That is a tribute to unit cost actions during a very hard landing across 2008-2009.
The 1Q23 earnings season overall in manufacturing did not yell contraction even if most signaled weak growth or stability or in many cases the guidance added up to “cyclical peak.” So the manufacturing sector is still in decent shape. We even saw material increases in manufacturing construction this year with so many projects underway in such areas as Electric Vehicles, semiconductors, and various pieces of the reshoring theme (see Construction Spending: Demystifying Nonresidential Mix 5-9-23).
Nondurables shifted higher in April 2023 on upticks in the two largest subsectors of Food, Beverage, and Tobacco and in Chemicals which together comprise over 23% of the Nondurables index. Mining moved up modestly while the volatile Utilities index declined again and remains well below the long-term average.
The above table and the one below always see a lot of revisions each month, and we have those reflected in both. The Total Industry line ticked higher to 79.7% or flat to the long-term average. Similarly, Total Manufacturing moved up to 78.3% and is slightly above the long-term average.
The manufacturing sector is thus hanging tough despite some lingering (though much less pronounced) supplier chain challenges. Durables and Nondurables both rose in Cap Ute, so that is hard to paint as a negative. We see all three categories of manufacturing higher (including “Other”), and the important Durables line with its multiplier effects was up a full point.
We looked at some of the bellwether capital goods, equipment rental, and auto related names in earnings season, and the chatter is not about contraction or lower revenues for many of the reports. The direction of the Fed on the front end is a recurring focus, but the threat of default is hard to plan on when there is work to do and businesses to run. The reaction will come later if the Masters of Disasters in Congress stay true to form. (see Footnotes and Flashbacks: Week Ending May 12, 2023 for more on the UST default questions).
The above table gets more into the weeds of the major line items in Durables and Nondurables. The Motor Vehicles subsector was the biggest part of the story, but the Industrial Production index ex-Motor Vehicles and Parts was also higher (disclosed in the “Special Aggregates” section of the IP release). The ex-Motor Vehicles index saw Consumer Goods, Construction Supplies, Business Equipment, and Materials all ticking higher. We can’t get too excited even with those positive indicators since 3 of the 5 largest Durables subsectors in the chart above were lower. Motor Vehicles and Parts were just much higher while Computers and Electronics were up.


