Fixed Investment: Some Structure and Equipment Layers
We look at the next GDP fixed investment layers for Structures and Equipment.
"Structures and equipment...it gets complicated."
We follow up on the moving parts of the GDP accounts and look under the hood of Nonresidential Structures and Nonresidential Equipment to highlight the mix of subsectors and categories.
The focal points for those worried about pockets of financial stress in commercial real estate will be threats of default and valuation pressure that impairs the ability to refinance obligations in a higher rate environment.
In a different focus, those worried about economic growth will be trying to frame how financial market stress will impact new spending and take a toll on the more volatile and cyclical fixed asset investment lines such as Nonresidential Structures and Nonresidential Equipment.
The next leg of the journey for the fixed investment lines of GDP…
With waves of headlines on asset classes such as Commercial Real Estate and the ties to financial asset and banking system health, we are trying to demystify some of these broader buckets to weigh economic growth risks by looking at mix and some histories. There are clearly some broad categories in the crisis crosshairs such as Office properties, and there is no shortage of massive loan books and CMBS for bears to trash talk and for short mongers to do what they do (i.e., short and trash talk).
There will be more rather than less headline volatility to come given the overlap with the regional bank stress that is refusing to go away. What started as a fear of “push-button deposit flight” has now morphed into a daily replay in the financial media (cable and otherwise) of what can go wrong on the asset quality side. That will draw a lot of attention to a lot of problems ahead on loan books and in the areas of securitized products.
A hefty amount of analytical horsepower in the real estate space and structured credit disciplines will be very busy addressing these issues, looking for opportunities and figuring out where the land mines are. That same is true for bank analysis in the search for useful disclosure in a sector known for blurry, aggregated data that often obscures the real pockets of trouble.
The commercial real estate credit risk is not the purpose of this note. Instead, we are drilling into the next layers of Fixed Investment lines of GDP classified as “Nonresidential Structures” and “Nonresidential Equipment” to consider where there might be more contraction risk or sustained growth prospects. Every line item has a story to consider. Nonresidential Structures tallies around 2.7% of GDP and Equipment 5.1%, so these lines add up. As another frame of reference, Residential investment is almost 3.9% of 1Q23 GDP.
The multiplier effects from these lines in the employment and services, materials, and finance chain are very important economic variables that turbocharge the importance of the structure and equipment lines. The flip side is that weakness in these asset classes on valuation and high leverage set against those assets can come back to bite credit quality and lead to defaults and restructurings.
The effect of more credit stress translates into dimming risk appetites and tighter exposure limits in these areas. That can in turn slow growth under the heading of credit contraction (and risk retrenchment). That can mean more costly credit pricing or defensive structures for borrowers that raise the bar. Some portion of projects might not get beyond the planning stages or get shelved for friendlier times.
The above chart plots the annual changes in Nonresidential Structures and Equipment back across the cycles. We start the timeline from just before the 1973 recession when the post-Vietnam inflation was underway and the oil embargo and a wide range of tectonic government policy actions set off many structural changes in the economy (see Inflation: Events ‘R’ Us Timeline 10-6-22). The time series hammers home how cyclical these line items can be on the downside and upside. The cyclical worry is that a fresh wave of setbacks could emanate from a number of major real estate classes while some others see secular expansion.
As we covered in the commentary on the monthly construction data release the past week (see Construction Spending: Demystifying Nonresidential Mix 5-9-23), the moving parts show a lot of investment strength in some major categories that will have legs in 2023 while some legacy assets will be caught in year of hell that will undermine risk appetites and lead to substantial losses for lenders.
For the opportunistic, that means a market with eroding liquidity will lead to some attractively priced opportunities in real estate assets (equity or credit) needing financing in a market with a new UST curve that looks nothing like the one they have seen since the credit crisis from 2009 to early 2022.
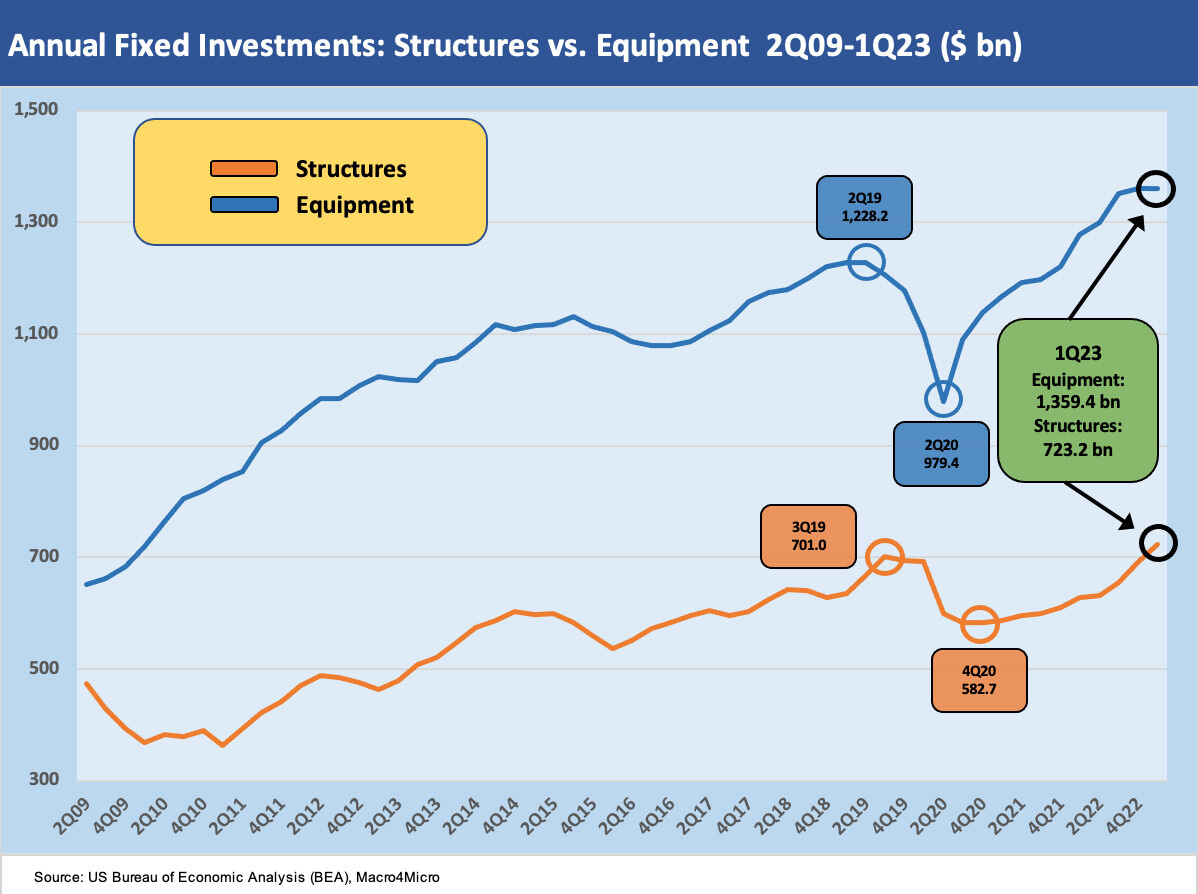
The above chart shortens up the time horizon with a starting point at the 2Q09 trough and then plots quarterly numbers of the fixed asset GDP accounts through 1Q23. The numbers show the 2019 peaks in these line items as the economy was starting to weaken. During 2019, the Fed came to the rescue with some easing in what was a great year for risk assets but a faltering year for the economy even before COVID.
Then COVID drove a macro swoon as so much economic activity hit the brakes. The worry with the 1Q23 numbers is that structures and equipment show a rough history and are notorious for being wildly cyclical as noted in the earlier chart. The half-full side of the current story line is that there are a range of attractive growth areas as we discussed in our GDP comments (see GDP 1Q23: Devils and Details 4-27-23) and Construction note (see Construction Spending: Demystifying Nonresidential Mix 5-9-23).
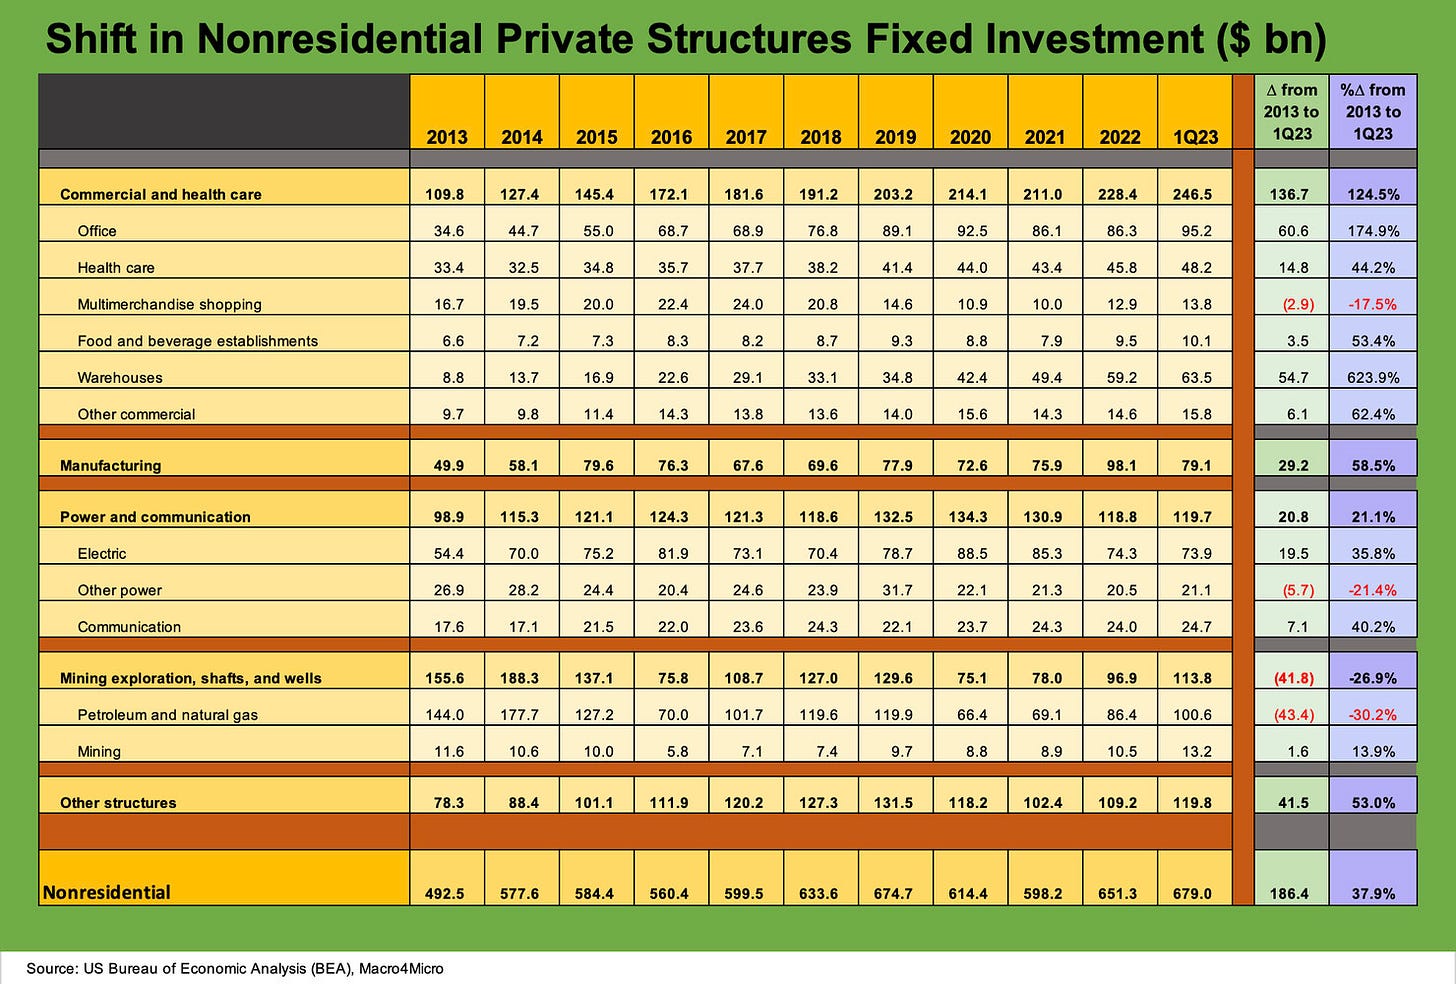
The above chart breaks out the line items the old-fashioned way in a table of numbers. We post the annual timeline from 2013 to 2022 with the 1Q23 SAAR number posted at the end. As a reminder, 2013 was the year of the taper tantrum and was the best year of the decade for the S&P 500. 2013 was a booming year for credit risk demand in the B and CCC tier on the way to the cyclical lows for US HY spreads in June 2014. The market was still in ZIRP mode (ended Dec 2015) as the slow and steady recovery in employment was still underway and the Fed took action that encouraged extension out the curve and risk taking.
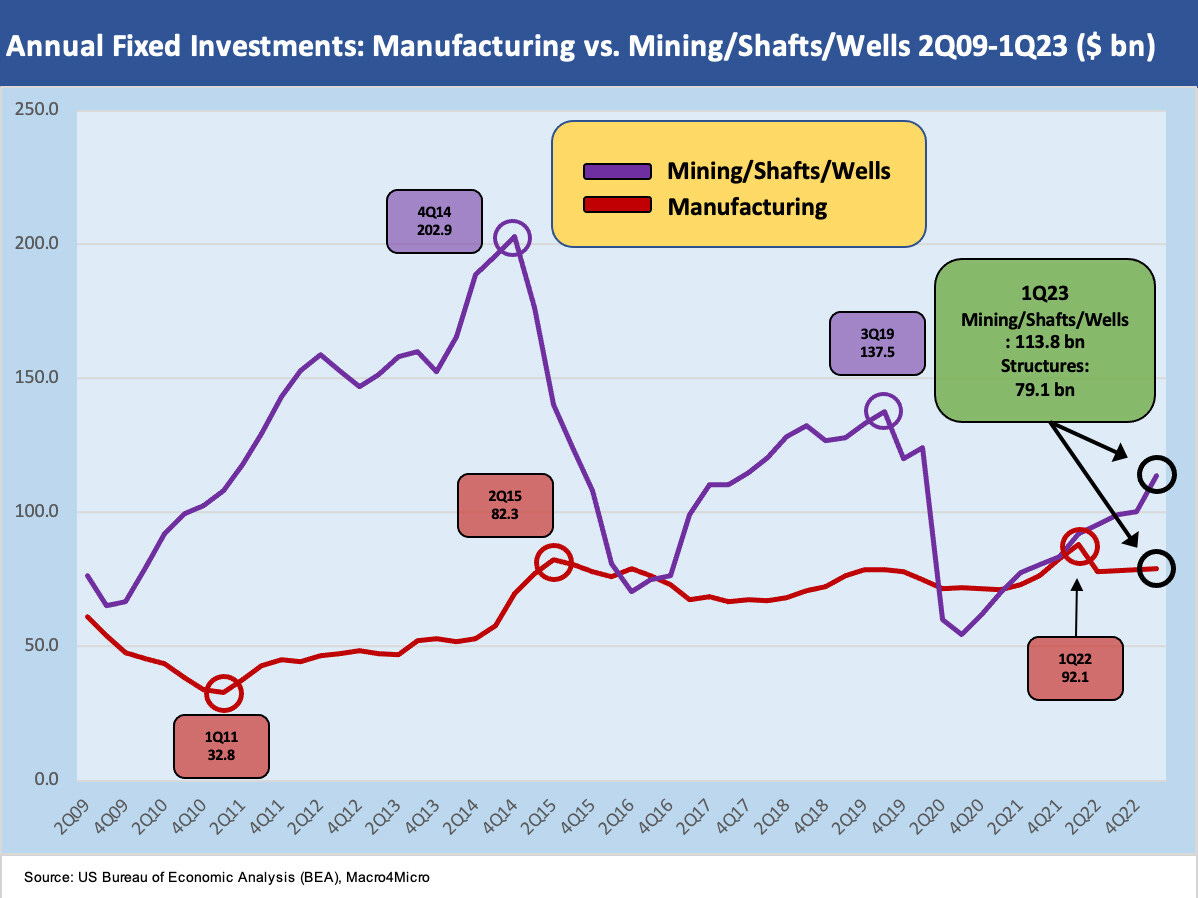
The growth in the total investment in Nonresidential Structures was +37.9% from 2013 to 1Q23 SAAR. That comes with a wide range in the numbers from the +624% in Warehouses down to the -27% in Mining Exploration, Shafts, and Wells. We plot that energy-related time series against Manufacturing in the next chart, and it brings a reminder of what an extraordinary ride it has been on the journey of the US to become the #1 producer in the world of crude oil and liquids and #1 in total crude oil, liquids and natural gas on a BOE basis.
Where that energy-related line travels to from here is part of a big policy clash in Washington. We would expect the energy structure line holds considerable upside even if not in 2023 with some major climate friendly projects (carbon capture, hydrogen, LNG, etc.) categorized in there somewhere along the way and with some rolling into other categories such as Power. The potential need to supply Europe after the Ukraine-Russia geopolitics is an obvious topic. The potential for material expansion of crude oil, refined products, and LNG exports will be a pivotal economic growth opportunity for the structures and equipment line but also a battleground in US politics.
Commercial and Health Care rolls up in the nonresidential structure mix as the #1 category. From 2013 to 1Q23 SAAR, there was an increase of over 124% with the Office category at +175% and a +$61 bn increase, just ahead of Warehouses at +$55 bn and that category’s 624% increase from 2013. Warehouses is one of those lines that seems to move around depending on what Census and BEA subset you look at. ZIRP and a low UST curve can generate a lot of activity.
Warehouses tie into numerous subsectors including Retail and Manufacturing as well as Freight and Logistics. We are still trying to get our arms around where some of these indicators reclassify categories of spending. That is especially the case for Manufacturing spending in construction releases vs. fixed asset investment in the GDP accounts. Warehouses are a bit murky across commercial real estate vs. manufacturing in different releases. It is intuitive that a return of the supplier chain (even if just in part) will drive a lot of growth in manufacturing structures and warehouses alike.
The above chart posts up what is essentially a proxy for oil and gas sector investment against Manufacturing. It is more as a show-and-tell on how wild the swings have been in the oil and gas patch.
We expect Manufacturing to show sustained growth in coming years or this country will have bigger problems if China relations keep getting worse (most likely). The global supplier chain phenomenon across the past three decades will now start to reverse slowly but steadily and the biggest debate being how much will be onshored vs. “near-shored” (Mexico, Canada) or “friend-shored” (who the US “friends” might be might vary by party and administration).
In the case of Mexico, low-cost labor is the edge in a trade zone alliance (we hesitate to use the word “free” in trade agreement). In the case of Canada, its natural resource strengths can be a major factor that are now underutilized vs. potential. Canada-US energy trade is one more in the political battleground around carbon and pipelines. The evolution of the Electric Vehicle sector and battery production is a major growth area that triggers trade sensitivities. That will be a significant area of expansion, as well as trade tension given domestic content requirements.
For our last table on the layers under the GDP line items, we break out the categories of Nonresidential Equipment spending by broad sector. The increase since 2013 is almost a one third increase to over $1359 bn. As a reminder, that $1359 billion ties out the Nonresidential Equipment line of the 1Q23 advance GDP release (Line 30 of Table 3). As we indicated at the top, we are just following the trail and looking at the mix underneath the lead numbers.
Most would not likely have guessed the biggest increase would be in Industrial Equipment as we break out in the chart. Since 2013, Industrial Equipment was up by over 54% (+$114 bn) to $324 bn. That mix of product groups offers a reminder of why companies such as United Rentals are doing so well.
The major role of information and processing equipment would have been an easier guess for leadership in total dollars even if it was not #1 in growth. This group includes medical equipment and instruments, and that has benefitted from a number of tailwinds from demographics to expanded healthcare investment globally.
Within transportation equipment, there are some major crosscurrents that make this a tough call. The transition to EV calls for a lot of investment, but the EV gain is also the ICE pain. The role of Mexico in the manufacturing process has been a well-established theme (that investment is in part not on the US GDP books). We also see the aircraft numbers during a time when Boeing has no shortage of challenges behind and ahead.
The idea of bringing back the offshore (read China) supplier chain to the US from semis to OE suppliers (Tier 1, 2, and 3) are bouncing around in rankings on the “big theme” list. That would appear to be a geopolitical and corporate risk necessity for private sector players. As we detailed in the construction commentary (see Construction Spending: Demystifying Nonresidential Mix 5-9-23), there are considerable funds pouring into manufacturing construction. That type of investment growth in US manufacturing has multiyear tailwinds and will be a big topic in the 2024 election policy debates.
These tables and charts above are food for thought as the changes in 2023 creep along in monthly and quarterly releases. We hope the trend line analysis is not interrupted by a downgrade of the US to a default junk rating since that would inevitably wreak havoc on order books and capex planning.


