
Footnotes & Flashbacks: State of Yields 11-5-23
A major bull UST flattener and credit spread contraction allowed yields to be a positive factor for a change.


The UST rally brought optimism to equities and tag-teamed with credit spreads to pull the HY index down under the 9% line (ICE).
Rate-sensitive equities got very excited across builders, banks, real estate, and utilities, but the balancing act across the economy and UST curve prospects still will turn on inflation metrics with the economic outlook not yet signaling a recession risk flavor.
The FOMC faces a high degree of difficulty to score a low growth market with low inflation heading toward 2% while still staring at record payrolls and lingering signs of labor pricing power despite the tepid job adds to end the week.
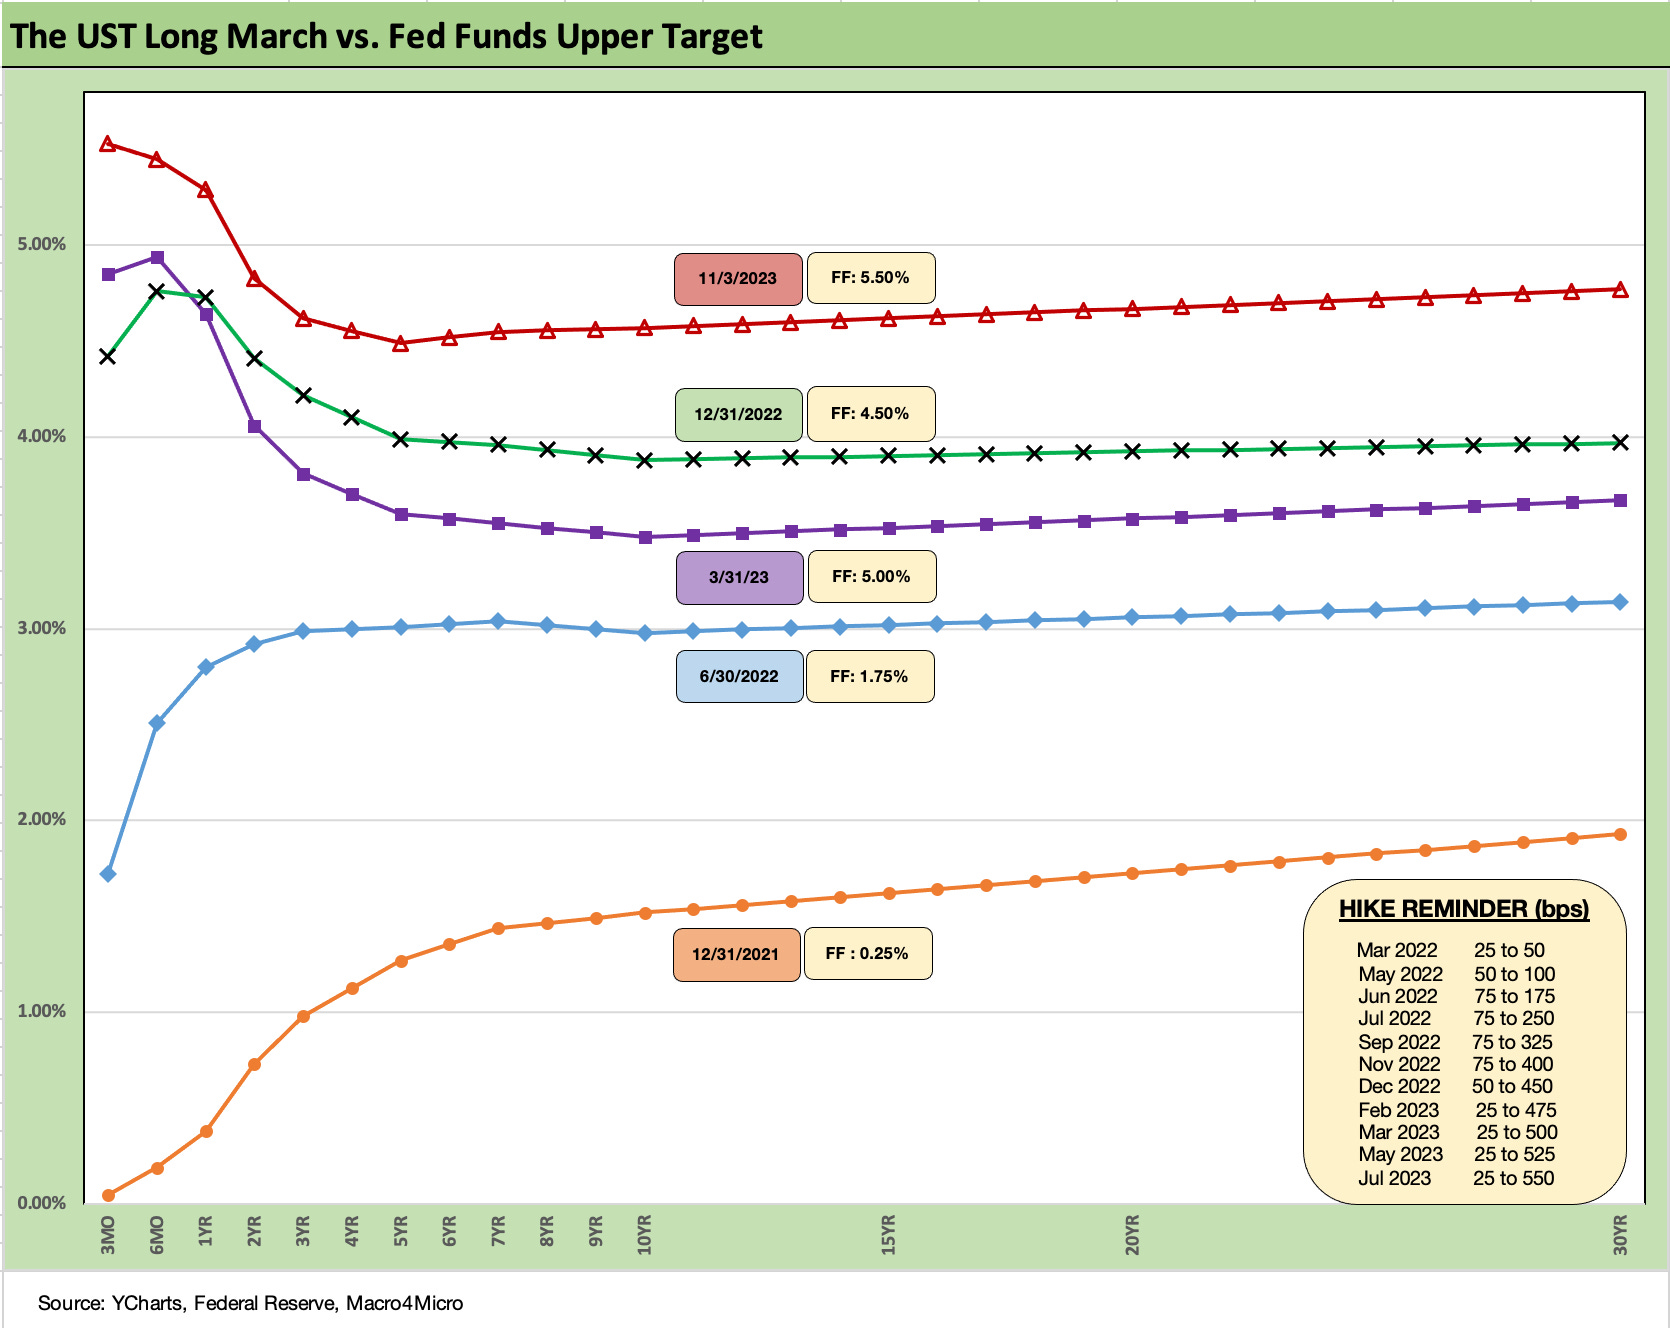
The above chart is somewhat of a buzzkill for those celebrating the UST bull flattener of the past week as we are still a very long way from even 1Q23 after the first post 4Q22 curve rally and downshift. To wind down the 1Q23 period, the curve saw a more pronounced inversion following the regional bank noise as the UST shifted lower and the Fed kept tightening.
The challenge remains that the Fed is anchored on the front end until it sees more steady tangible progress on inflation. There is every reason to expect progress in shelter inflation, but a steady economy will have a hard time relieving services inflation or wage pressures. The recent oil price weakness seems like a wildcard since the theory was that more geopolitical stress would take that the other way.
The UST curve bet with an inversion in a solid economy (if it stays solid) means the return to steepening will linger as a risk. The news on jobs last week helped the risk mood, but now it is back to the CPI and PCE waiting game. CPI, PPI, Retail Sales, and Industrial Production are more than a week away.
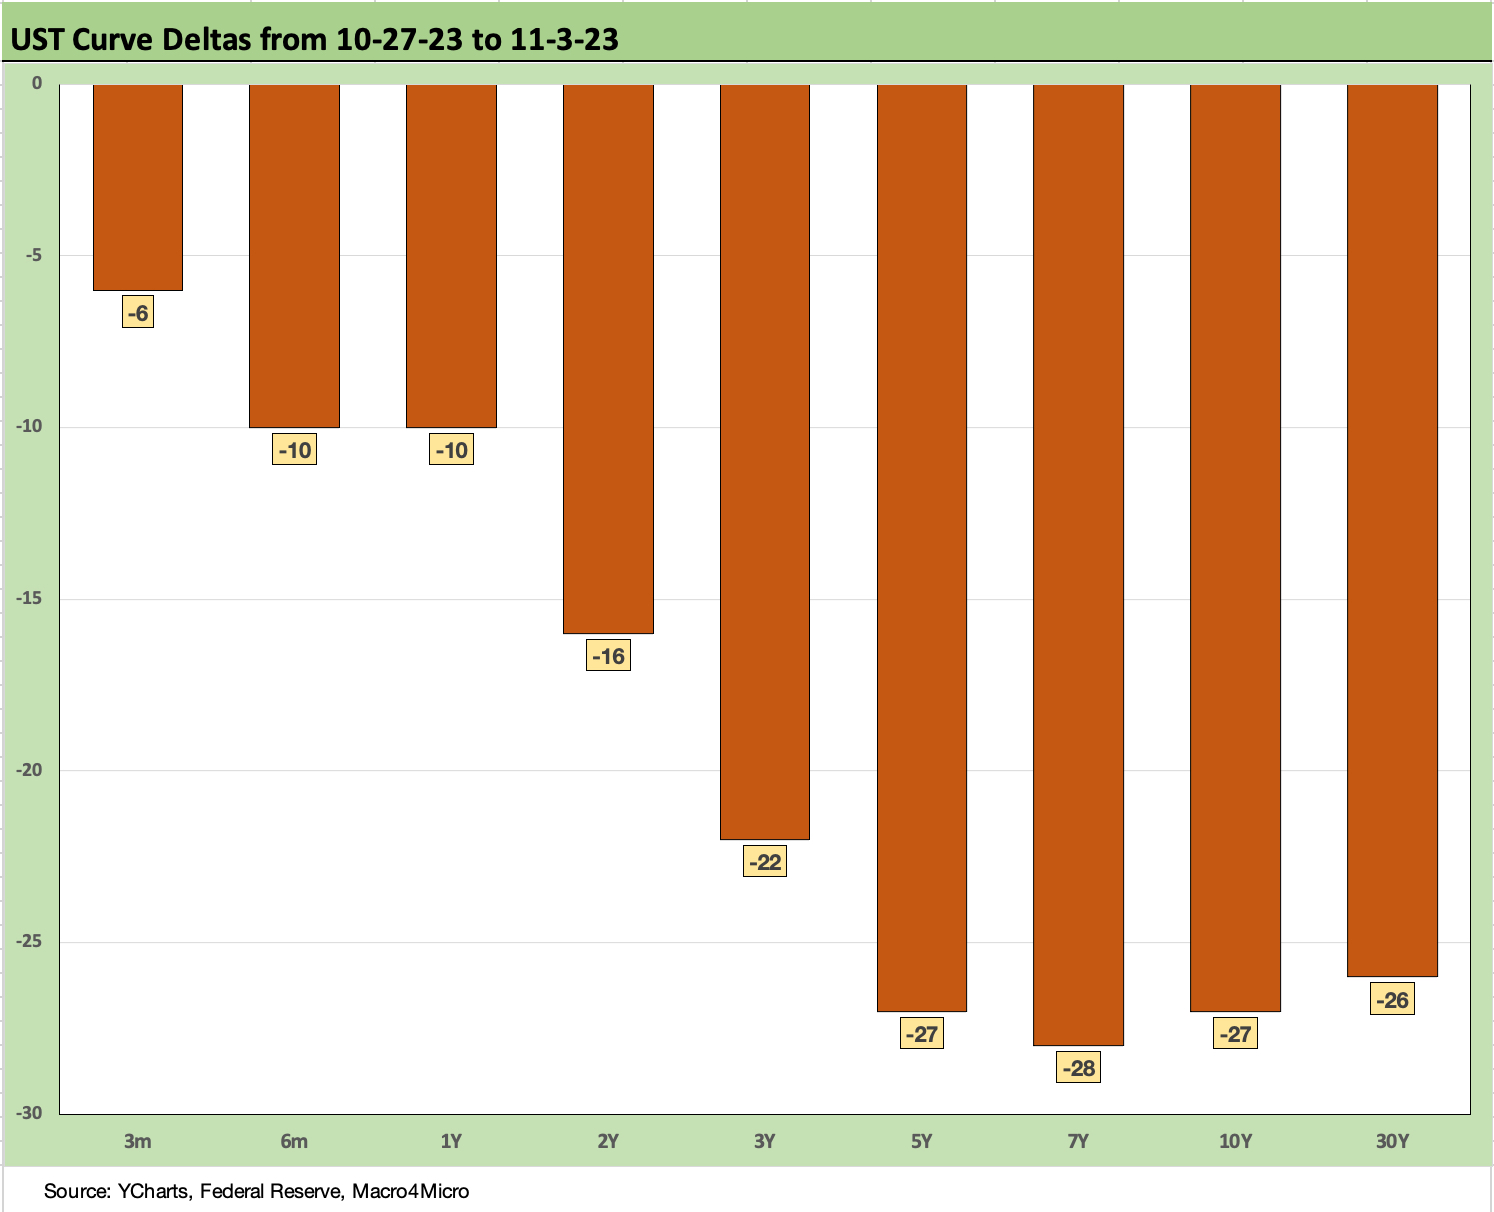
The above chart breaks out the UST deltas this past week, and there is not much mystery around what it meant for duration as the fixed income benchmarks rallied and turned in solid numbers. We look at the curve and tighter spread impact in the related Footnotes publication for asset returns (see Footnotes & Flashbacks: Asset Returns 11-5-23).
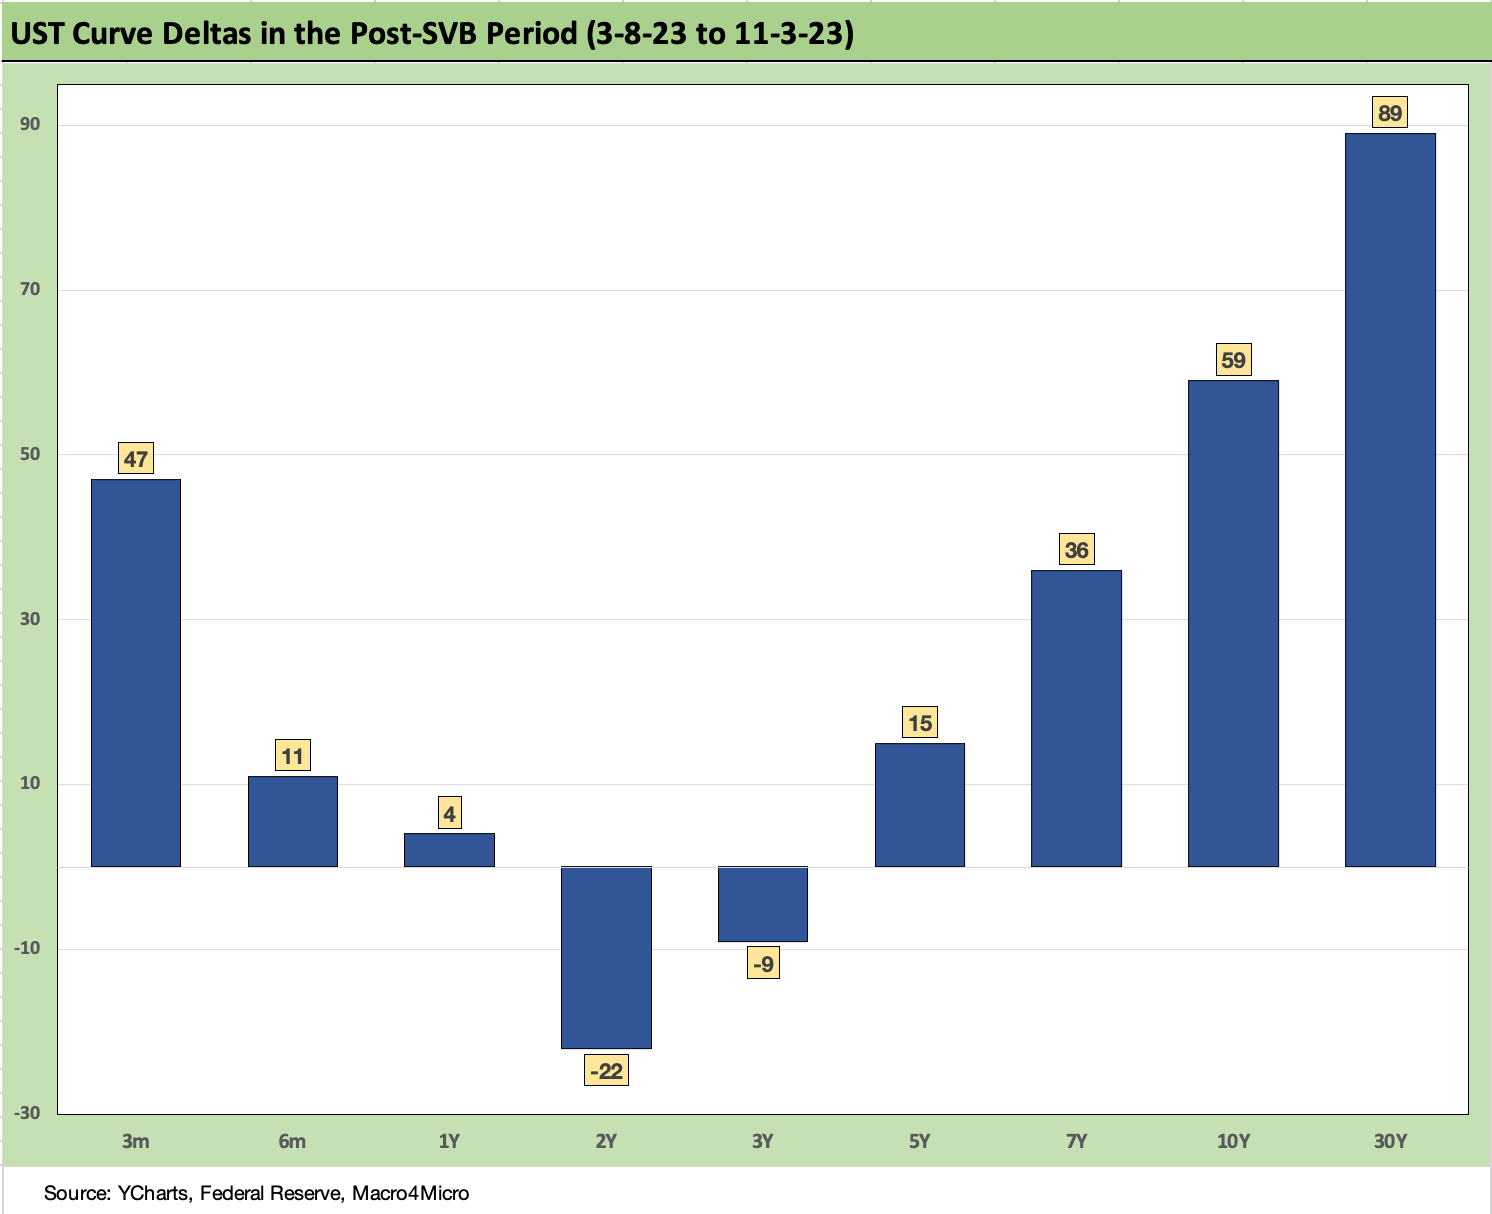
The above chart updates the post-SVB UST curve deltas. We start at 3-8-23 for the last clean trading day before SVB started to unravel and blew up on March 10 and was seized by Friday with the regional bank panic escalating. After this past week’s close, we see the 2Y UST lower along with the 3Y, but the rest of the curve from 5Y to 30Y shows a clear bear steepener.
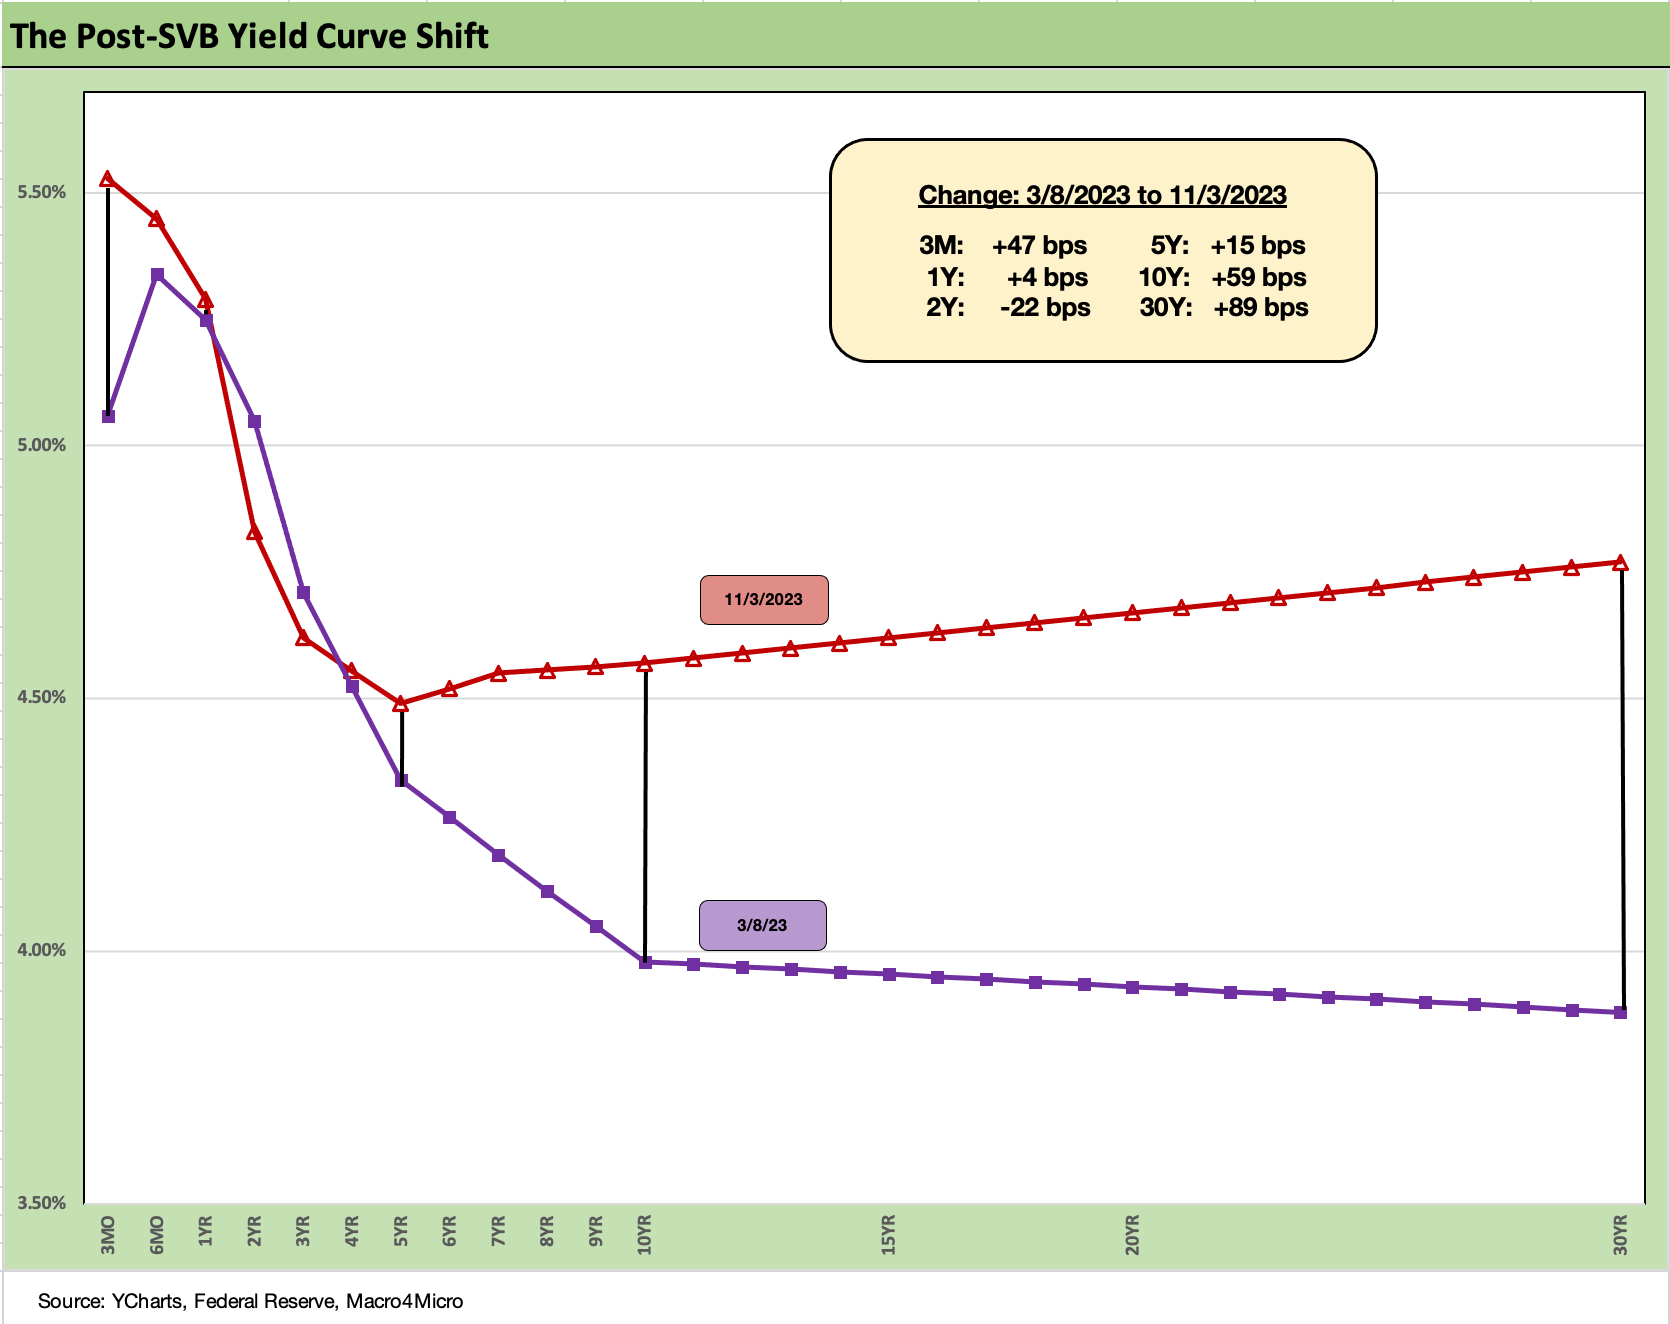
The above chart puts a yield curve format in place for a different visual on the prior chart’s post-SVB curve deltas. The steepener from 5Y to 30Y is clear enough, but a big question is how the 3M to 5Y will reshape and when. The question is natural around what the risk will be in the meantime for term premiums and a more rational move of the UST curve to flatter - and thus the duration risk revisited.
If fundamentals deteriorate and support the lower UST curve shift, we then need to shift into framing the threats to credit spreads. The UST curve cannot just move around in a vacuum. The market got a week off from anxiety on steepening.
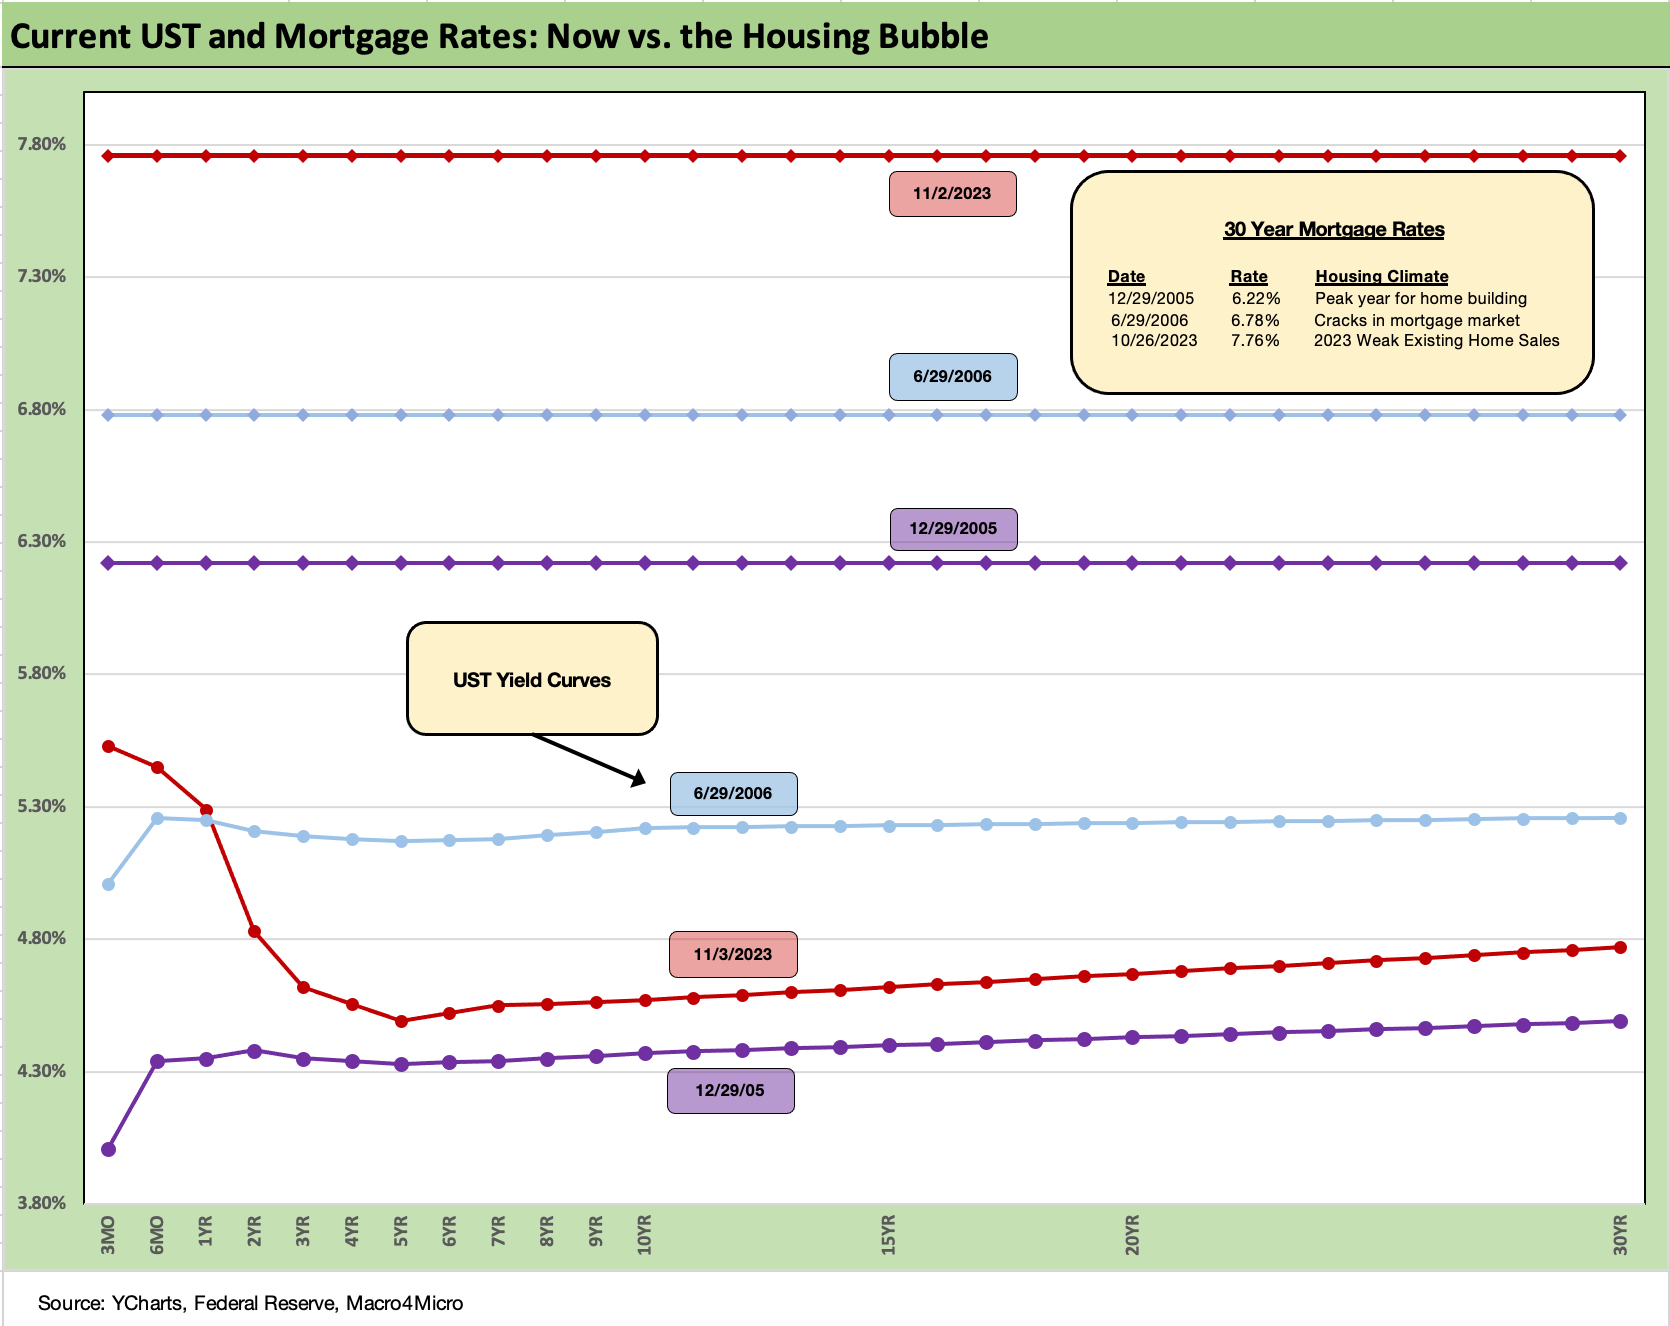
The above chart updates the 30Y Freddie Mac mortgage benchmark and the current UST curve. We also drop in the UST curves and Freddie mortgage levels for two periods from the housing boom and bubble. We include the year end 2005 as the peak homebuilding year and the middle of 2006 when the “liar loan” phenomenon and subprime excess was cresting.
In 2006, subprime was starting to show some cracks but not yet sending the credit markets into a case of nerves. That would take more quarters to go by. Even then, equities only folded later in the fall of 2007 before the onset of a recession in Dec 2007 (that “official” NBER date for recession was set much later).
It is notable that the current UST curve is now well above the end of 2005 in 10Y UST but below the intermediate and long end of the UST curve seen in mid-2006. Despite that UST configuration, the 30Y mortgage levels of 2023 are well above 2006 and were pulling away before this latest rally.
The actual levels across a wider expanse of mortgages and fee structures had hit 8% the prior week (see Sept Existing Home Sales: The 7% Solution Running Low 10-19-23) but this past week the Freddie Mac 30Y benchmark only eased slightly by the benchmark release date to 7.76% from 7.79% before the wild finish to the week.
By the end of the week (11-3-23), the mortgage trade rags were indicating mortgage rates down under 7.5% while some cited 7.3% area (and even lower subject to fees). The Builder ETF was among the better performers along with a range of other interest rate sensitive groups.
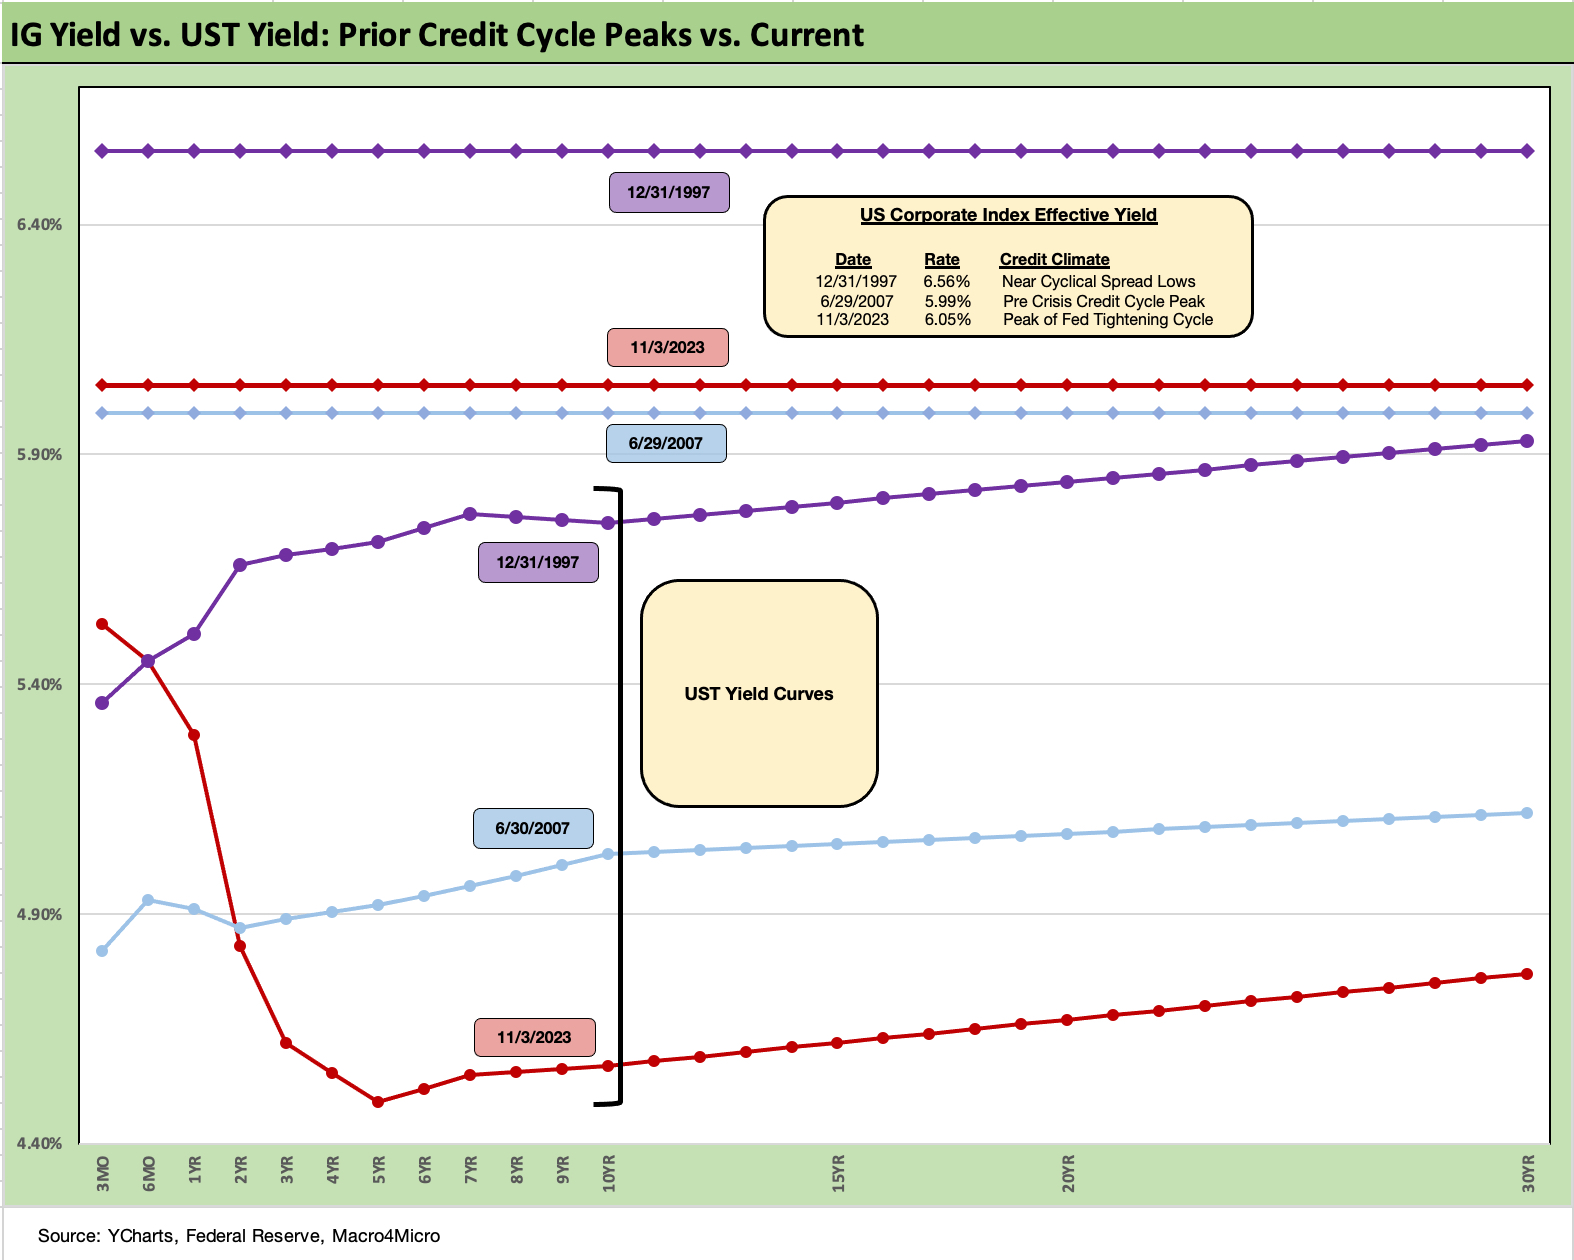
The above chart goes through a similar exercise for the current UST curve and IG index yield for current days vs. two periods where the market was at or near spread lows.
Spreads were much tighter in those peak periods relative to the +129 bps to close last week in the ICE IG index (11-3-23). For the past week, IG spreads tightened by -2 bps. The ICE IG index OAS is in the area of the long-term median, so spreads are not wide to historical levels.
The +70 bps for the index at the end of 1997 was much lower (the low was in Oct 1997 at +53 bps) and +100 bps at 6-30-07. The 1997 and 2007 periods were tight parts of the credit cycles on shaky ground given the direction of credit quality. As we know, a lot can happen in a hurry even in IG as later 2007 and 2008 showed.
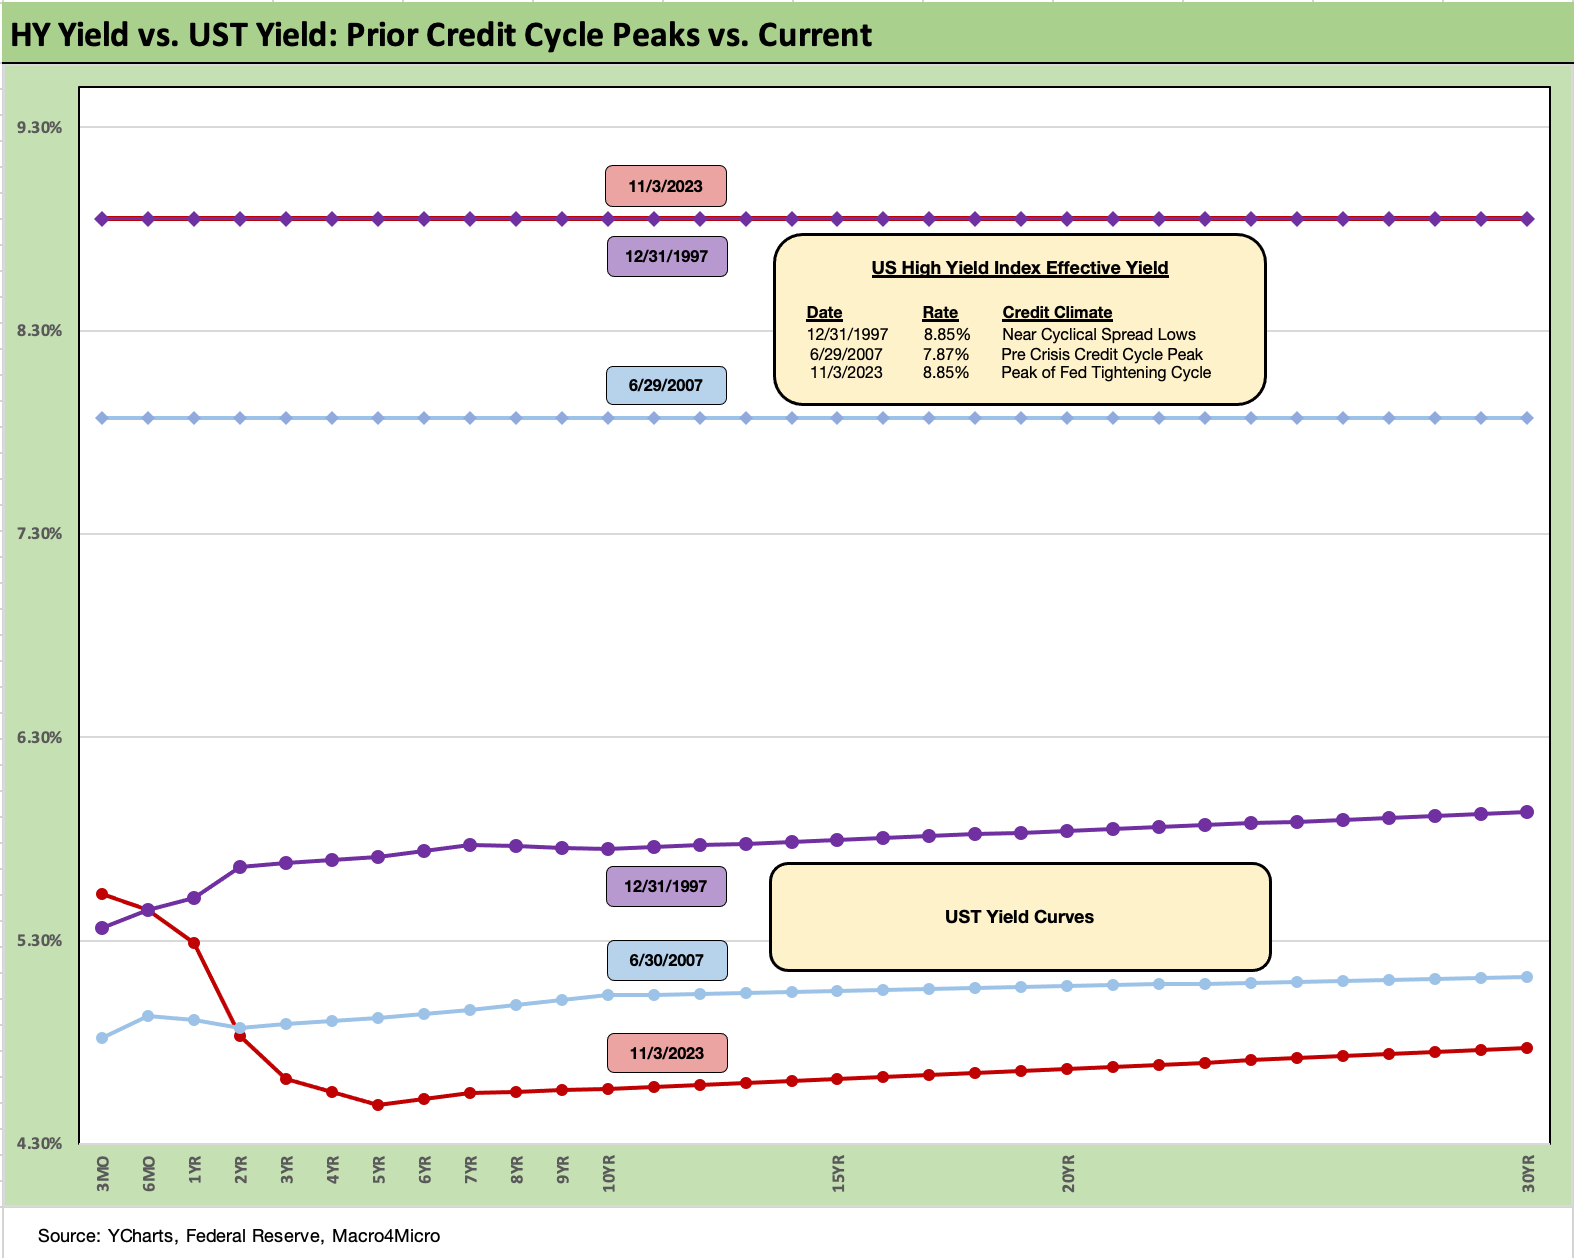
The above chart does the same drill for the US HY market as we did for the IG markets. We use the same dates to frame the symmetry of risks today. We see HY OAS back in June 1997 at +296 bps (12-31-97) although HY OAS had been inside +250 bps in Oct 1997 (+244 10-17-97).
During the crazy period of June 2007 as the market fuse was burning down, we saw HY OAS of +298 bps on 6-30-07 (as tight as +244 on 6-1-07) vs. the +404 bps (11-3-23) to end the last week. HY OAS was a dazzling -49 bps tighter on the week. The BB tier was -52 bps tighter on the week, the B tier -47 bps tighter, and the CCC tier -24 bps tighter. The CCC tier remains wider for the trailing month while both B and BB are tighter over the month.
These levels are comfortably below the long-term HY median of +472 bps, so there is a long way to go if the market gets sloppier and the geopolitical risks head in an uglier direction. Oil has been well-behaved so far in all the Mideast turmoil.
The fundamentals have been in aggregate solid and 3Q23 earnings season is not signaling worry in the immediate context of spreads. The HY spread rally in the face of a modest shortfall in job adds (to a still record payroll count) seems more about the dynamics of light supply than a fundamental trigger or compelling value. The forward expectation handicapping continues, but this is a very different HY cycle than past downturns with the UST curve and inflation handicapping driving so much of the risk pricing reactions in a BB heavy market.
We see spreads in HY as quite tight from various angles, which we discuss in other publications. The absolute OAS in historical context and relative to the risk free and lower risk alternatives do not stack up well vs. history and medians. That said, they are a long way from the peaks of earlier credit cycles. It Is hard to shake them from a fundamental standpoint. They have tightened materially across the year from year end 2022 (+481 bps, ICE).
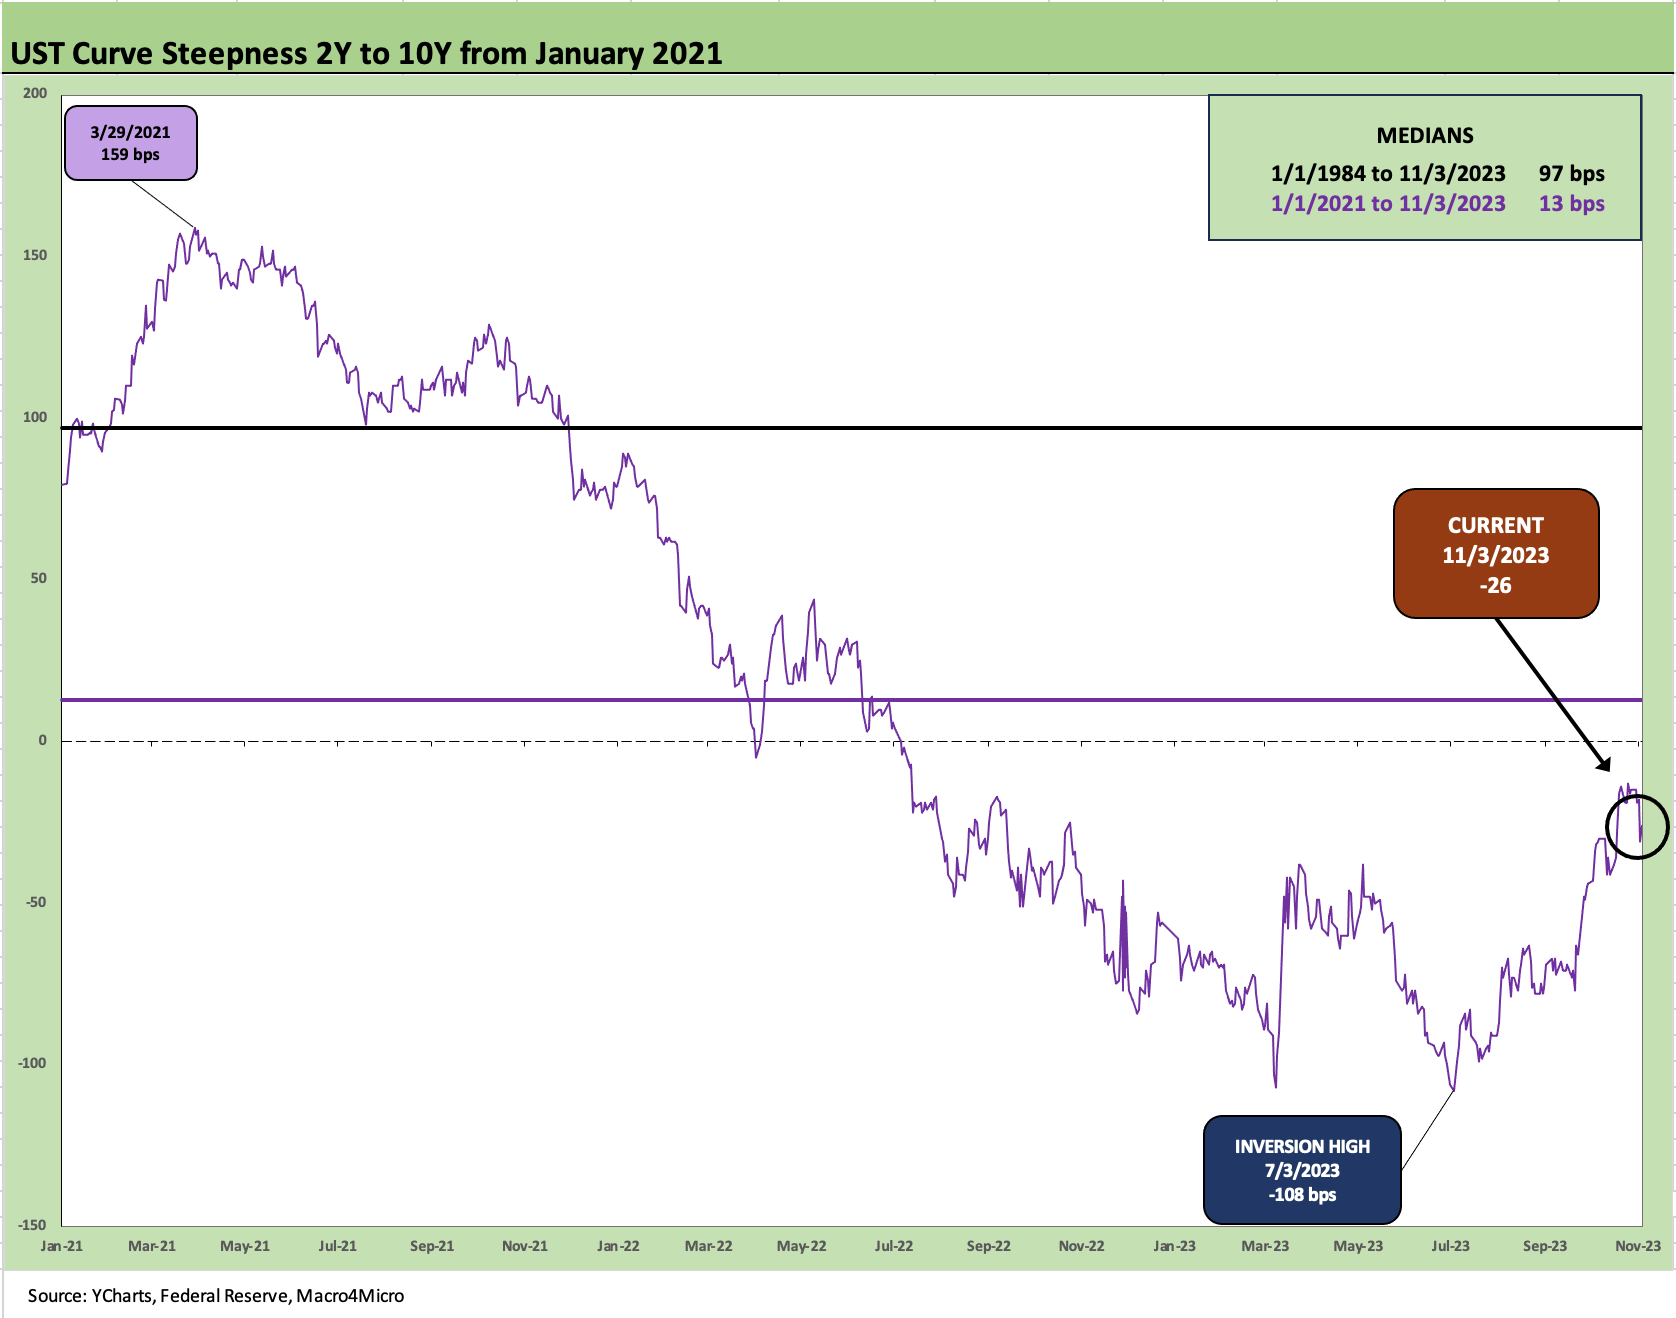
The above chart updates the 2Y to 10Y inversion, which is down sharply from the inversion highs of -108 bps in July 2023 but still vulnerable to steepening pressure given constructive fundamentals and the likelihood of the Fed holding the line. This week’s drop in the 2Y by -16 bps was trumped by the -27 bps drop in the 10Y UST. In other words, it just got a little more inverted again this past week.
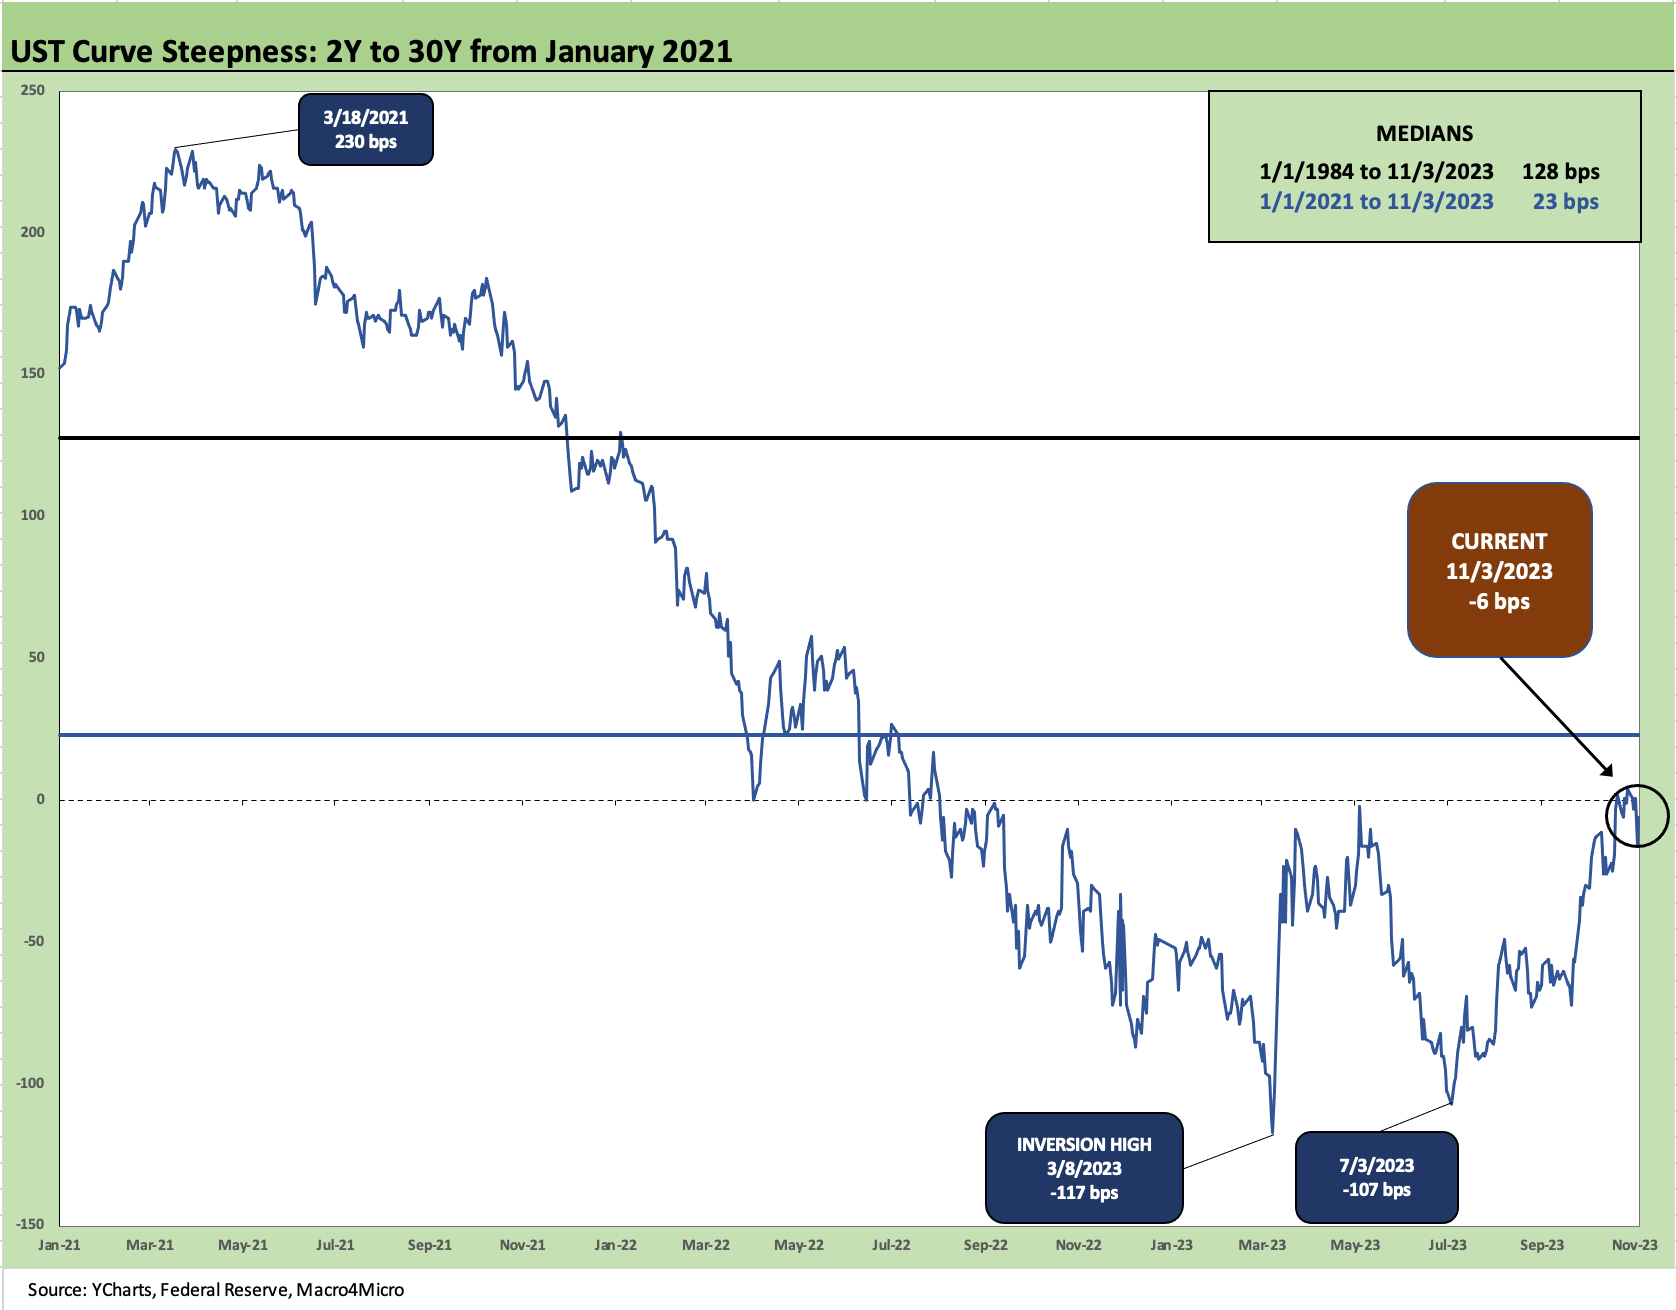
The 2Y to 30Y saw a similar pattern of the 2Y declining less than the 30Y with the 2Y to 30Y slope moving from very slightly upward sloping last week to slightly inverted again. The debate on term premiums and the upward sloping logic will remain a challenge to confidence.
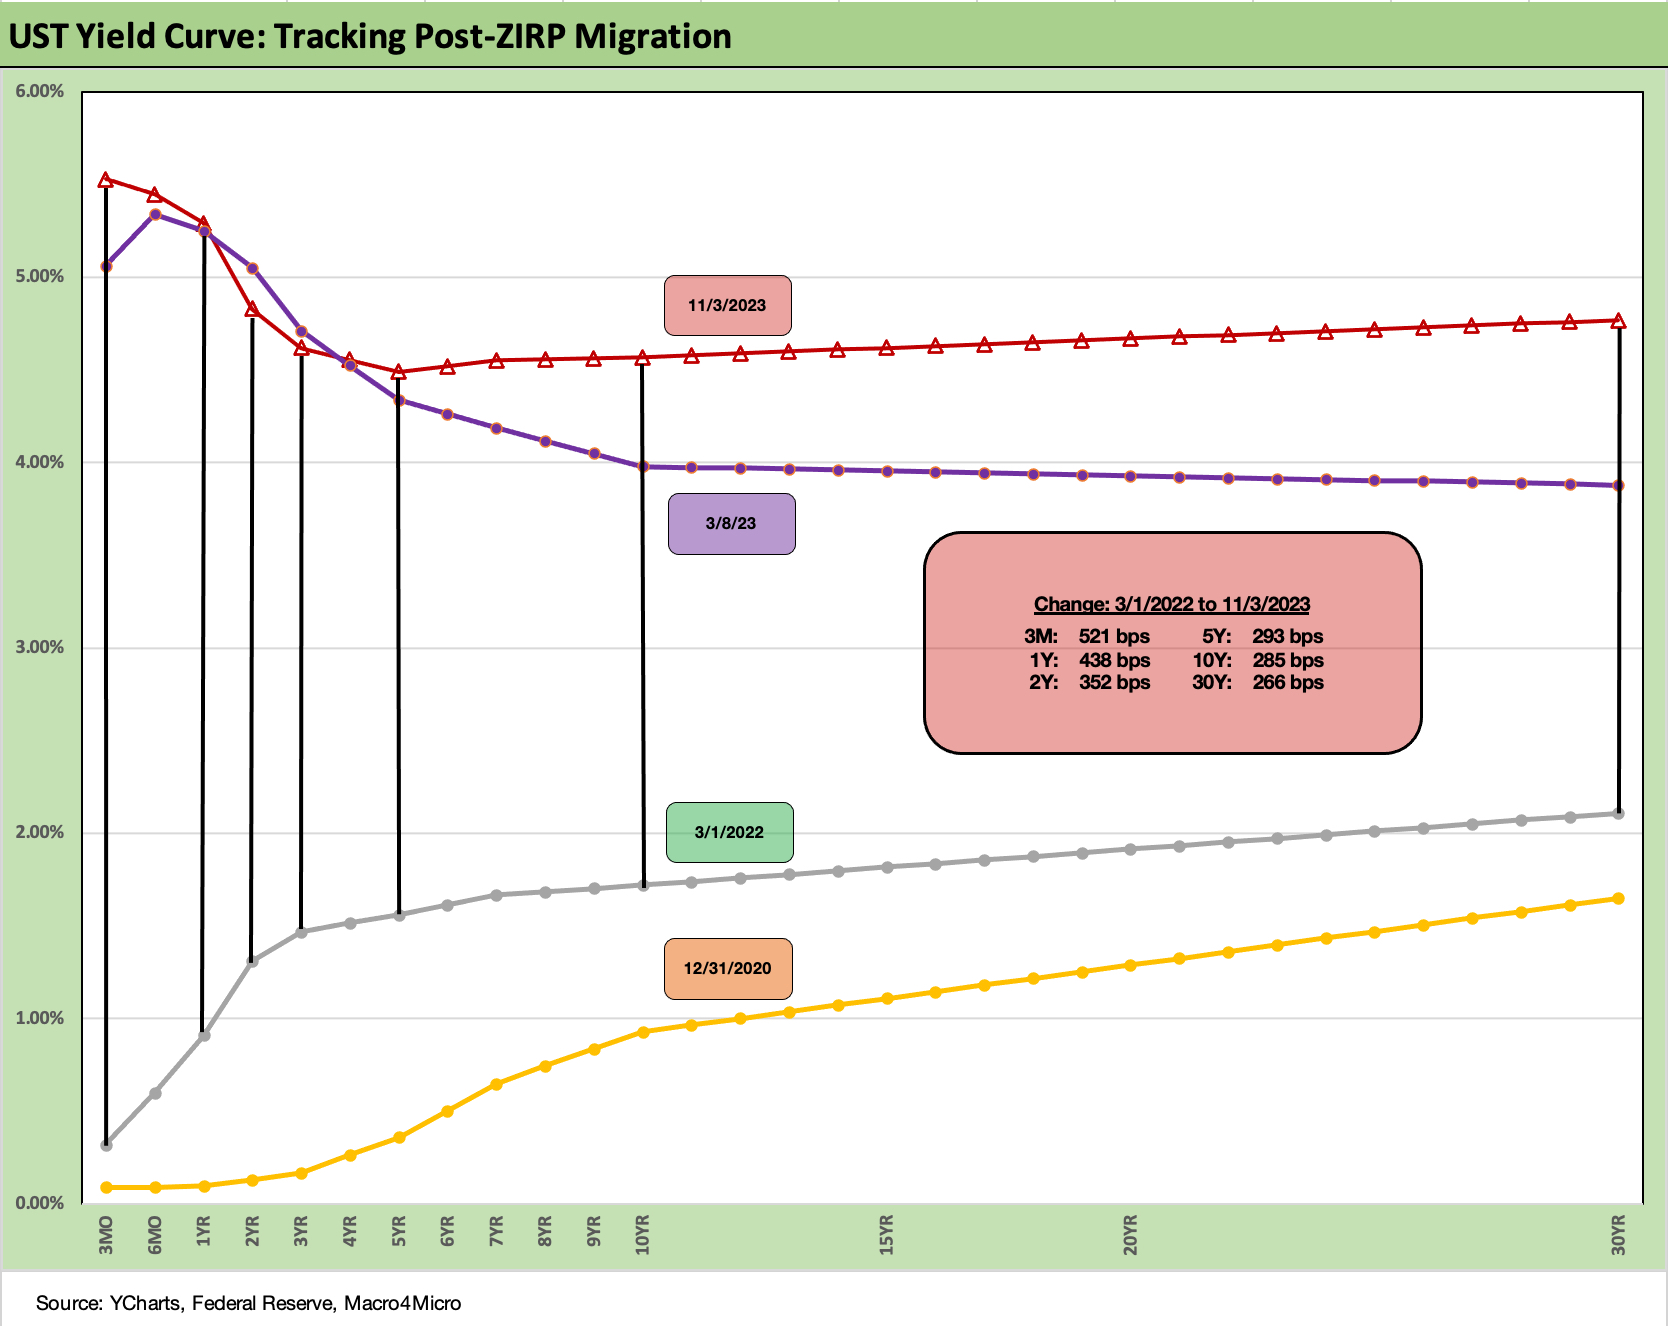
We wrap the commentary with our usual final chart that tracks the UST deltas from March 1, 2022, which was the month that ZIRP ended and the upward migration and monetary tightening cycle got underway. We also plot a year end 2020 UST curve as a frame of reference in the weeks after the vaccine came out. We list the UST delta across 3M, 1Y, 2Y, 5Y, 10Y and 30Y in what has generally been a bear inversion until the more recent bouts of steepening in some segments of the curve.
The rally of this past week was good news for the market and at least gave weight to the idea there is a debate to have. The theoretical playbook says that if inflation is stubborn - even if just for that last 20 yards to the 2% end zone – and the market is seeing constructive fundamentals, then the Fed will have a hard time easing unless there is tangible fundamental weakness or some strain in the financial system. Otherwise, the worries around the “steepening towards flat” or “steepening toward upward sloping” will remain in the discussion.