
Footnotes & Flashbacks: Asset Returns 11-5-23
We look at the mix of benchmark and ETF returns in a bullish week for equities, rates, and credit spreads.


A banner week across the full range of equities and a sharp bull flattener along the UST curve drove some bullish results in an all-positive week for the benchmarks and ETFs we track.
The UST curve shift and bull flattening fueled solid duration returns and gave equity bulls a good chance to rationalize multiples vs. 10Y UST potential until the market can find some more consistent recurring data to support the theories.
A very impressive spread rally in US HY also feeds the optimists over in equities if they feel credit is not a worry and the curve is calming down.
The market needs a few more decent inflation readings, some disaster avoidance in the budget, and a relative lack of Middle East escalation (Iran) to keep oil prices in check as we saw this week.
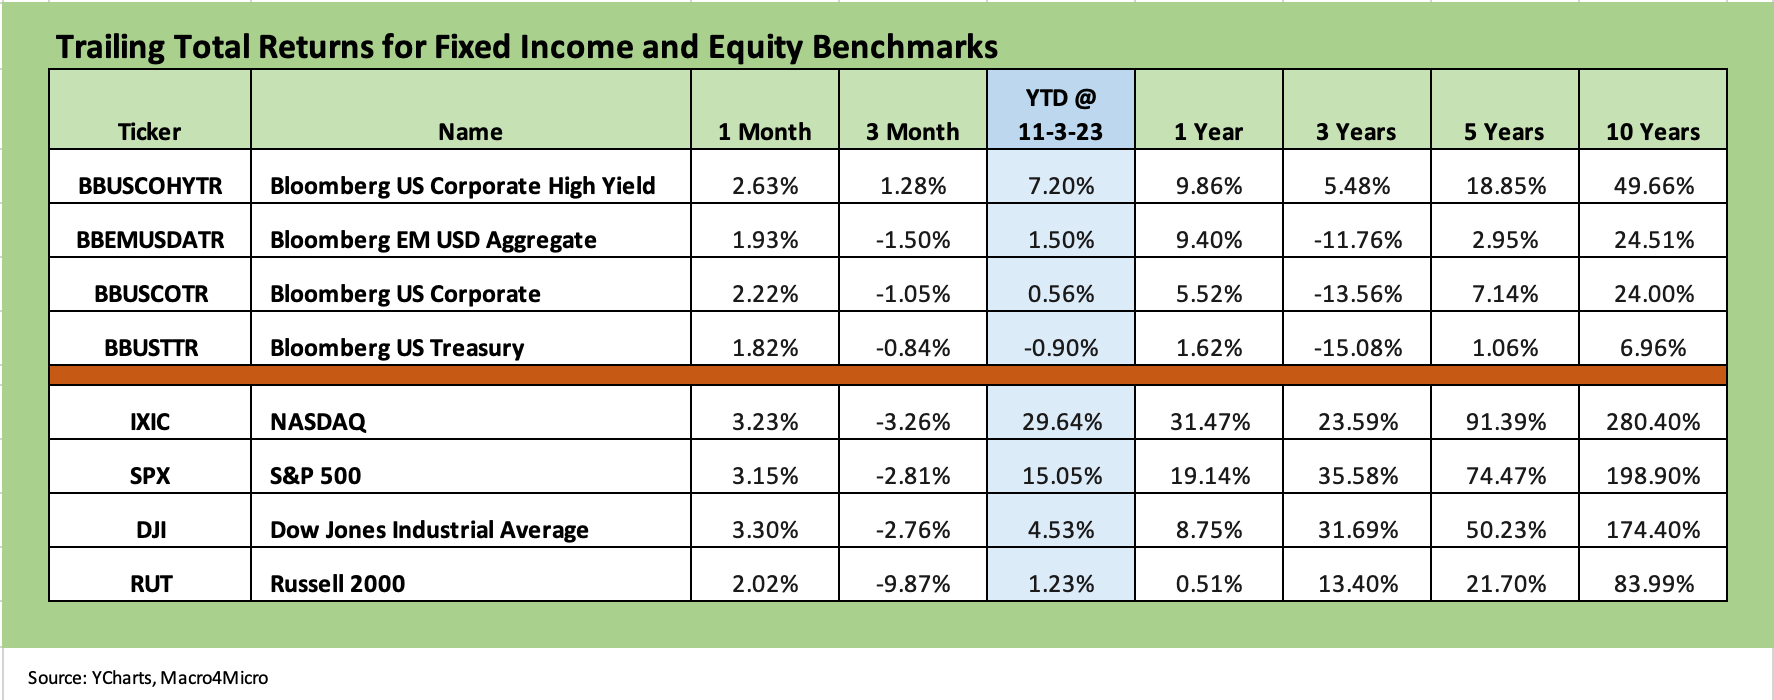
The above chart updates the main high-level debt and equity benchmarks, and the shift in performance is pretty stark in both equity and fixed income asset classes. We now see that the trailing 1-month columns are all positive for each of the fixed income and equity line items after being all negative last week for 1-month across the fixed income asset classes and also for the stock benchmarks.
For equities, the S&P 500 at +5.9% for the week, NASDAQ at +6.6%, and Dow at +5.1% made for a good feeling while debt had the UST curve as well as credit spreads on its side. We look at the wider range of benchmarks and narrow industry groups in our ETF returns section below with the full range of time horizons from 1-week to 1-month, 3-months, and YTD.
For the trailing 3 months above, we still see all 3 of 4 fixed income line items in the red, but HY had a very strong week and pushed back into the black with the UST shift and a major spread contraction of just under 50 bps with a big piece of that on Thursday and Friday. For the fixed income lines in the red over 3 months, the UST downshift last week put a dent in those. We look at those moves in our separate weekly Footnotes publication for the State of Yields.
We line the asset classes up in descending order of YTD total returns in each of the debt and equity asset class buckets. Last week, 3 of 4 debt sectors were in the red YTD with only HY hanging in the black. EM and IG bonds now pushed back into the black while UST stays slightly in the red. The biggest move lower along the UST curve was from 5Y to 30Y so duration finally saw a strong week after a period of relative battering.
Fixed income rebounded, but equities still ruled and dominated the upper quartiles of performance. The 20+ year UST ETF (TLT) was just shy of the third quartile median for relative returns on the week with GOVT, AGG, and LQD in the bottom quartile. We address those later in the commentary. Equities can move very quickly in returns, and we saw that this past week.
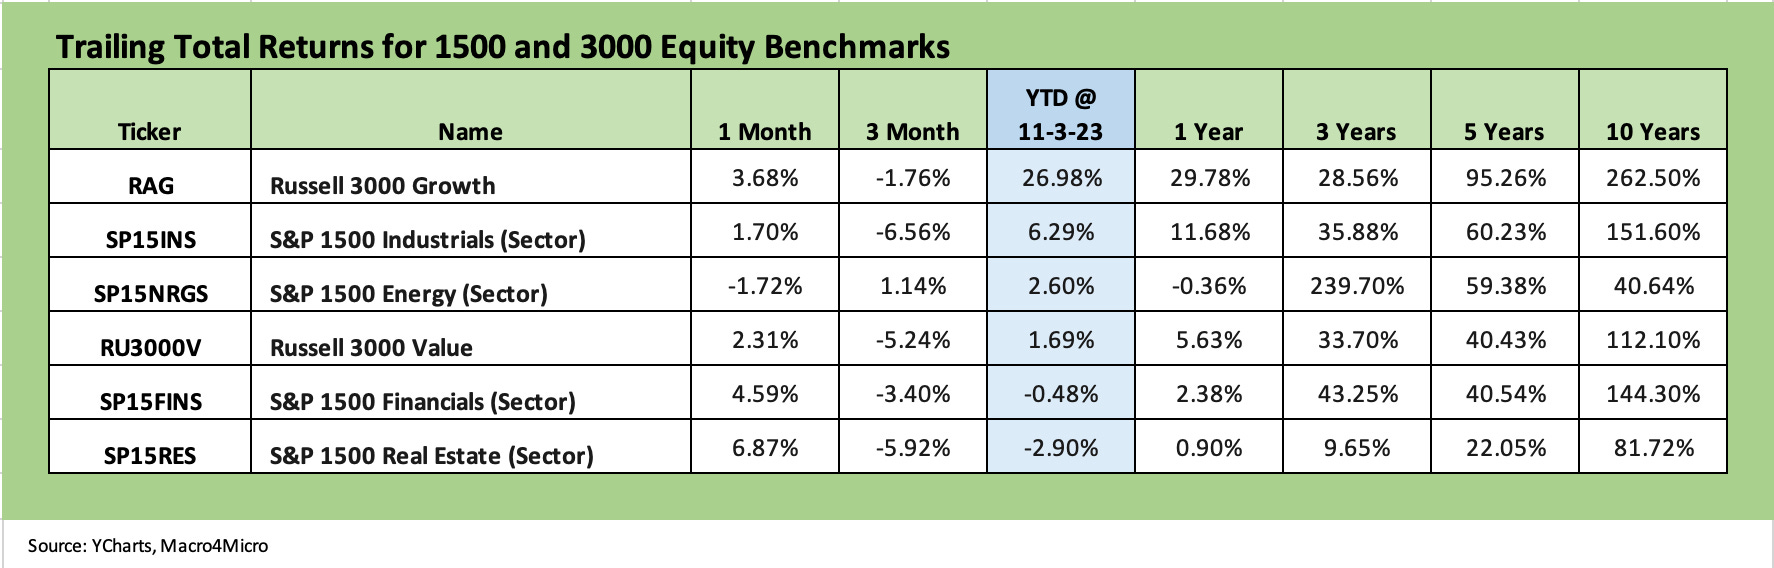
The above chart updates the 1500 and 3000 series and reminds us of what a bad stretch it has been even after a great week. Last week the 1-month and 3-months were all negative, but this week we saw some break back into the black. Growth, Industrials, and Value rallied while Real Estate soared off the bottom with the Real Estate ETF (XLRE) as a sample rebounding by over 8% on the week. Interest rate sensitive equities had been getting slammed for good reason, and one week of curve moves is not going to take them off the worry list. Financials also joined in the rebound.
Only Energy stayed in the red for the 1-month period. The steady oil price sag reminds us all of how unpredictable oil can be with a Middle East war underway and escalation just a matter of the wrong move by the wrong parties. The WTI benchmark hit $80 handles, well down from the $88 handle just two weeks ago. According to the EIA, crude oil hit record production again in August after doing the same in July (must be all that lack of energy independence people keep talking about in Washington and on the campaign trail).
ETF and Benchmark Snapshot
The next two charts give a visual of the 28 asset class benchmarks and ETFs we track across rolling time horizons of 1-week, 1-month, 3-months, and YTD. Just a glance at the 1-week (top left) and 1-month (top right) tells a story of the return profile. We include last week’s as well right below it to offer a very sharp contrast.
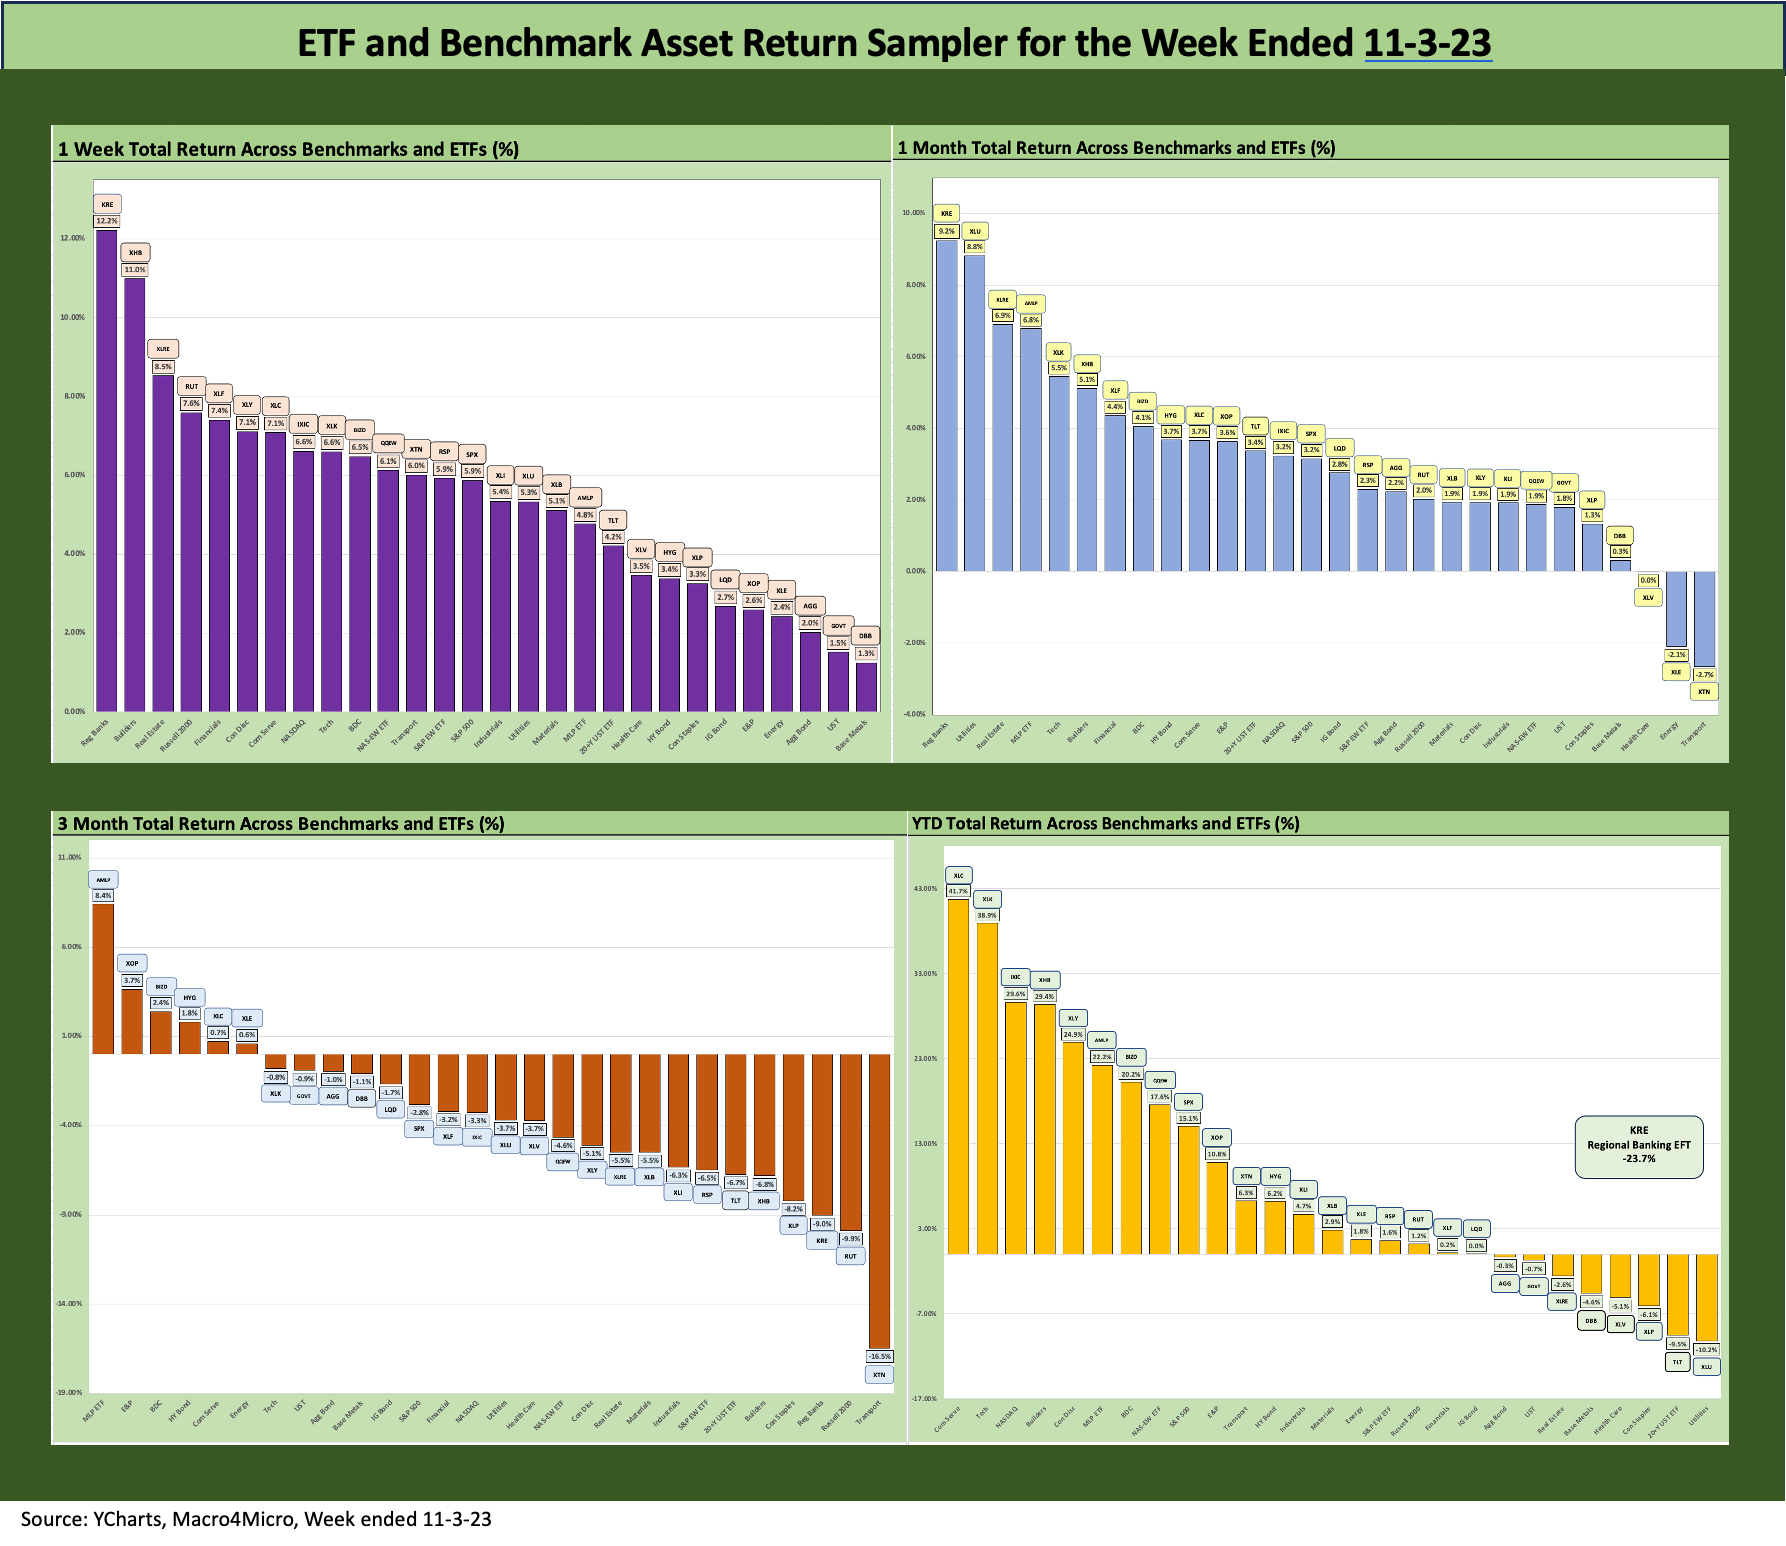
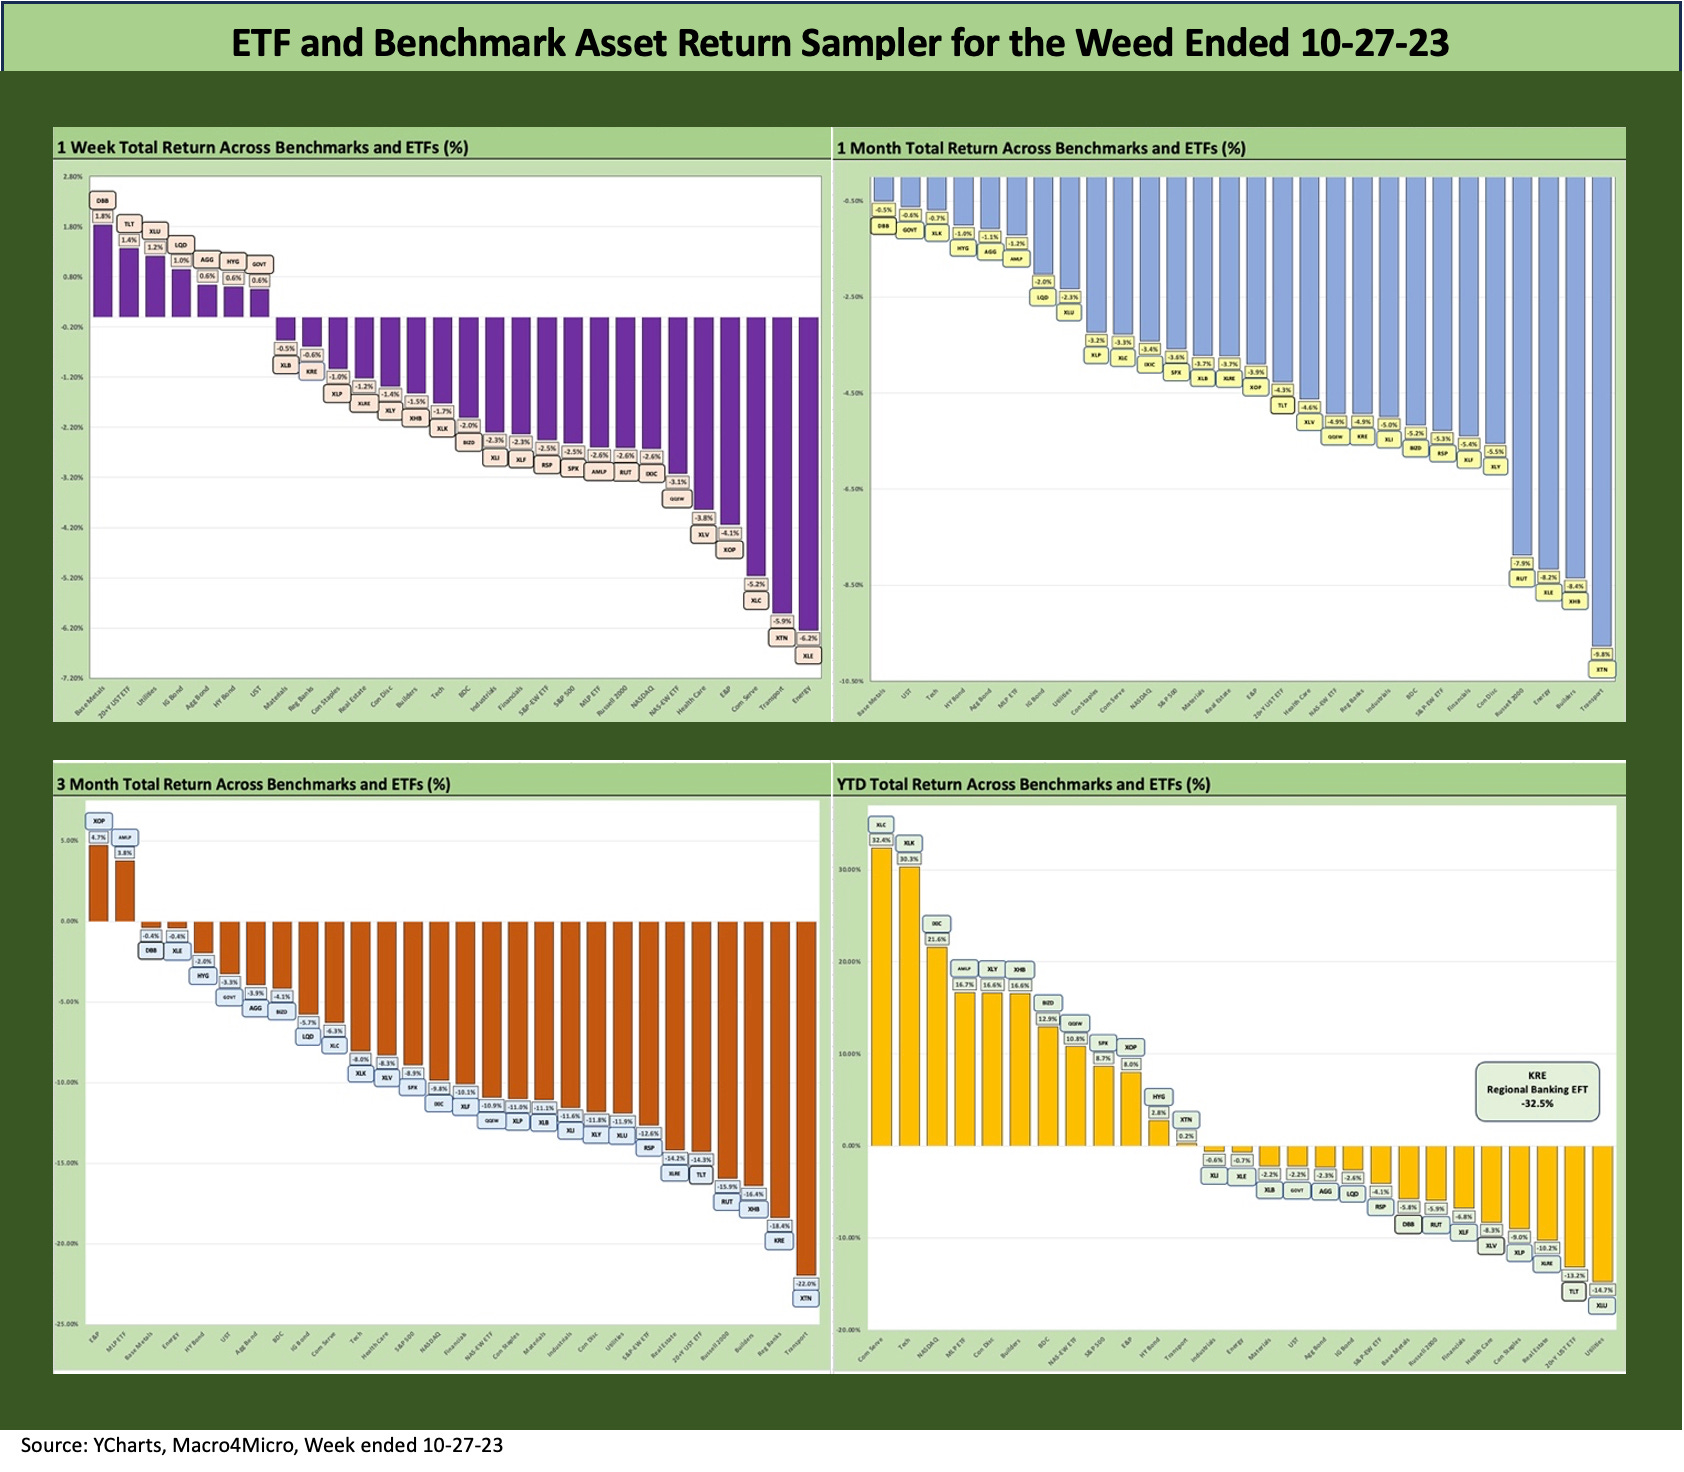
The above chart shows the 1-week pitching a shutout with all positive with the prior week (below) showing all negative for the 1-month. The trailing 3-month is showing the effects of the UST curve setbacks and weak equity performance this summer and early fall. The shift within the YTD numbers is more subtle and offers a reminder of why patience and time horizon matters. We look in more detail at the performance mix in the sections below.
Time Horizon Returns
In our next four asset return charts, we cover 1-week, 1-month, 3-months, and YTD time horizons for a range of ETF and benchmark returns. We look at 28 different benchmarks and ETFs that cut across a wide expanse of the economy.
The year has been shaping up as a bad one for fixed income and a weak one for equities outright but especially in terms of large cap breadth and for small caps. This past week started a comeback, but the reality is that we are a few good weeks from cementing a bad year or pulling out a rebound with the YTD numbers for a handful of sectors hanging in the balance.
We saw the equal-weighted S&P 500 in the negative range YTD as of last week, but it was pulled back into the black (+1.6%) with a +5.9% week. The Dow had been negative YTD, and just pulled back into the black also at +4.5%. The small cap Russell 2000 also shifted from negative to slightly positive. Time is running out to achieve a median year in multi-cycle context.
The Magnificent 7 has carried the S&P 500 well into the positive zone, but that is not a real portfolio with prudent diversification. NASDAQ has been a winner in market cap weighted or equal weighted, so that is something where 2023 has bragging rights.
Food for thought…the year 2018 sets the standard for a bad expansion year…
As detailed further below, at least there are a lot of subsectors and industry ETFs well in the black YTD (2023). We have seen materially worse years than this even during cyclical expansions. For a year where cash came in at #1 in returns vs. debt and equities, the year 2018 immediately leaps to mind. That was also a year with minimal returns on cash unlike 2023. The aftermath was that 2019 was an excellent year for risk, and that is when we get into the outlook debates for 2024 that still lie ahead.
A replay of that 2019 pattern would call for a better sense of how the economic cycle can extend while the Fed eases. All we need to do is avoid government shutdowns and not face a major escalation in the Middle East near term. The shutdowns have historically worked out fine in the end, but we are in very unusual times with Trump on trial, an election year ahead, and a House divided in a way that quite literally borders on a religious war (or at least a mix of zealots).
The Magnificent 7 heavy ETFs…
Some benchmarks have a few issuer concentration elements that leave them wagged by a few names. When looking across some of the bellwether industry/subsector ETFs, it is good to keep in mind which narrow ETFs (vs. broad market benchmarks) get wagged more by the “Magnificent 7” including Consumer Discretionary (XLY) with Amazon and Tesla, Tech (XLK) with Microsoft, Apple, and NVIDIA, and Communications Services (XLC) with Alphabet and Meta.
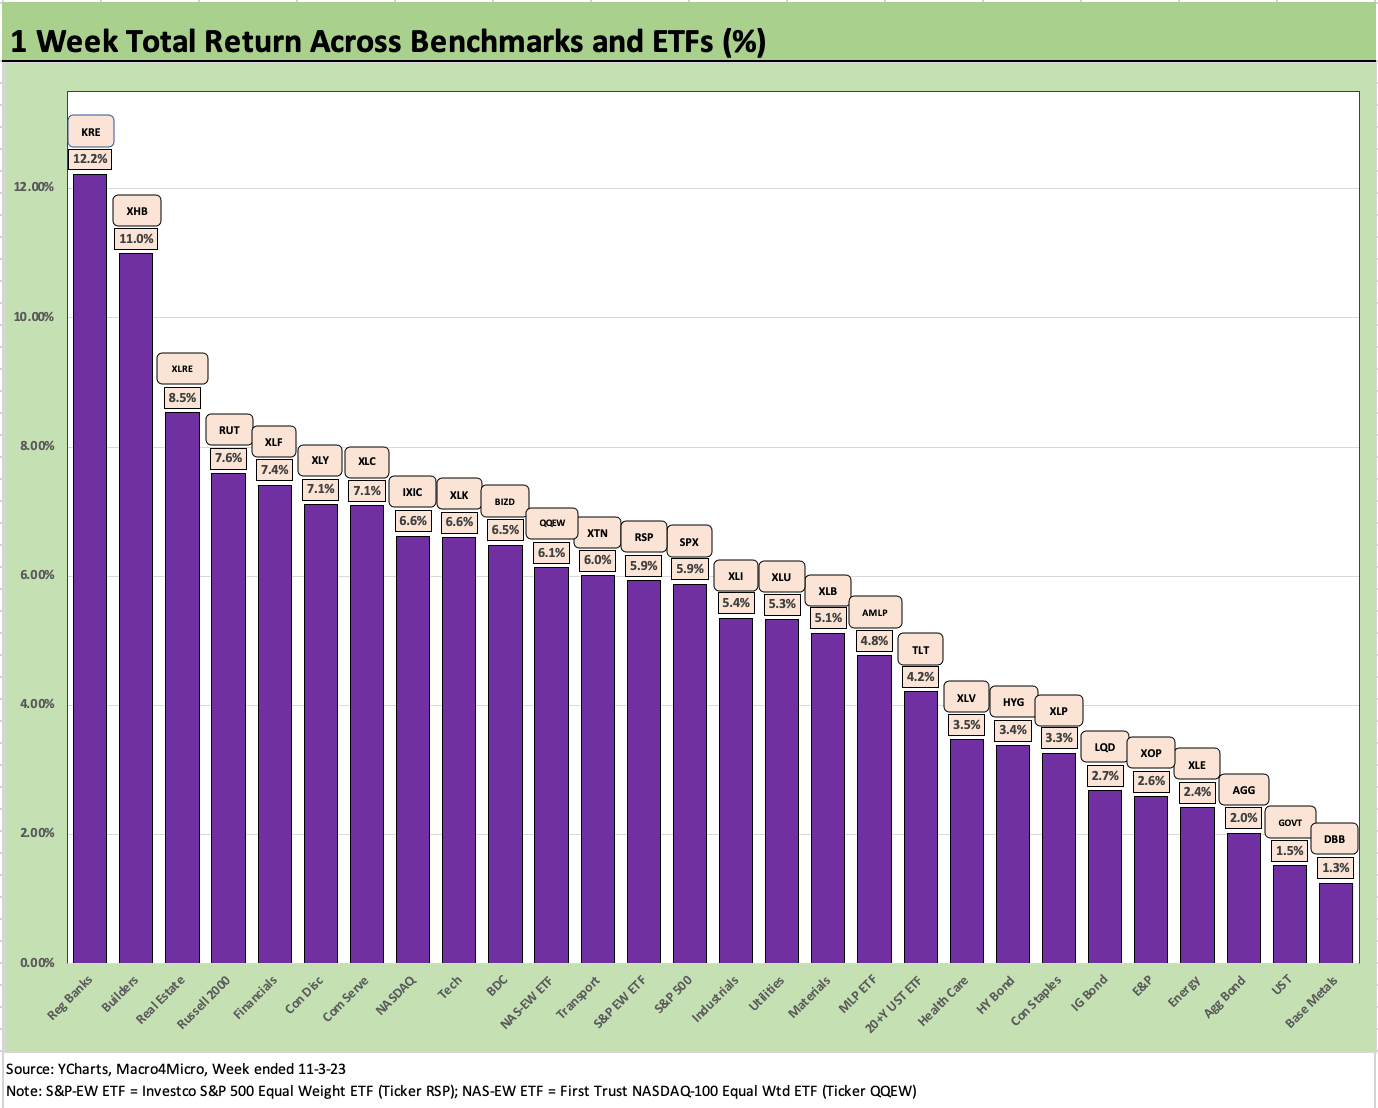
The above chart shows the 1-week time horizon sweeping to an all-positive week. The rate-sensitive sectors took the lead with Regional Banks (KRE), Builders (XHB), Real Estate (XLRE), small caps (RUT), and Financials (XLF) taking the Top 5. That is a sweep of the Top 5 without an ETF that is driven by a Magnificent 7 member. On the bottom, we see Base Metals (DBB), UST (GOVT), aggregate bond ETF (AGG), Energy (XLE), and E&P (XOP).
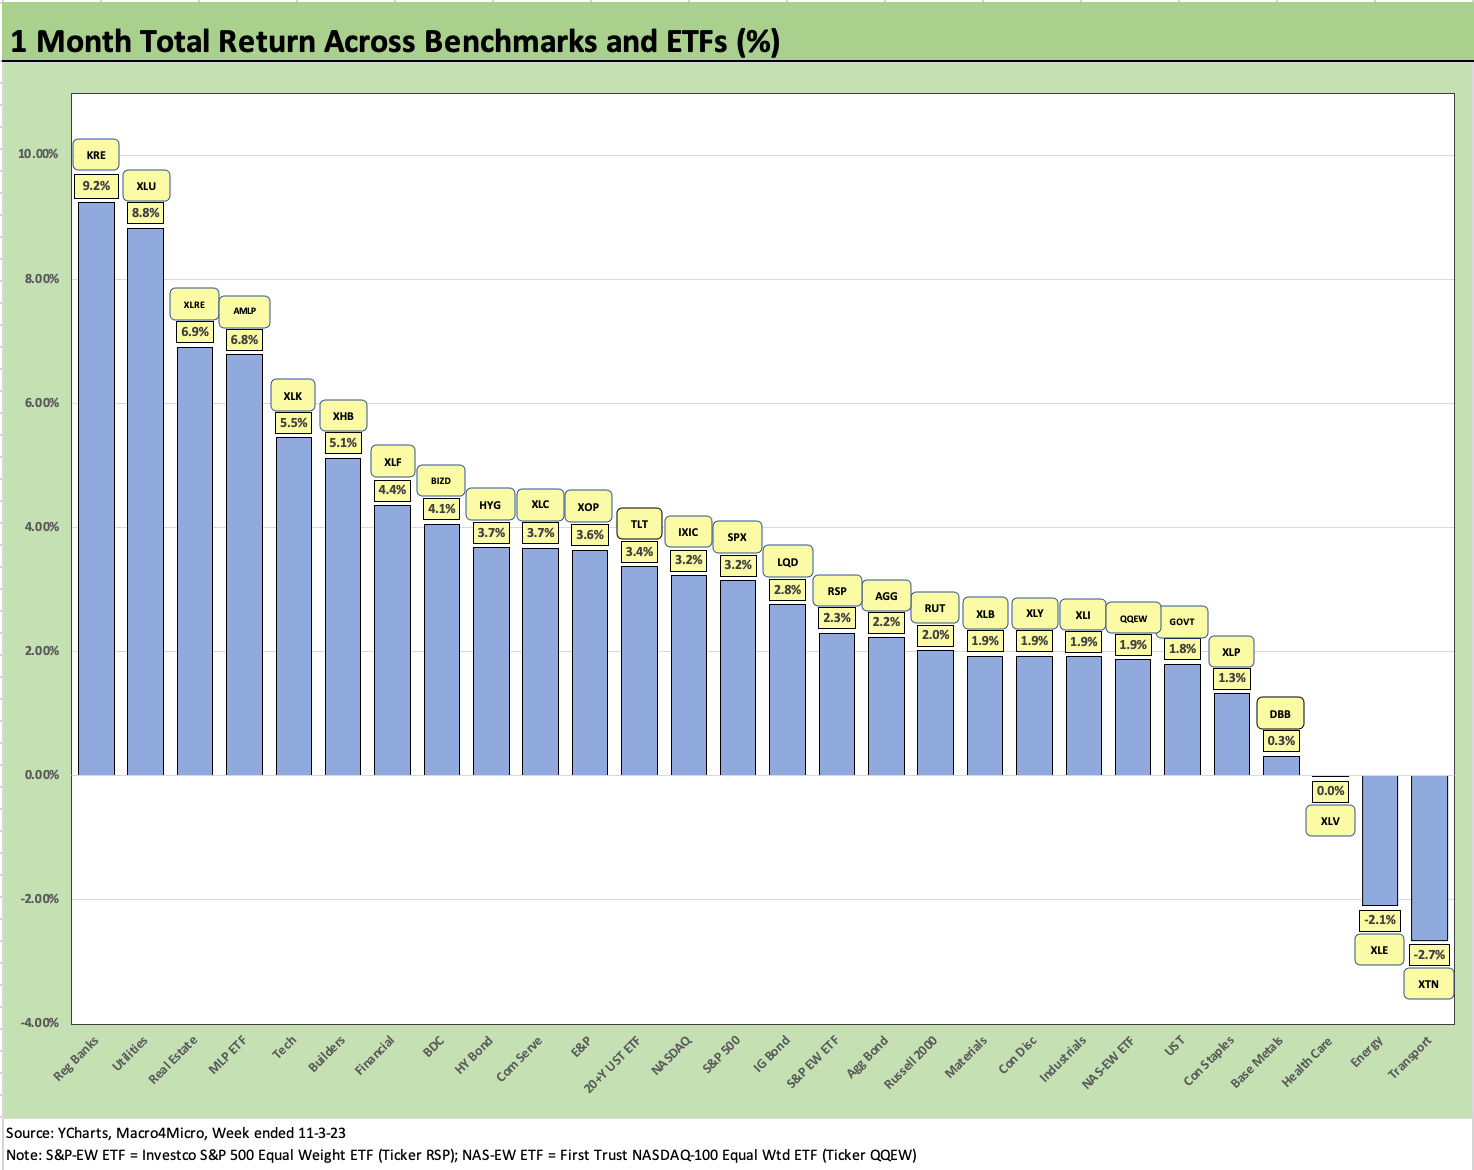
The 1-month was dominated by this latest week’s rally and shifted from all 28 being negative last month to only 3 remaining in the red for the trailing month. That is quite a swing in only 1 week. Only Transport, Energy and Health Care remain in the negative range.
The Top 3 (Regional Banks KRE, Utilities XLU, Real Estate XLRE) have been among the most beaten up this year as interest rate sensitive sectors and at least one still living under the shadow of a crisis (KRE). KRE is still at -23.7% YTD and dead last. As noted earlier, KRE led the rankings for the week.
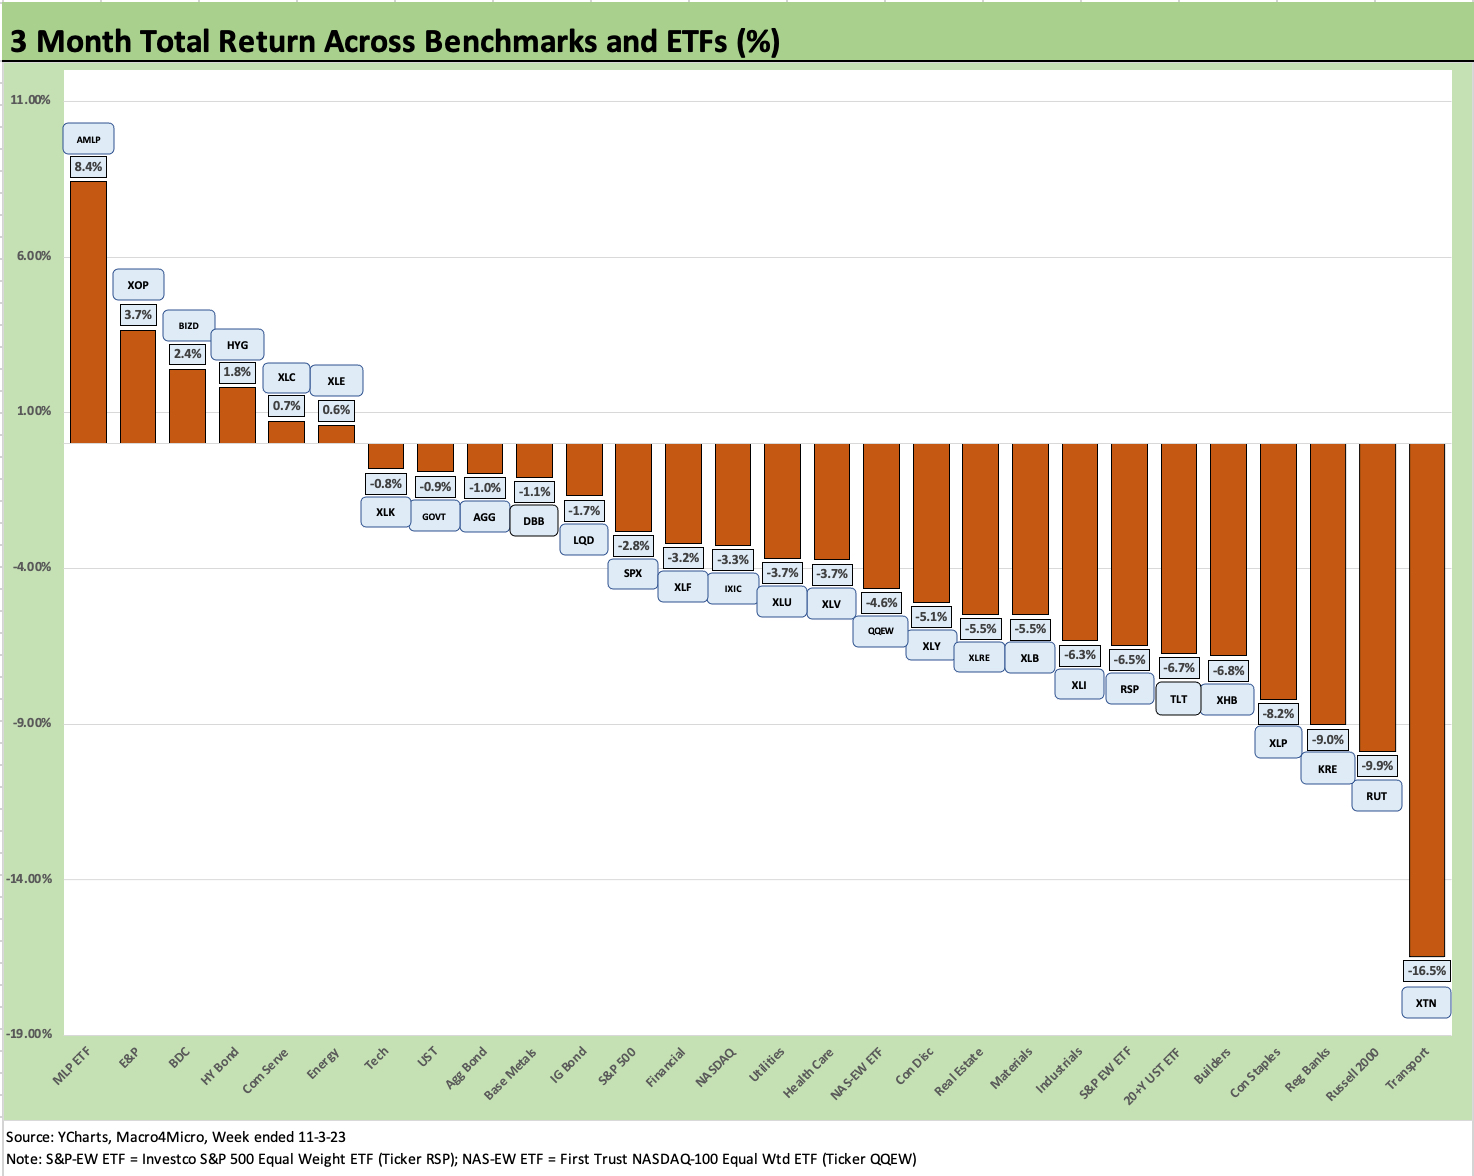
The 3-month performance is a sobering reminder of the recent pain with 6 positive and 22 negatives. Transports (XTN) all the way down in last place at -16.5% is a reminder of the defensiveness around the direction of the cycle. The weakness in Transports (XTN), Russell 2000 (RUT) and Regional Banks (KRE) is not a confidence builder on cyclical expectations or credit conditions.
The lineup on the left in the Top 6 in positive territory shows Midstream Energy (AMLP), E&P (XOP), BDCs (BIZD), High Yield (HYG), Communications Services (XLC), and Energy (XLE). It is notable that placing #5 or #6 only required being positive in returns. That is a low bar.
We like to watch the 20+ UST ETF (TLT) as a volatile indicator of the direction of duration. TLT stands at -6.7% for the 3-month time horizon despite the UST rally this week. That goes under the heading of “let’s not get carried away over a brief UST flattening last week.” The front end remains anchored for now and the economy has a lot of signals in it that are mixed but not firm recession indicators.
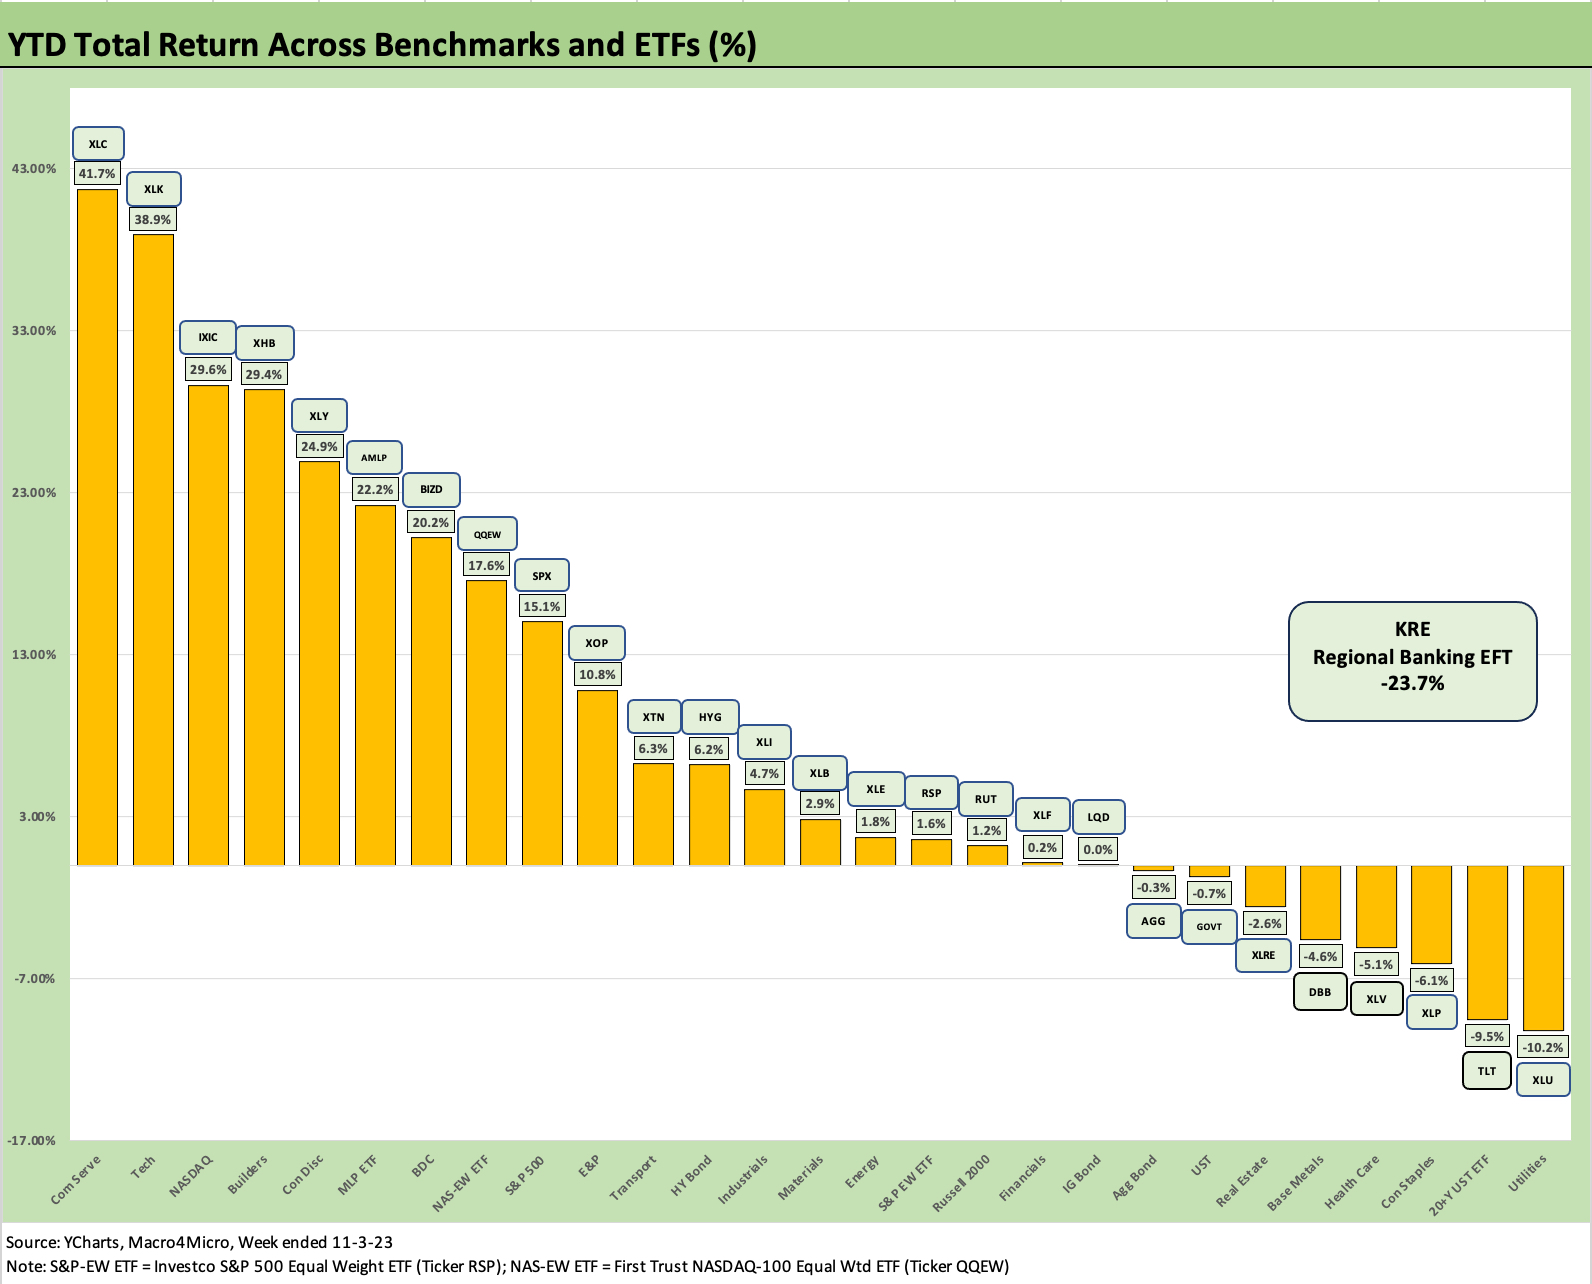
The above chart brings us up to date on the YTD relative performance for the 28 line items. After last week with 12 in the black and 16 in the red, this past very strong week shifted that mix to 19 positive and 9 negative. The low YTD positive numbers show 6 line items between the positive side of zero to under 3%.
We see 4 of the Top 5 in Magnificent 7 land or tech heavy with only Builders (XHB) cracking the Top 5 outside that mix. Midstream Energy (AMLP)and BDCs (BIZD) round out the top quartile. The Top 10 add on equal-weighted NASDAQ 100 ETF (QQEW), the S&P 500 (SPX), and E&P ETF (XOP). The S&P 500 at +15.1% contrasts with the equal-weighed S&P 500 ETF (RSP) at +1.6% in a sign of the poor breadth of equity returns. Small caps (RUT) are mired at an unimpressive +1.2% even after a rally week.
The UST curve burden is still very much in evidence on the right with Utilities (XLU) and the 20+ Year UST ETF (TLT) on the bottom. We see Consumer Staples (XLP) as defensive lagging with Base Metals (DBB), and Real Estate (XLRE) rounding out the Bottom 5. The DBB weakness is another angle on the global cycle regionally as well as China more narrowly on commodity demand. The excitement is not there.
The asset returns this past week were unequivocally positive and the UST action and fears in the equity markets around rates fed off each other with a credit spread rally helping. The earnings season has been constructive, and the Fed is running in sand, so there is still a lot of year left for clarification on what is still the main event – inflation.