
Footnotes & Flashbacks: Asset Returns 9-10-23
We look at recent asset returns in the face of a mixed yield curve and an equity sag.


We look at the asset returns across a late August/early Sept stretch that saw duration still being a headwind for bond returns and in a period where the Magnificent 7 were not so uniform in their magnificence.
We see fixed income returns biased to the negative side of total returns and Financials getting some serious second guessing on valuation and where the credit cycle, asset quality, reserve needs, and monetary bias are headed with interest margins seeing no relief in sight.
The Energy asset class victories bring the risk of reverberation across inflation and earnings cost pressure down the line, but the OPEC+ risk factor is hardly a new variable after such a wild ride with the Ukraine/Russia war.
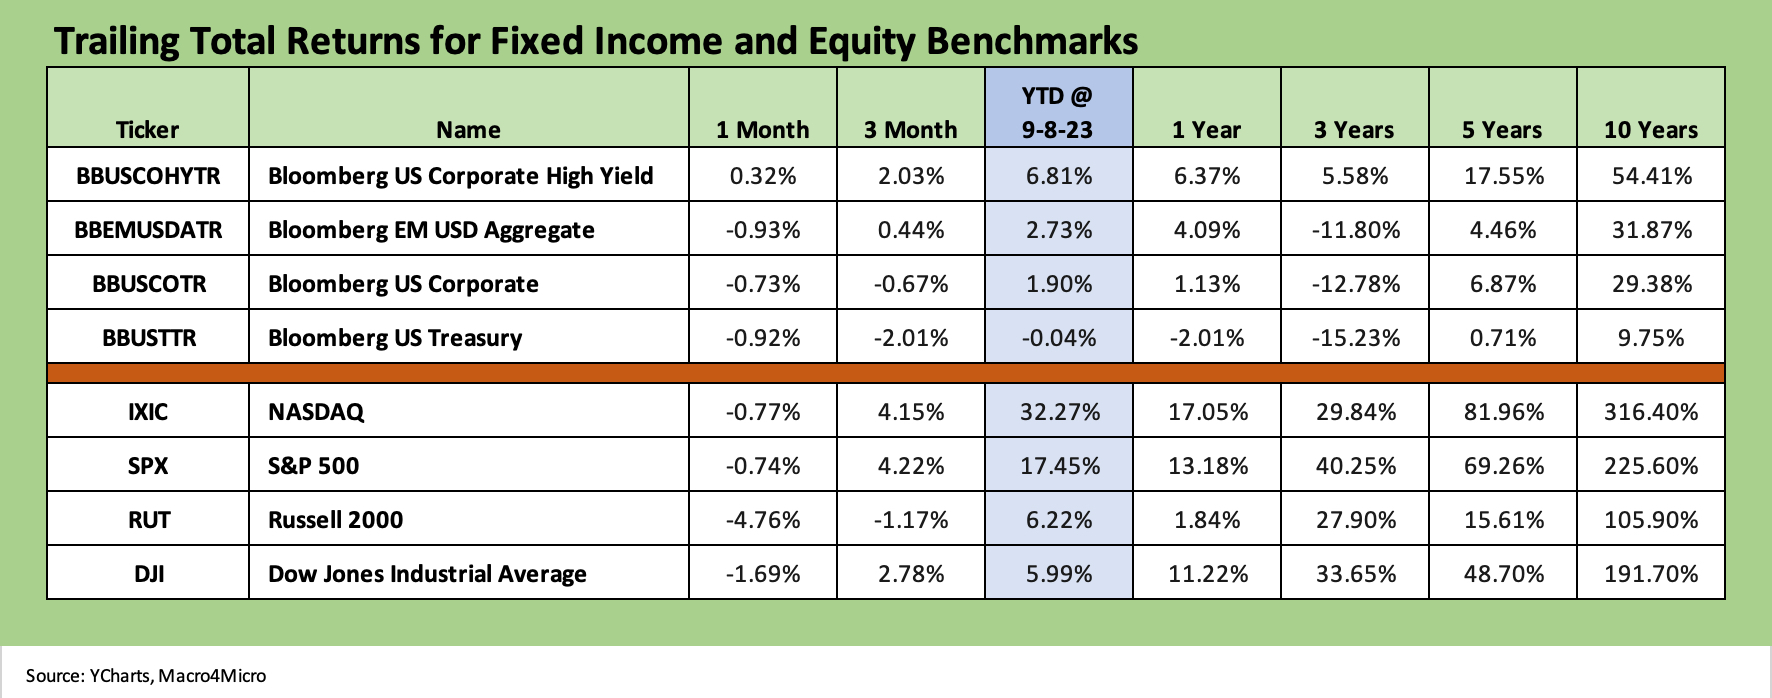
The above chart highlights a rough trailing month for fixed income with adverse curve moves still the main event. We look at asset class proxies in the form of fixed income ETFs further below, but the simple reality is that IG corporates (LQD), the US Aggregate ETF (AGG), and the UST ETF (GOVT) have posted negative returns over 1 month, 6 months, YTD, and trailing 1 year. The HYG ETF is negative for the trailing 1 year but has eked out a positive YTD return of +1.1% return through Friday and a very small positive for the trailing 6 months. That is not much to brag about for US HY and well below a coupon return.
As we have covered across the timeline, duration is a headwind that is tough for bonds to push through when spreads are also tight. At the same time, cash yield hands you 5% handles as you sort out the pieces waiting for that timing of a duration winning period. We look in more detail at the yield curve action in a separate Footnotes publication (see Footnotes & Flashbacks: State of Yields 9-10-23).
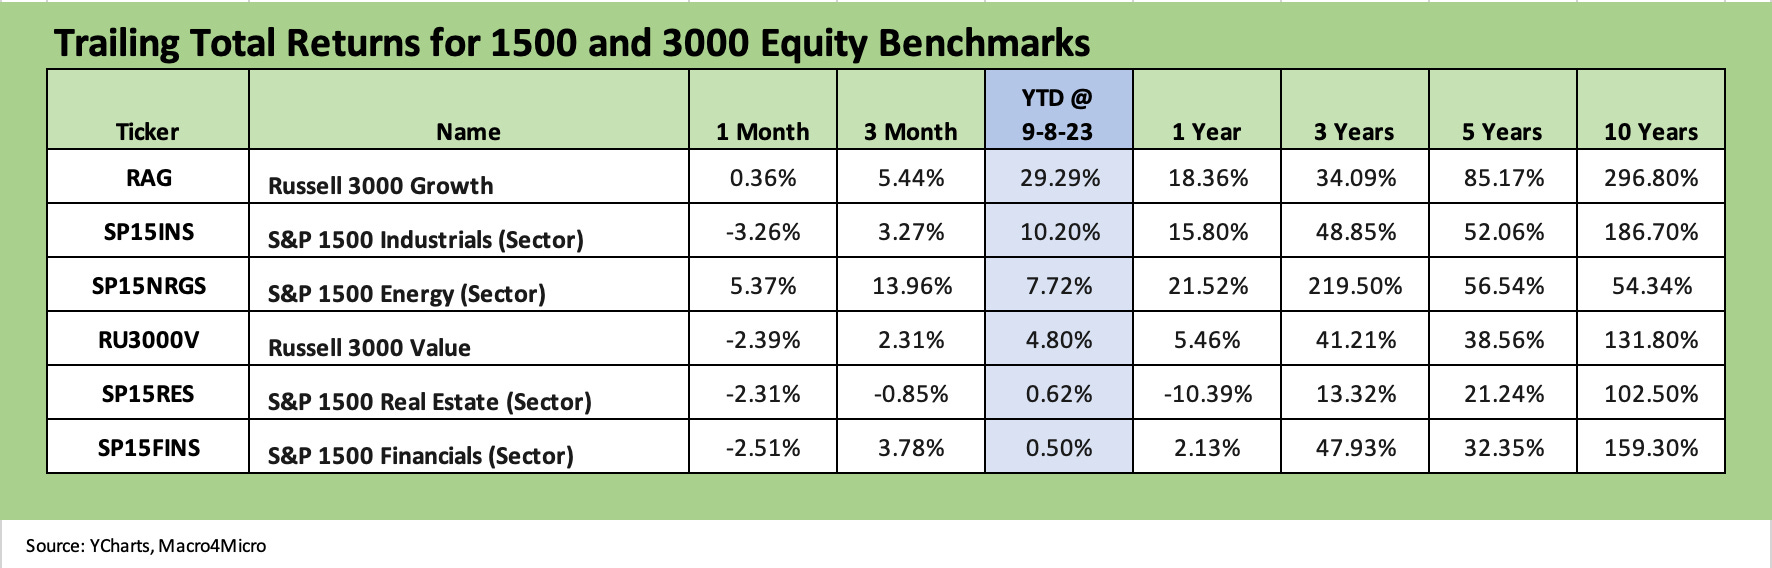
The above chart updates the 1500 and 3000 equity series, and the price action highlights a tough wrap to the summer and entry into the fall with a negative August for broad benchmarks and concerns over slowing growth in equity valuations.
There are still plenty of bulls and bears running around, but the nuances in the recession story are taking a back seat to framing valuation for slowing earnings growth looking ahead to what some of the biggest moving parts (higher oil prices, China malaise) might mean.
A major risk comes with the US entering its most dysfunctional political year since 1968. Watergate looks like a 3-round amateur boxing undercard compared to the cage match of today’s US political fights. Political disarray undermines policy action, and planning will suffer. A government shutdown would not help. With election debates underway on the GOP side, there will be little hard specifics addressed in the debates based on the way the first one sized up (see Political Economy: Topics Where Facts Matter 8-23-23).
It is tough to compare policy and execution risk across election cycles. The 1968 backdrop was one for the ages with Johnson stepping aside as incumbent. The political cycle in 2024 promises to be uglier than 1968 (strange as that sounds). The need for action in foreign policy and on the domestic front could not be higher, but little can happen in the year given the political dysfunction.
For some context on 1968 vs. 2024, 1968 was a year of assassinations (MLK, RFK) and a brutal year in Vietnam-driven domestic turmoil (Note: Trump climbed into Daddy’s pockets for a doctor’s note while my neighbor across the street was fighting in the Battle of Hue in 1968 with the Marines. Former FBI head and Republican Robert Mueller enlisted and was deployed to combat in 1968 as a platoon leader. Mueller was decorated for valor and wounded in action, receiving a Purple Heart and Bronze Star. During 1968, Republican John McCain was being tortured in a Hanoi prisoner of war camp). That was a year where many people distinguished themselves for their courage under fire. We will see what 2024 holds for such courage and commitment to principle in the tense political times we see every day.
Political turmoil aside, Energy is still rolling along and even got a recent OPEC+ boost. Energy equities in the chart are running at a strong #3 in YTD total returns and leading the pack over 3 months by more than 2X vs. the returns posted by Russell 3000 Growth. For the month, only small cap growth joined Energy in the black while managing a minimal positive return in the mix that we track.
The rolling 3-month numbers are more upbeat with Financials and Industrials more mixed in the aftermath of earnings season. Financials saw some backsliding after a solid relief rally in Regionals faded with the Regional ETF (KRE) taking a 1-month beating as detailed below.
ETF and benchmark returns…
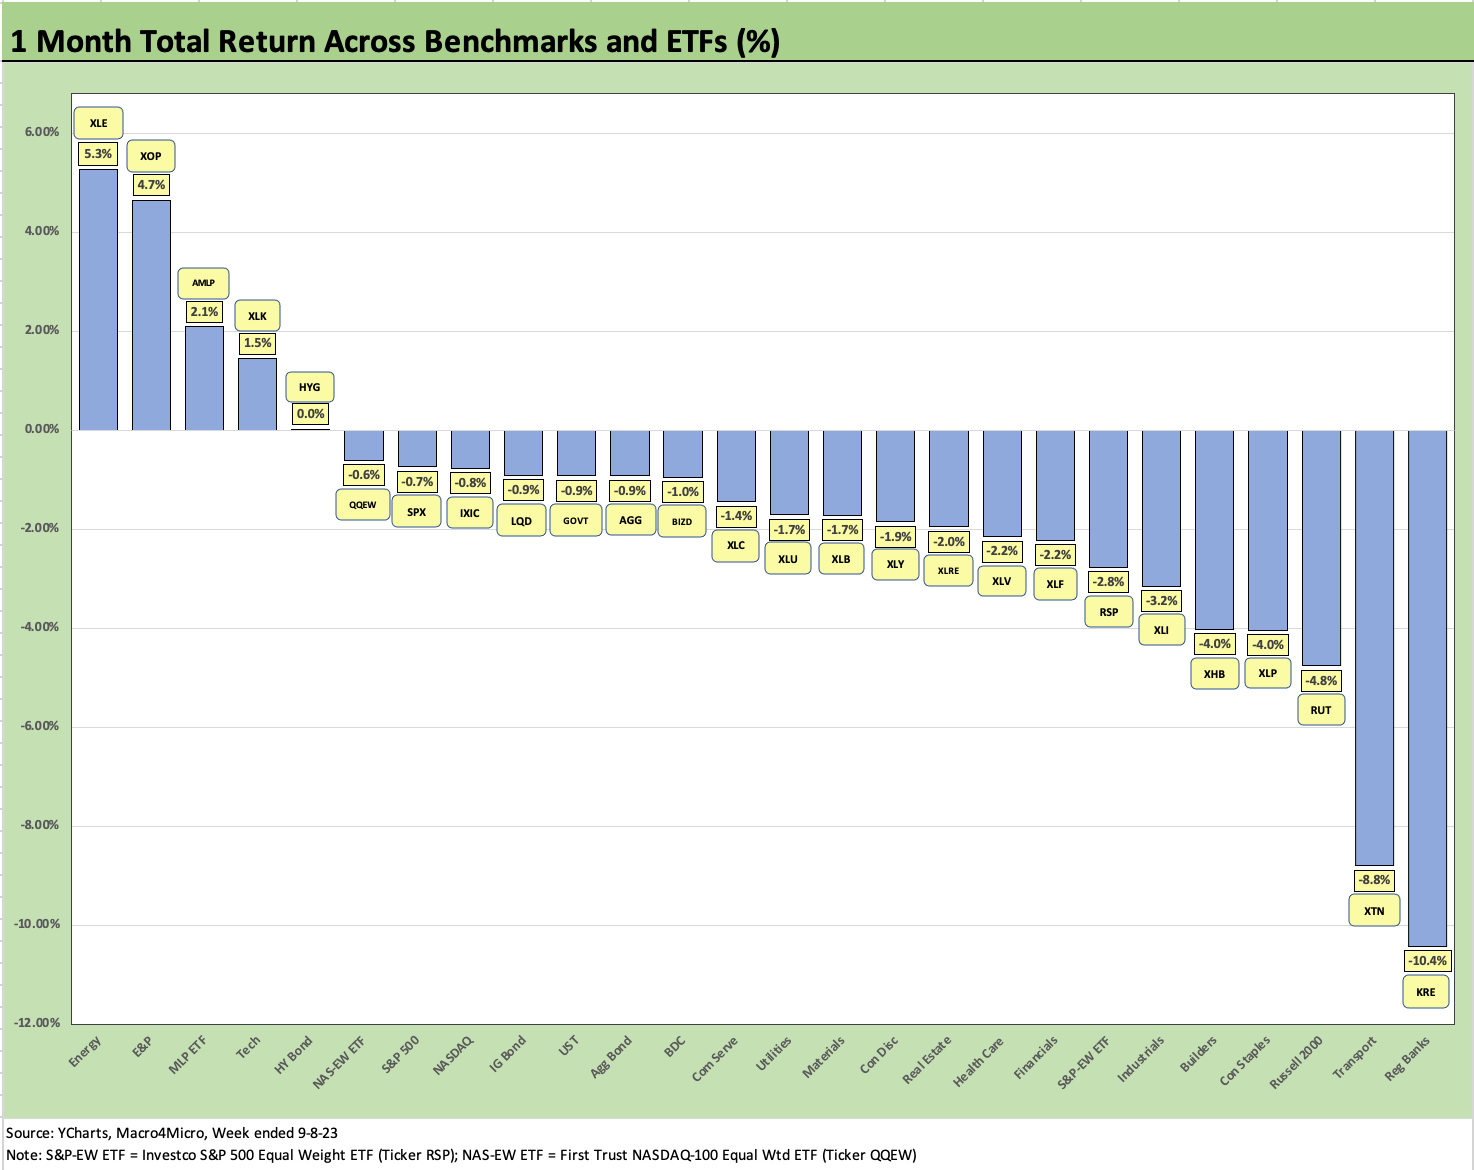
In our next three asset return charts, we cover 1-week, 1-month and 3-month time horizons for ETF returns. We look at 26 different benchmarks and ETFs that cut across a wide expanse of the economy.
We recently added equal-weighed ETFs for the S&P 500 (RSP) and NASDAQ 100 (QQEW) given the market cap weighted distortions in the total returns for those benchmarks that had been driven for much of the year by the mega-names.

The above chart frames a losing week for most of the 26 ETFs and benchmarks with 23 in the red and 3 in positive range. Other than Diversified Energy (XLE) and E&P (XOP), Utilities (XLU) had some good news for a change even if it is mired in the red for the trailing 1-month period and dead last over the trailing 3-month period (detailed below).
The fixed income ETFs are less volatile, but all four bond EFTs in the mix (AGG, LQD, UST, HYG) are clustered in the upper end of the return mix but in the negative zone. Just below the Top 10 is the BDC ETF (BIZD) with its floating rate asset mix. The BIZD asset mix makes for an interesting comparison with the HYG ETF since both are tied into the credit cycle, handicapping default risks and the relative liberality of lenders refinancing higher risk loans.
The relative merits of duration exposure in fixed income vs. credit will remain the main event in credit asset allocation. BDCs have been winning the total return battle vs. HY ETFs across the longer time horizons during 2023 (3M, 6M, YTD) on the very high cash dividend payout. BDCs are not without a range of bulls and bears as private credit has been a major headline topic. The point-counterpoint on the leverage finance industry continues as investors handicap how the higher risk loan market structure will evolve over time.
The above chart highlights the weak finish to the summer and into the holiday-shortened week as the ETF and index benchmark mix weighed in at 21 negative and 5 posting positive returns. We see HYG rounding down on the positive side of zero with the fixed income ETFs in the red.
The sight of KRE sitting on the bottom after a material relief rally during earnings season (see Footnotes & Flashbacks: Asset Returns 7-23-23) is a reminder that there are a lot of differences out there on the relative health of the regional banks (and valuation parameters in the large cap financials) tied to asset quality trends and what could unfold in a “credit cycle” downturn (separate from the broader recession debate). The KRE ETF is down around -25% YTD while the broader Financials ETF (XLF) is barely positive.
Whether the concerns wrap around corporate loan quality, loan demand, consumer credit quality or the relative vulnerability of LTVs (collateral protection) and debt service risk, there will be a lot to play out in the home stretch and 4Q23 earnings (reserves) decisions by lenders.
The regulators have taken some serious heat on their regional bank performance, and one closet worry is that they will be especially demanding in the home stretch on banks in asset quality assessment and reserve policies. That is for the bank analysts out there to make the call on, but the “human nature” side of regulator hierarchy can be pretty “human” when Washington is on alert.
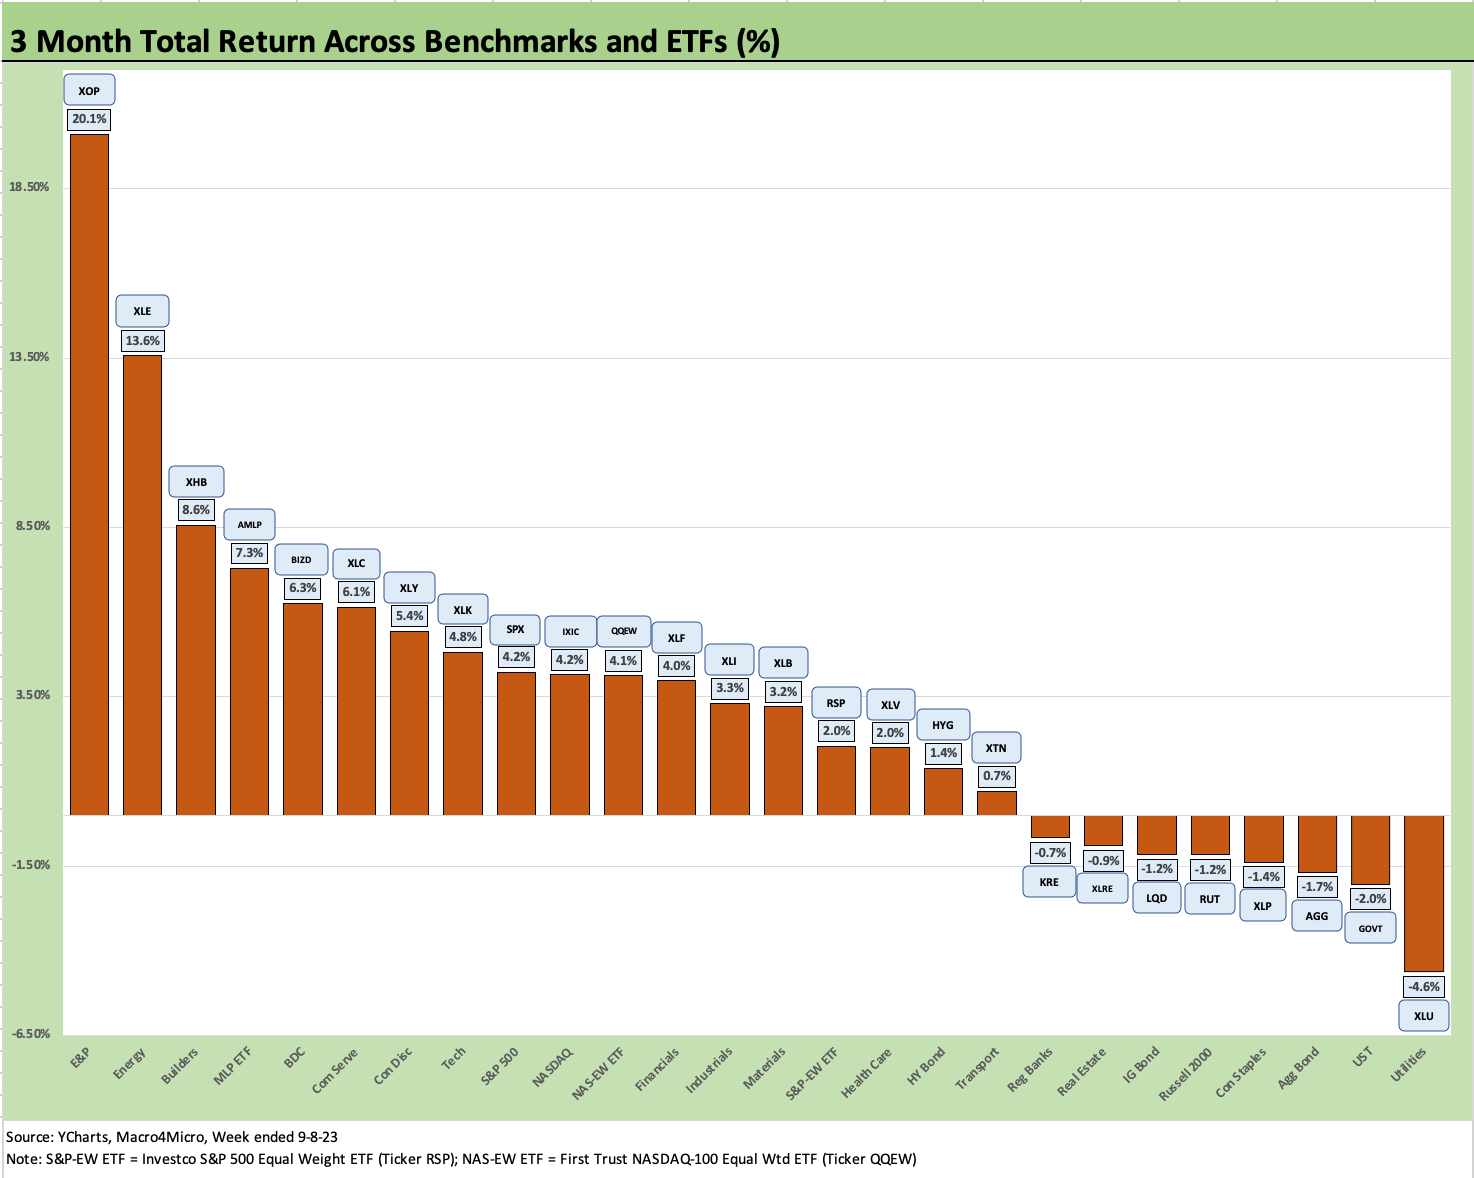
The above chart shows a trailing 3-month return profile that shows some recent strength in a wide range of sectors on the way into 2Q23 earnings season. The progress on inflation, the healthy employment trends and solid consumer spending, and some steady guidance from the real economy in the June quarters helped confidence. The sense that some sectors that had seen a lot of worry (e.g., manufacturing) were at least treading water made for a summer of debate that also saw numerous street strategy star power backpedal on recession risk.
That leaves the market in some ways back where it was a few months ago – with a new set of CPI metrics and macro indicators dead ahead. We then will get a fresh round of handicapping around when the FOMC will clarify the “pause vs. hike” probabilities. Unlike earlier in the year, we expect “easing” is not the main headline to handicap unless some macro variables bring material surprises.
For CPI this week, the inflation number ex-shelter will be very important since the rent numbers built into inflation are disconnected from reality (see July CPI: All About the Bass 8-10-23). Jobs were cooling with recent releases, but “record nonfarm payroll” is still a “record” and more jobs is better than “less jobs” no matter how you hold it up to the light. We have Industrial Production and Retail Sales teed up this week along with Consumer Sentiment.