Footnotes & Flashbacks: Asset Returns 7-16-23
We look at a cross-section of asset class and subsector returns in a week where everything seemed to go remarkably well.
In a week where UST yields from 1Y to 30Y declined, spreads tightened, and stocks rose, the bullish CPI number seemed to rank #1 on the catalyst list for the rally after jobs and yield curve noise spoiled the prior week.
The biggest wave of banks and finance operators across a wide range of profiles will be the main event this week, but we also see bellwethers including some Magnificent 7 members and major names across Energy, Builders, Defense/Aero, Airlines, and Auto-related names.
We look for guidance signals from the diverse range of earnings reports at sea level to tee up useful discussion points ahead of next week’s FOMC meeting and the advance release on 2Q23 GDP.
Below we run through our weekly asset return tables across fixed income and equities. We then look at the returns on a broad range of benchmarks using ETFs as industry level and asset class proxies and the usual broad equity index benchmarks. We already reviewed the week’s story line on the yield curve and the rally in the UST markets a week after seeing the curve get beaten up (see Footnotes & Flashbacks: State of Yields 7-16-23).
We now enter a critical earnings season that could give signals on what lies ahead in terms of revenue, cash flow, and earnings expectations and signals around the direction of hiring/firing, working capital, and capex. These are the micro level variables that will roll up into the fall season FOMC menu.
The banks and finance sector will see a wave of earnings reports from names of systemic scale to large cap to midcaps and small caps. The names will cut across some regionals who had been on some deposit anxiety lists plus a few mega-names such as Bank of America, Morgan Stanley, and Goldman.
For those worried about consumer credit quality of various categories from cards to autos, a range of names (Ally, Synchrony, Discover, Capital One, etc.) will shed some light on delinquencies, charge-offs, and provisions. The direction of commercial real estate asset quality will be a priority for the regional bank audiences.
Comparative Asset Returns…
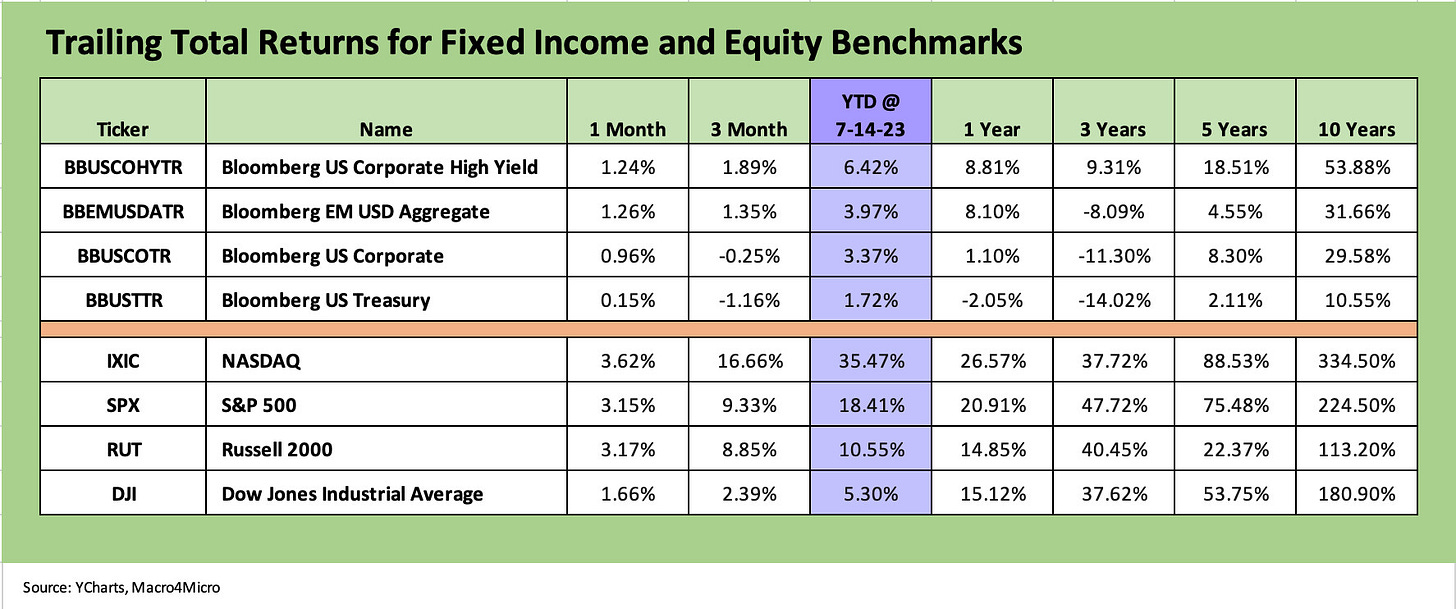
The above chart updates returns for the fixed income and equity asset classes we follow. We line each up in descending order of YTD total return. In bonds, HY has extended its lead this week as both excess returns/spreads and duration were working in its favor while IG dug out of its prior week position of being negative on a 1-month basis but remains in the red for the rolling 3 months.
US HY is running a solid annualized clip YTD at +6.4% but there is a lot of room ahead for trouble if the Fed does not like what it sees. Risky credit assets could follow an adverse reaction to the FOMC in equities or in the scenarios of a more bearish consensus developed on the cycle. A sharp turn in the cycle does not appear on the near-term menu with decent fundamentals and improvement on the inflation front.
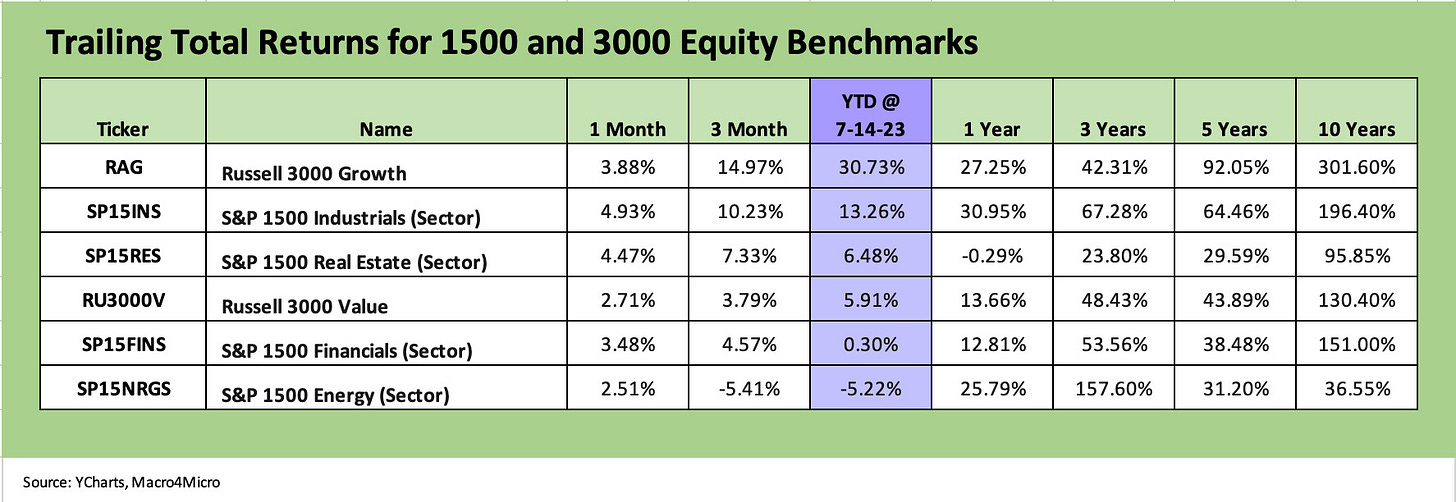
The above chart updates the 1500 and 3000 series and the pattern is still holding with Growth equities crushing Value. We see the 1500 Industrials benchmark following at a good distance behind Growth but making a move into YTD double digits at over 13% YTD with almost 5% of that this past month.
The scenario of the long tail beyond the large cap winners (“Magnificent 7”) seeing more of the market following seems to be playing out at this point. Energy remains negative YTD and rolling 3 months and is now the only one of the group negative YTD with Financials clawing back into the black (barely).
ETF returns…
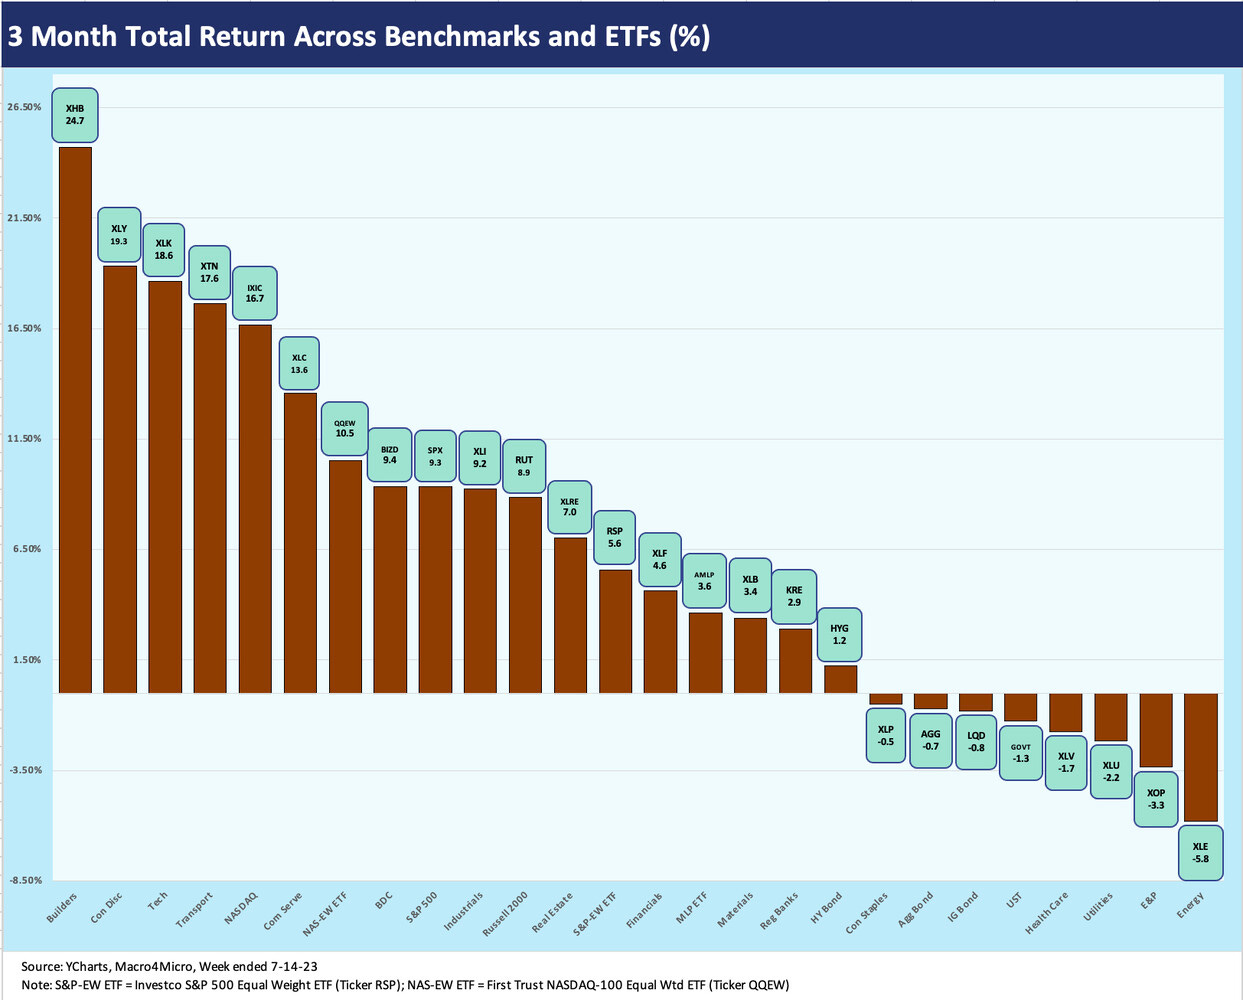
In our next three asset return charts, we cover 1-week, 1-month and 3-month time horizons. We look at 26 different benchmarks and ETFs. We recently added equal-weighed ETFs for the S&P 500 (RSP) and NASDAQ 100 (QQEW) given the market cap weighted distortions in the total returns for those benchmarks driven by the mega-names.
The above chart shows all 26 ETFs in the positive zone for a rare sweep across a very wide range with the Builders (XHB) back on top with the UST curve rally. The Regional Bank ETF (KRE) rallied ahead of the earnings wave. There will be a lot of eyes and ears involved in the regional reports and earnings calls. Energy is still sitting at or near the bottom with XOP and XLE.
The 1-month ETF also posted a sweep with all 26 positive but fixed income dominating the weak performers with GOVT, AGG, LQQ and HYG in the Bottom 4 over the past month. On the left with the top performers with the Builders at a very solid #1 for the month at +10.8% and Transportation at #2 at +6.2%. With Builders at #1, Transports at #2 and Industrials at #4 in the Top 5, we don’t see a lot of nerves in that mix around the cycle.
The 3-month ETF returns are more balanced at 18 positive and 8 in the negative zone. Within the 8 negative mix, we see 3 fixed income surrogate ETFs (GOVT, LQD, AGG), 2 energy on the bottom (XLE, XOP), and 3 defensive sectors (Utilities XLU, Healthcare XLV, Staples XLP). HYG squeezed into the bottom positive position. We see 7 ETFs posting double digit returns for the 3-month period plus 6 more from 5% handles to 9% handles. That is a strong set of returns for a diverse mix beyond the Magnificent 7 types.


