
Footnotes & Flashbacks: Asset Returns 12-23-23
We look at the running asset returns updated for the past week.


As the year winds down in style for those who are long in equities and fixed income, major stock indexes were hitting some positive post-crisis winning streaks as the inflation news came in favorably and reinforced the UST curve bulls in their forecasts.
The total returns for HY are comfortably above the long-term nominal return in equities and even IG has a shot for that by calendar year end if it gets a little more duration support in the last trading days of the year.
The distribution of benchmark and ETF returns in the group of 31 that we track each week is showing impressive breadth of strength from large caps to midcaps and small caps and across a wide range of industry winners posting double digit returns YTD.
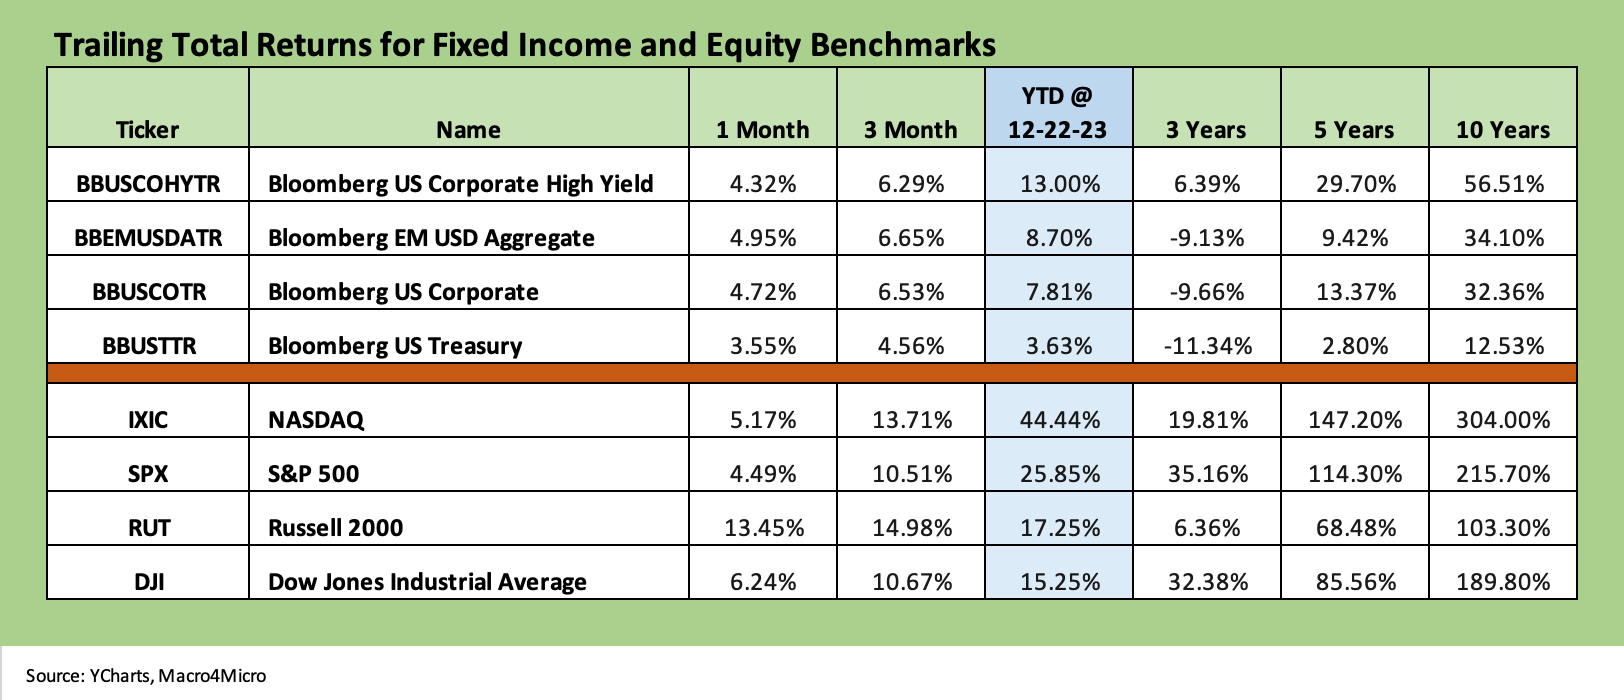
The update on the major debt and equity benchmarks we track show a very strong year as 2023 winds down with HY total returns at more than double a “coupon return.” We see HY at absolute returns of +13% that are above the long-term nominal returns on the equity asset class. The IG index return is creeping up to 2x the par weighted coupon also. We will see if the UST move in this last week will squeak out enough to get IG across the +8% total return line by year end.
We look at the credit spread action in our separate Footnotes publication on yields. The good news over in HY reinforces the theme that in this market “yield comes first and relative risk premiums second.” In terms of spreads, the HY index OAS of +339 bps to end last week is right on top of the June 2014 lows of +335 bps (6-23-14). The next stop would be the cyclical low of +316 bps of early Oct 2018 (10-3-18).
After those HY OAS milestones, it is a long way down to the +244 bps lows of June 2007 and Oct 1997. As we know now, the Oct 2018 lows rolled into a brutal finish to 4Q18 while the June 2014 low was soon greeted with a Saudi oil price war in late summer. See the Footnotes commentary on yields for more history. We will post that later today.
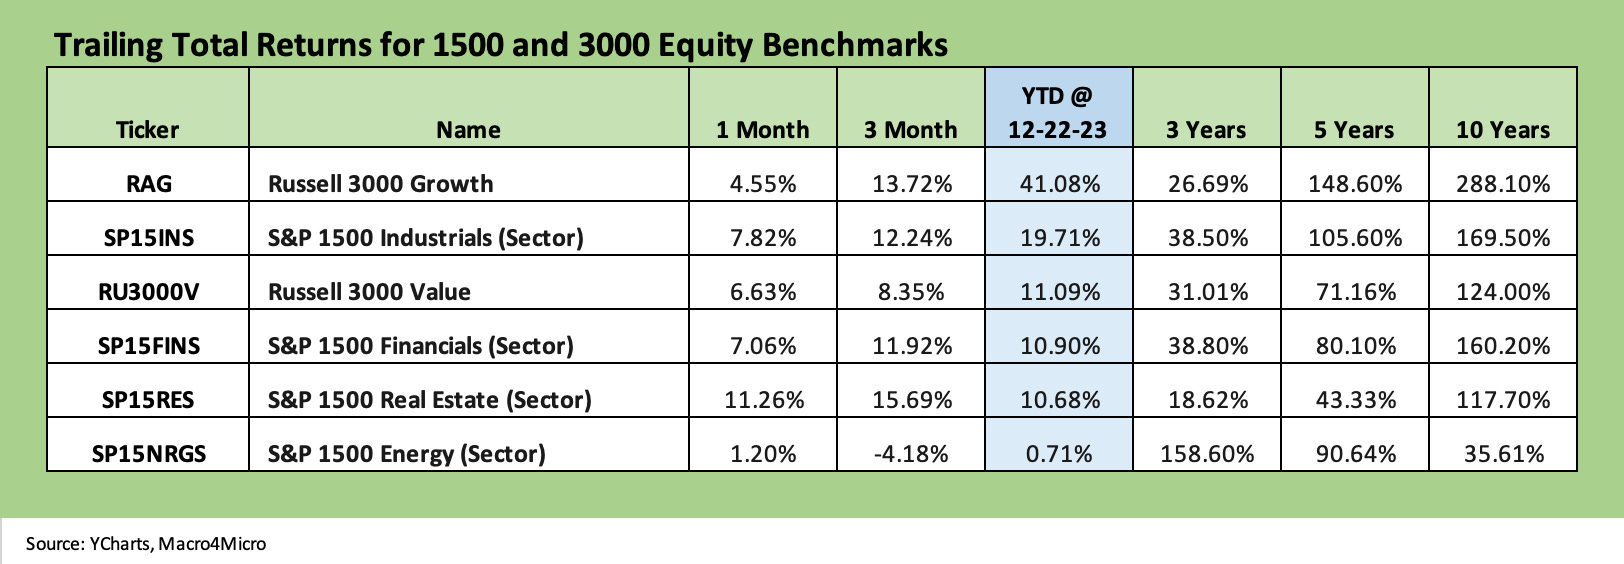
The 1500 and 3000 series update shows the sustained positive market moves and the outsized rally of some sectors that had been suffering under the adverse trends in UST curve. That was before the latest monster UST move and duration home run. The move in Real Estate and Financials tells a story on how the UST curve has flowed into those major sectors.
The Growth stocks are off the charts at +41% and Industrials at almost +20% YTD. That is a very good year in historical context with the Russell 3000 Value also mounting a solid comeback to double digit returns at +11%. Almost 8% of that 11% came over this past month.
Financials have been on a wild ride in 2023 and notably with the March regional bank crisis. Fears of credit contraction did not play out as initially feared as aggressive Fed actions and a few quarters of earnings season gut checks and regular disclosure reduced anxiety.
Meanwhile, the recent shift in FOMC language, success on the inflation front, and related stark changes in market sentiment across Nov and into Dec have lit a fire under any risk whether rates or fundamentals. It can be seen as defensive and irrational but also arguably excessive and very much reliant on Goldilocks becoming more like Athena with god-like powers.
As we cover below, the YTD total return rankings show regional banks out of last place with the interest rate sensitive Utilities ETF (XLU) now bringing up the rear at -8.2%. For banks, the idea of material front end easing is positive for interest margins while lower longer term rates have intrinsic benefits for the real estate cycle and potential valuations. The theory is that lower rates translate into lower loss provisioning needs and better recoveries for those subsectors of real estate that remain troubled.
The various buckets of real estate are more complex than “CRE good vs. CRE bad” (see Construction Spending: Demystifying Nonresidential Mix 5-9-23) with offices as a subsector justifiably being the target of bears in 2023. That is a distinctly smaller portion of financed real estate exposure while growth areas in new construction are about economics and less about LTV and default risk evaluation.
We are not heading into a commercial real estate crisis of the sort that crippled banks from 1988 to 1992 depending on the region and bank. That crushed many regionals back in the early 1990s and had Citibank on the Fed hotline. For 2024, a few cuts by the Fed will not provide a massive reduction in tenant credit risk or fill CRE space. B and C properties have idiosyncratic issues separate and distinct from Fed action and the UST curve even if those factors matter.
We see energy at the bottom of the return list above as energy struggles, but energy is always struggling. That is, except when it is booming. As we covered in our recent historical lookbacks at key inflation drivers (see Inflation Timelines: Cyclical Histories, Key CPI Buckets 11-20-23), there is a rich history of boom and bust in E&P in the US going back to the regional economic crisis in the oil patch in the late 1980s. Then there was the post-debt-financed shale boom that started to unravel back in late 2014 on the way to an explosively bad default cycle for oil and gas operators that featured more than a few single digit unsecured recoveries.
Crude oil spikes that flow downstream into steep inflation moves are bad for consumers and part of CPI inflation stories just as oil price collapses are associated with deflation effects. Unfortunately for whoever is in office at the time (Nixon/Ford, Carter, Biden), food inflation comes in fits and starts but we almost never see aggregate food deflation (despite pockets of commodity weakness by food groups such as corn, beef, etc.). The ability to reprice the “menu” and mix of prices in “Aisle 3” can haunt elections. It just has not happened in a long time.
Energy, OPEC+ supply discipline (or lack of discipline and the risk of a potential Saudi response), and the next leg of the policy journey for US upstream and mega-projects such as LNG will likely be a big part of the political debate in an election year. Energy equities (and many bond issuers) can get wagged by geopolitical stress and hot wars in the Middle East.
That volatility has translated into wide swings in energy equities this year as we cover further below in the ETF returns. Despite Russia-Ukraine and widespread disruptions, the large Energy ETF (XLE) sits in the bottom quartile of the YTD ETF returns in our comp group of 31 benchmarks and ETFs.
The return snapshot with a quick visual…
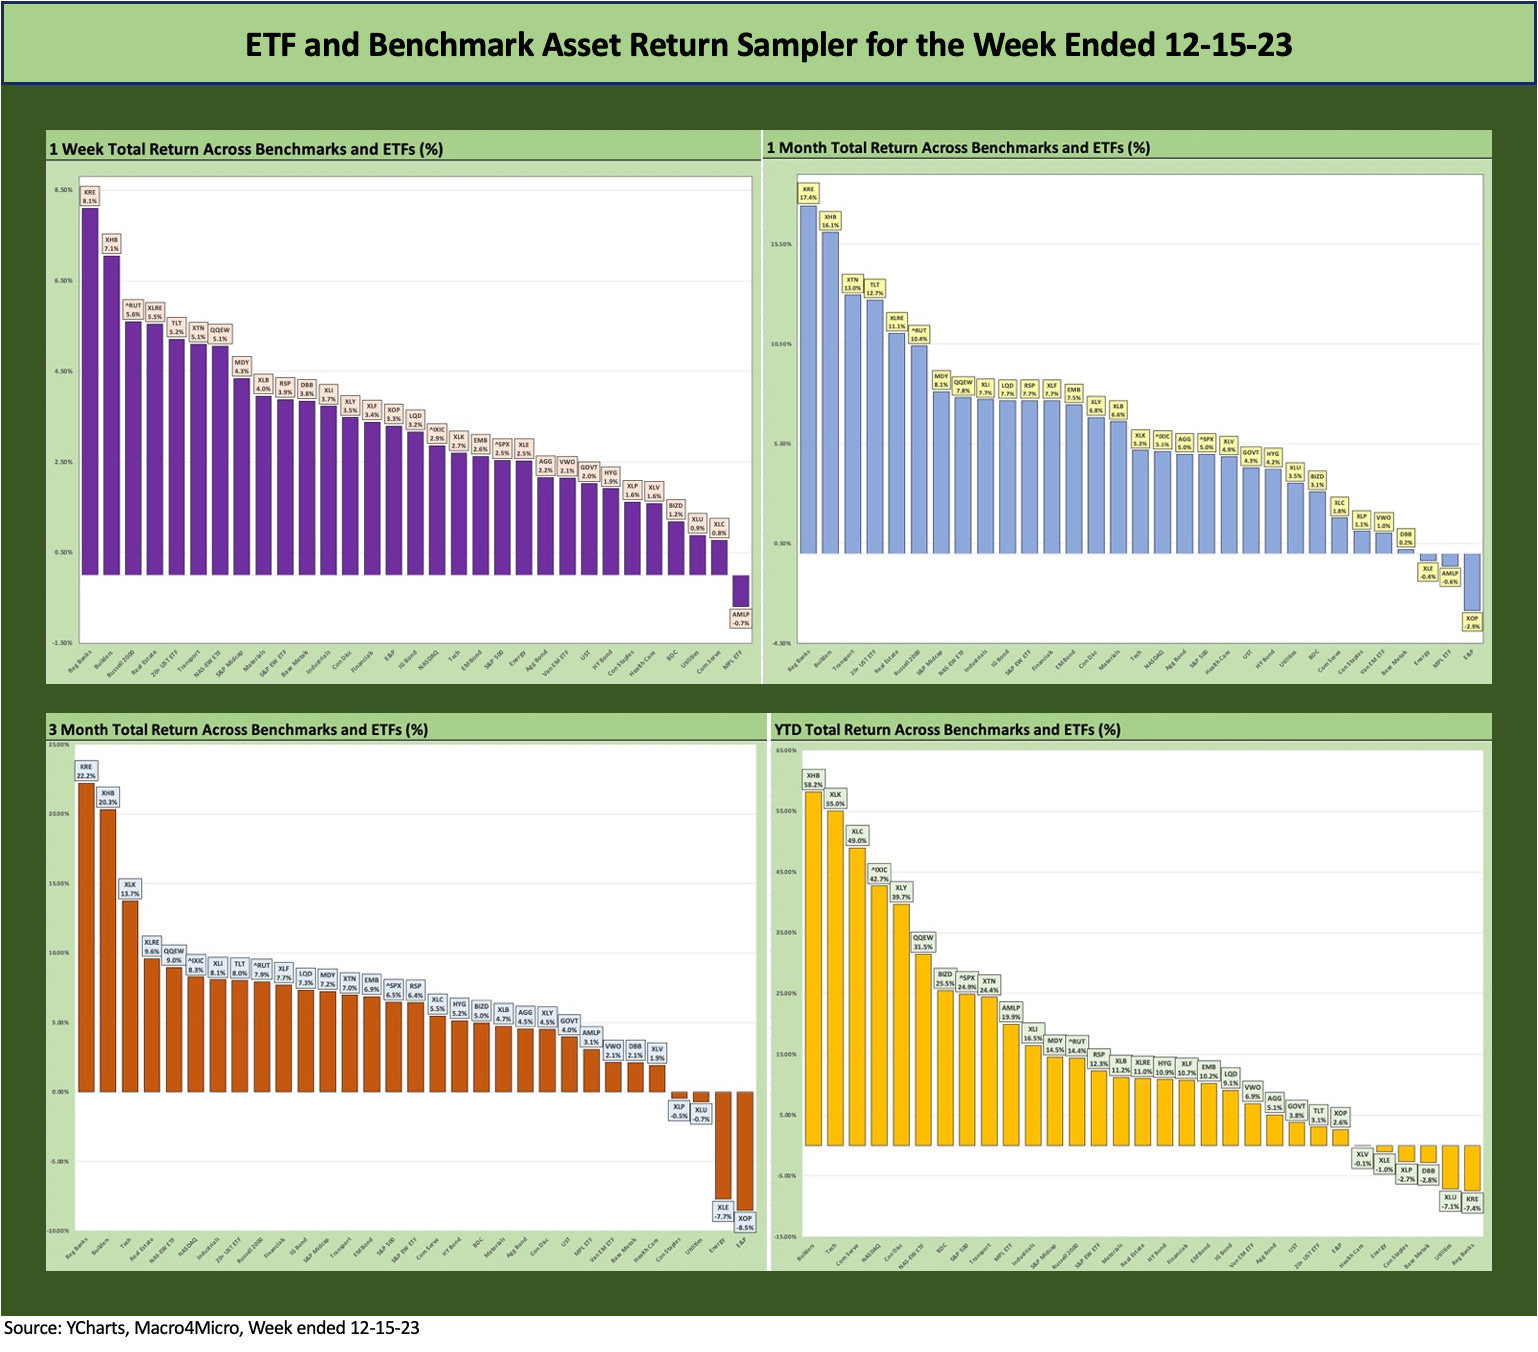
We started dropping in the following box of four different time horizons in the weekly. The chart grouping allows for an easy view of the shape of returns for each period (1-week, 1-month, 3-months, and YTD). We occasionally see all negatives or all positive, but we found it to be an easy way to look at the current configuration and how it may have reshaped in just a week. First, we show the box of 4 for this week and then we show one for last week. The last two weeks were overwhelmingly positive, so the visual shift is more about seeing less in the red zone YTD and the winners are higher on the left.
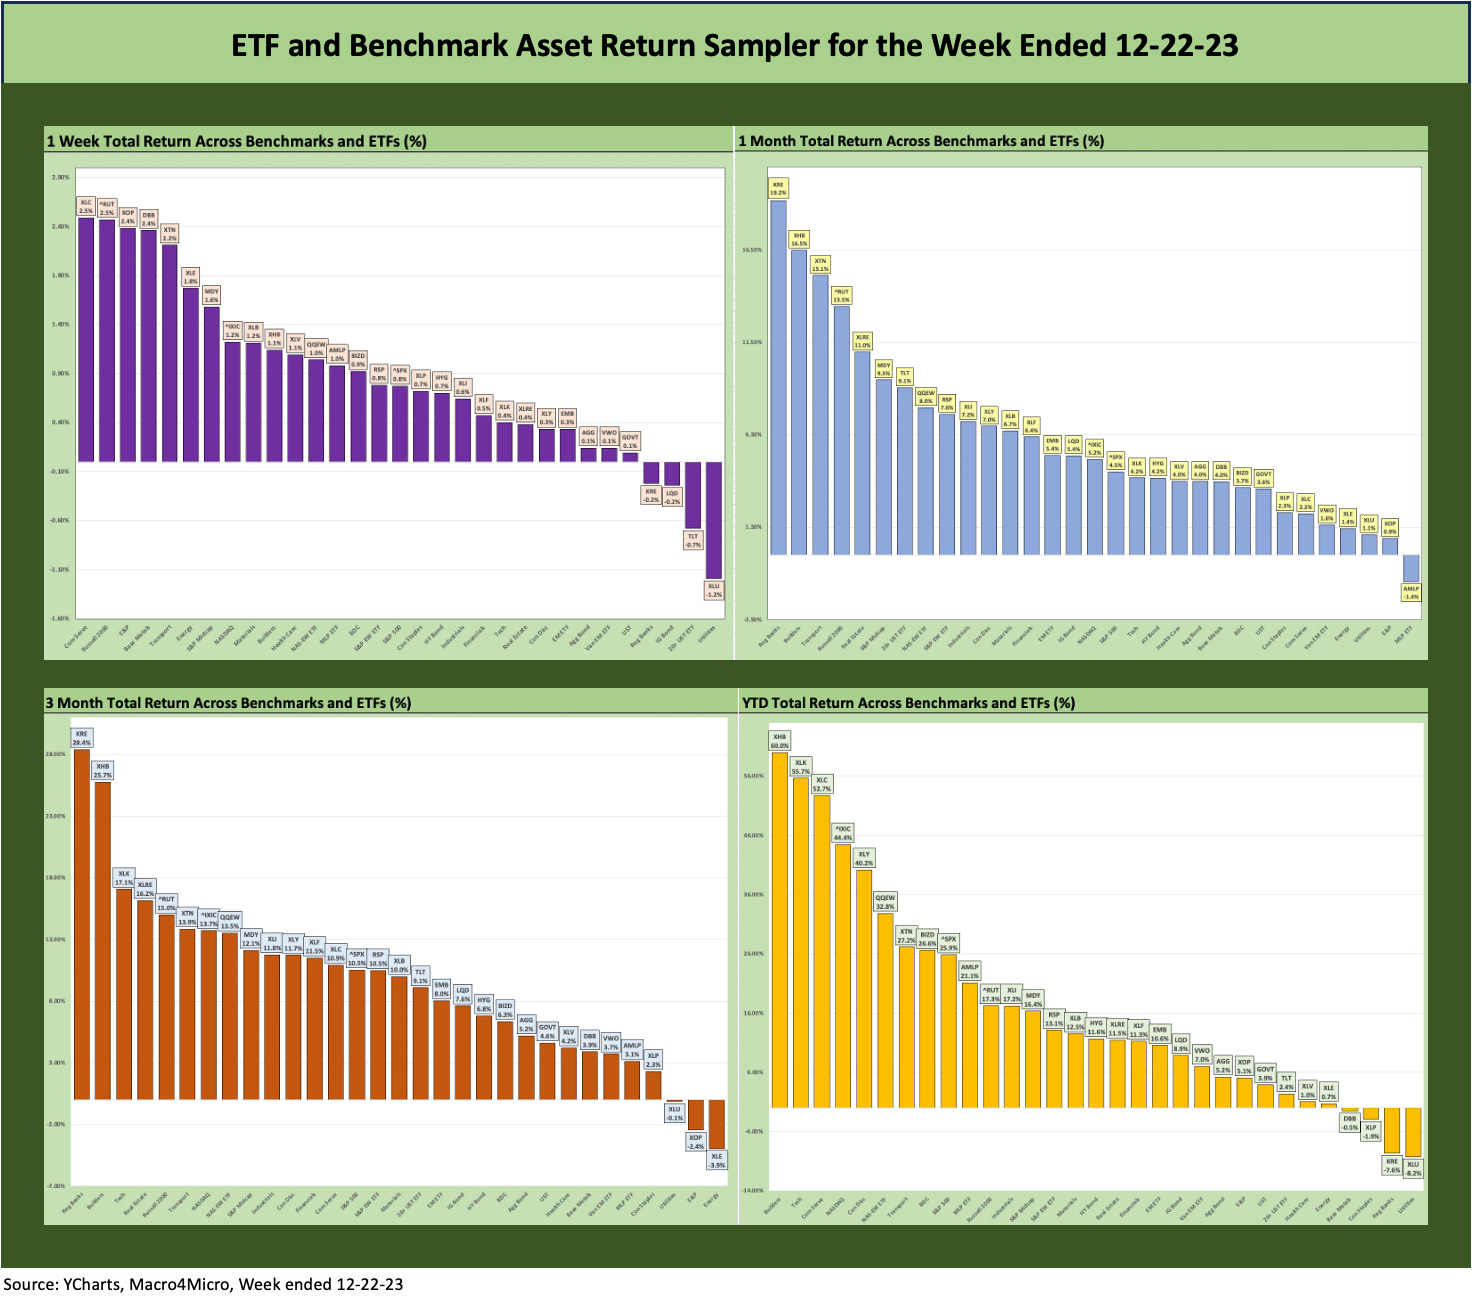
The above chart mix is covered in more granular detail below, but a very strong month at 30-1 positive for 1-month fed into a 3-month horizon with only 4 negative with 2 energy (XLE, XOP), 1 base metals ETF (DBB), and 1 Utility ETF (XLU).
Time horizon asset returns…
We recently added three more ETFs to the mix, including one for the SPDR S&P Midcap 400 (MDY), one for Emerging Markets Equities (Vanguard FTSE Emerging Markets ETF (VWO)), and one for the iShares JPM Emerging Market USD Bonds (EMB). While our primary focus is USD risk assets and more focus on US credit, we needed some EM representation in EM equities and bonds as comps with so many investors reassessing their global asset allocation strategies.
We also needed a benchmark to connect the large caps and small caps. Midcaps have a wide variety of valuations with both growth companies and old school value plays across the diverse mix of industry groups. Midcaps also have a fair amount of overlap with the HY issuers base and credit-intensive sectors generally with less of the narrow issuer distortions that we see in the broad market large caps.
The Magnificent 7 heavy ETFs…
Some benchmarks have a few issuer concentration elements that leave them wagged by a few names. When looking across some of the bellwether industry/subsector ETFs, it is good to keep in mind which narrow ETFs (vs. broad market benchmarks) get wagged more by the “Magnificent 7” including Consumer Discretionary (XLY) with Amazon and Tesla, Tech (XLK) with Microsoft, Apple, and NVIDIA, and Communications Services (XLC) with Alphabet and Meta.
1-week returns
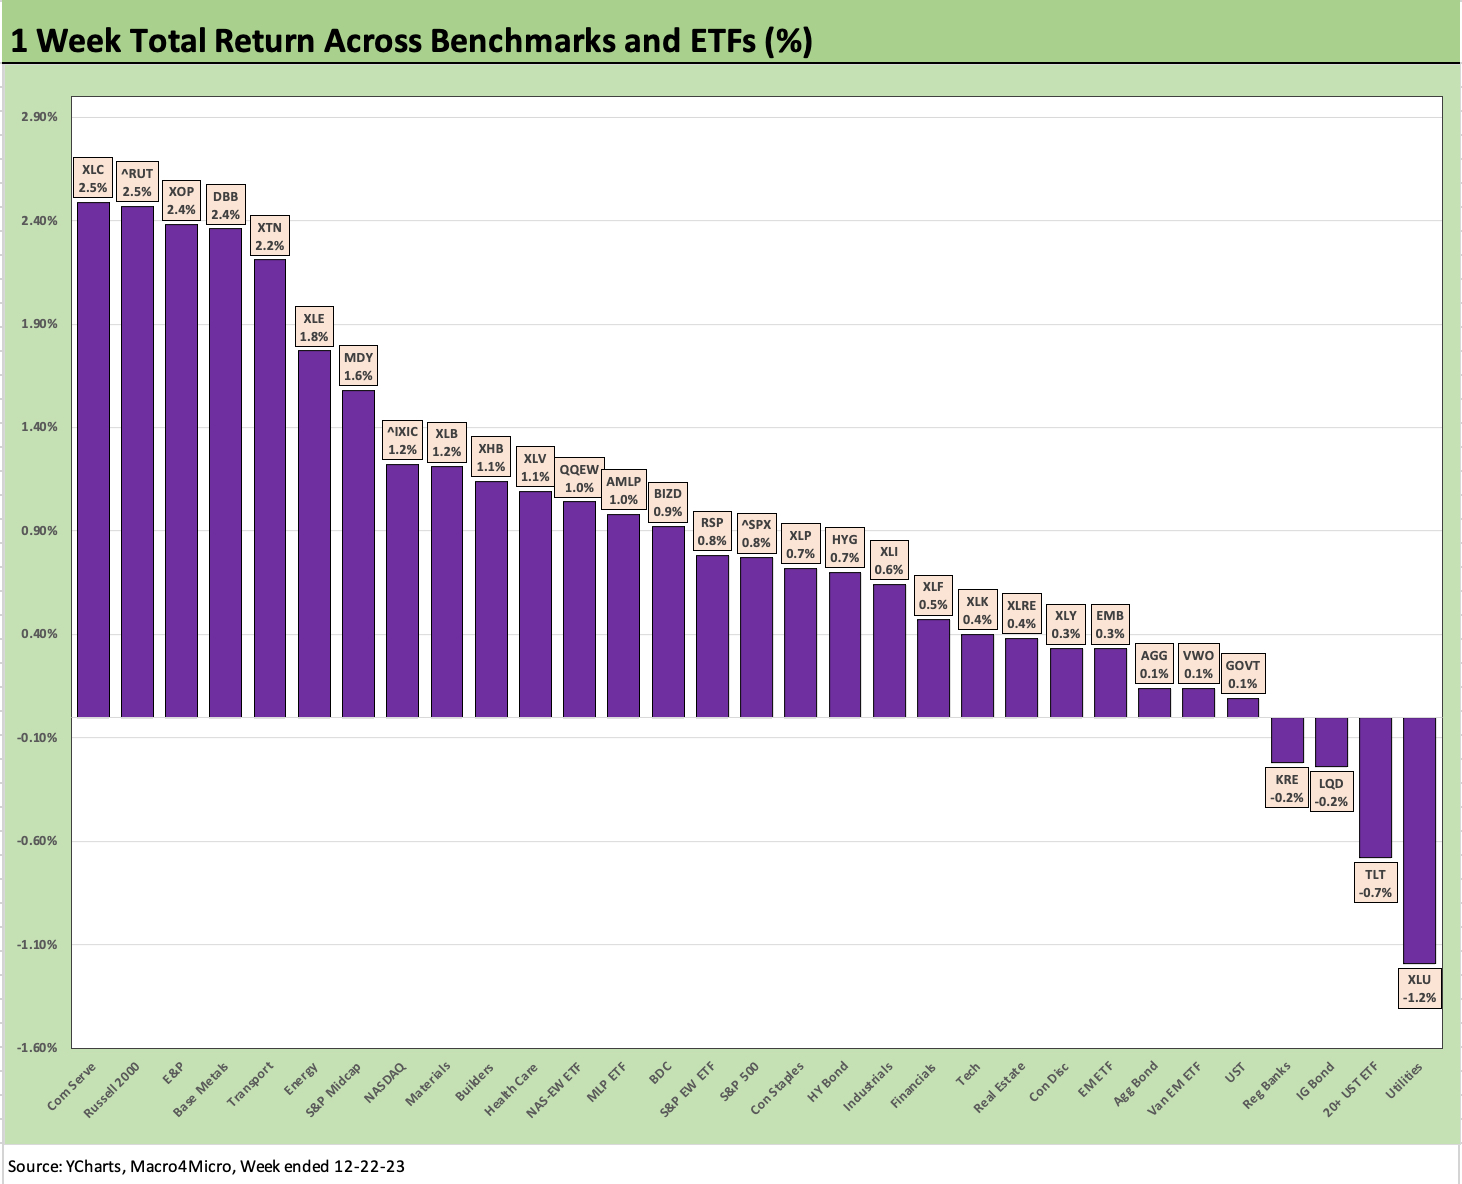
The 1-week return numbers are winding down with a flourish at 27 positive and 4 negative. We see some of the recent laggards in energy (XOP, XLE) and base metals (DBB) and small caps continuing an impressive close to the year after running from negative YTD in Oct 2023. Russell 2000 has moved all the way to +17.3% YTD to end last week. That is over a 20-point swing since late Oct after +13.5% for the trailing month and +15% for the rolling 3 months. Russell 2000 has a more US-centric profile that many take as a useful indicator for US cyclical sentiment.
After a burst of good news on duration, the past week was quiet, and we see the -0.7% on the duration-heavy 20+ Year UST ETF (TLT) while the interest sensitive Utility ETF (XLU) brought up the rear. For the week, we see the IG bond ETF (LQD) in the red and the UST ETF (GOVT) and Agg Bond Index ETF (AGG) slightly across the line in positive range. We also see EM bonds (EMB) and EM Equities (VWO) positive but rounding down to zero.
1-month returns
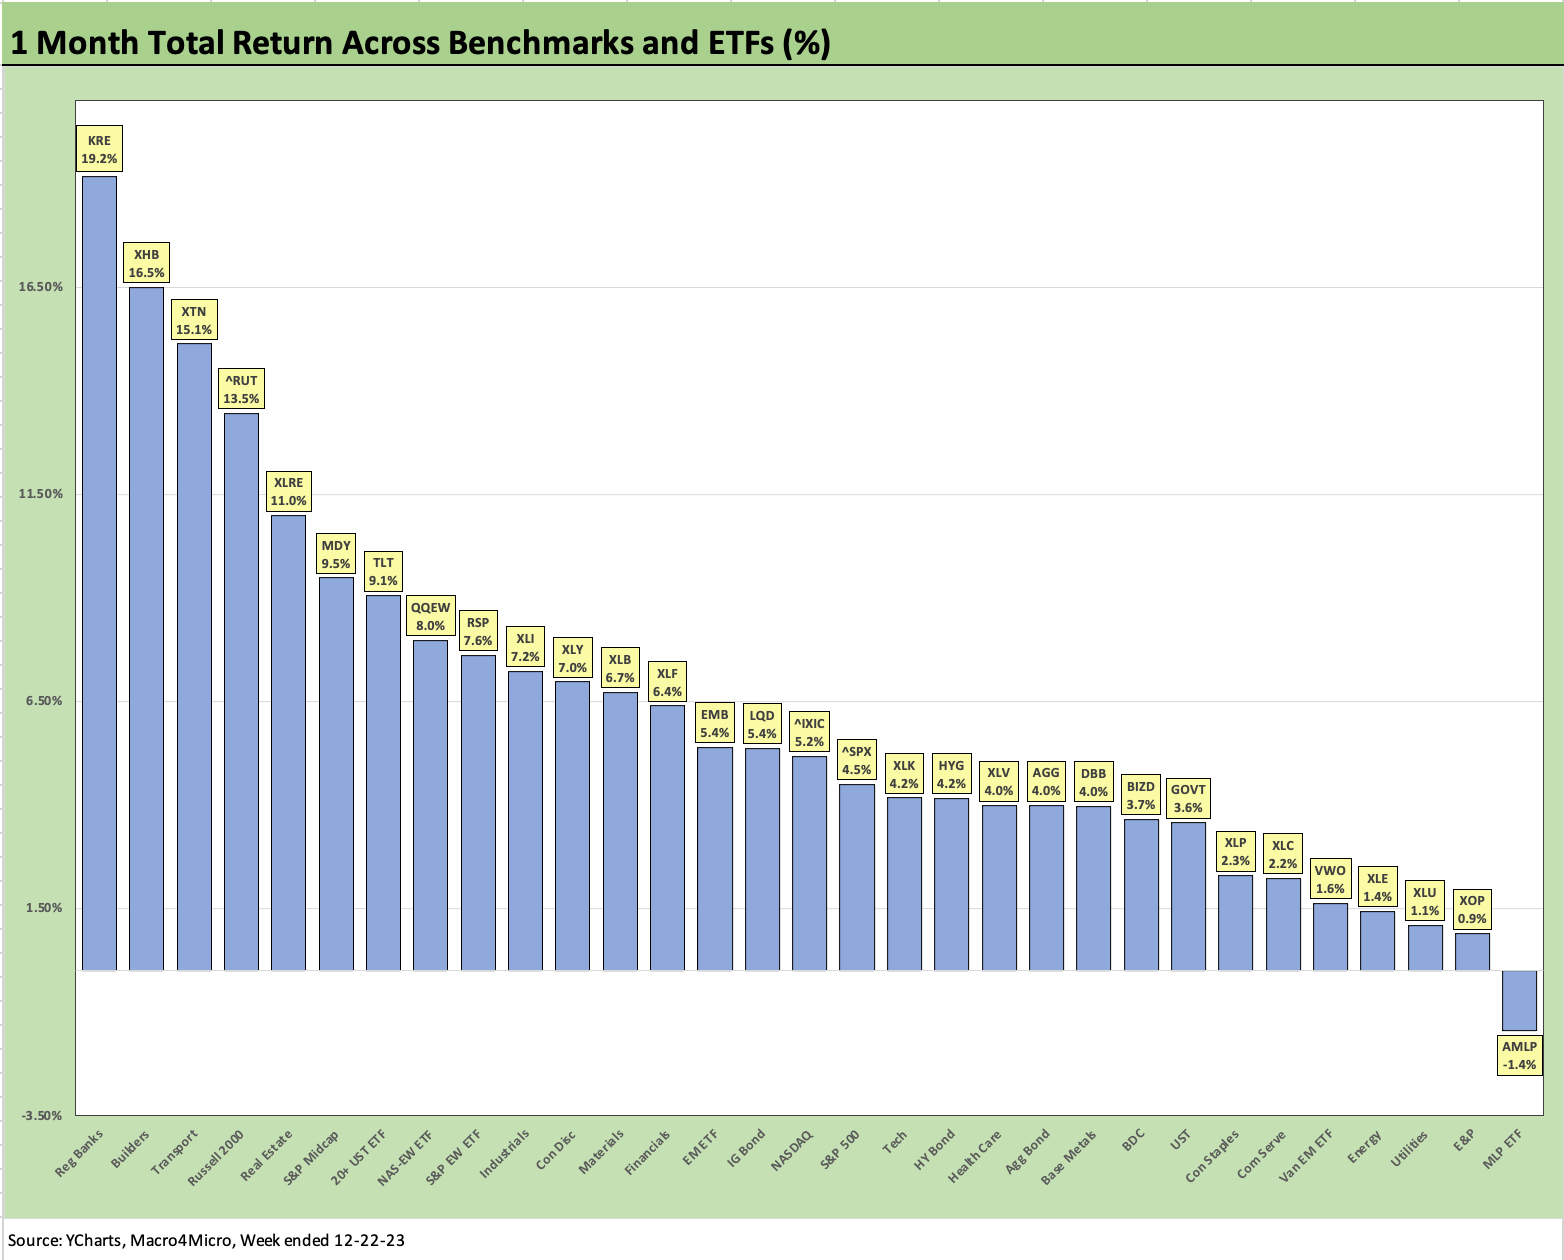
The 1-month numbers across the 31 benchmarks and ETFs came up roses again at 30-1 for the monthly score, and only Midstream Energy (AMLP) was slightly negative at -1.4%. The bottom of the list includes E&P (XOP), Utilities (XLU), and Energy (XLE) along with EM equities (VWO).
Among the most notable winners of late on the yield curve action and sector reevaluation has been Regional Banks (KRE) at #1 for the trailing month and #1 for the trailing 3-months. That has pulled KREs deeply negative return numbers up to a YTD return of -7.6% and into second to last place. As a frame of reference, KRE returns YTD stood at -32.5% as of the week ending 10-27-23. That is one heck of a comeback.
The 1-month return for the Builder ETF (XHB) at +16.5% and 3-month returns for XHB at +25.7% shows the growing market confidence in the builders. The rolling reporting seasons of the major builders kept bringing very good news on cash flows and documenting the reality of the Builders’ ability to grow share profitably even in the face of mortgage rates that crossed 7% on the way to 8%. Now that 30Y mortgages are back in 6+% handle range, the outlook remains favorable. As we cover in our homebuilder research, the major builders have proven their business models, demonstrated the value of their incentive strategies, and displayed astute working capital management even in this environment.
3-month returns
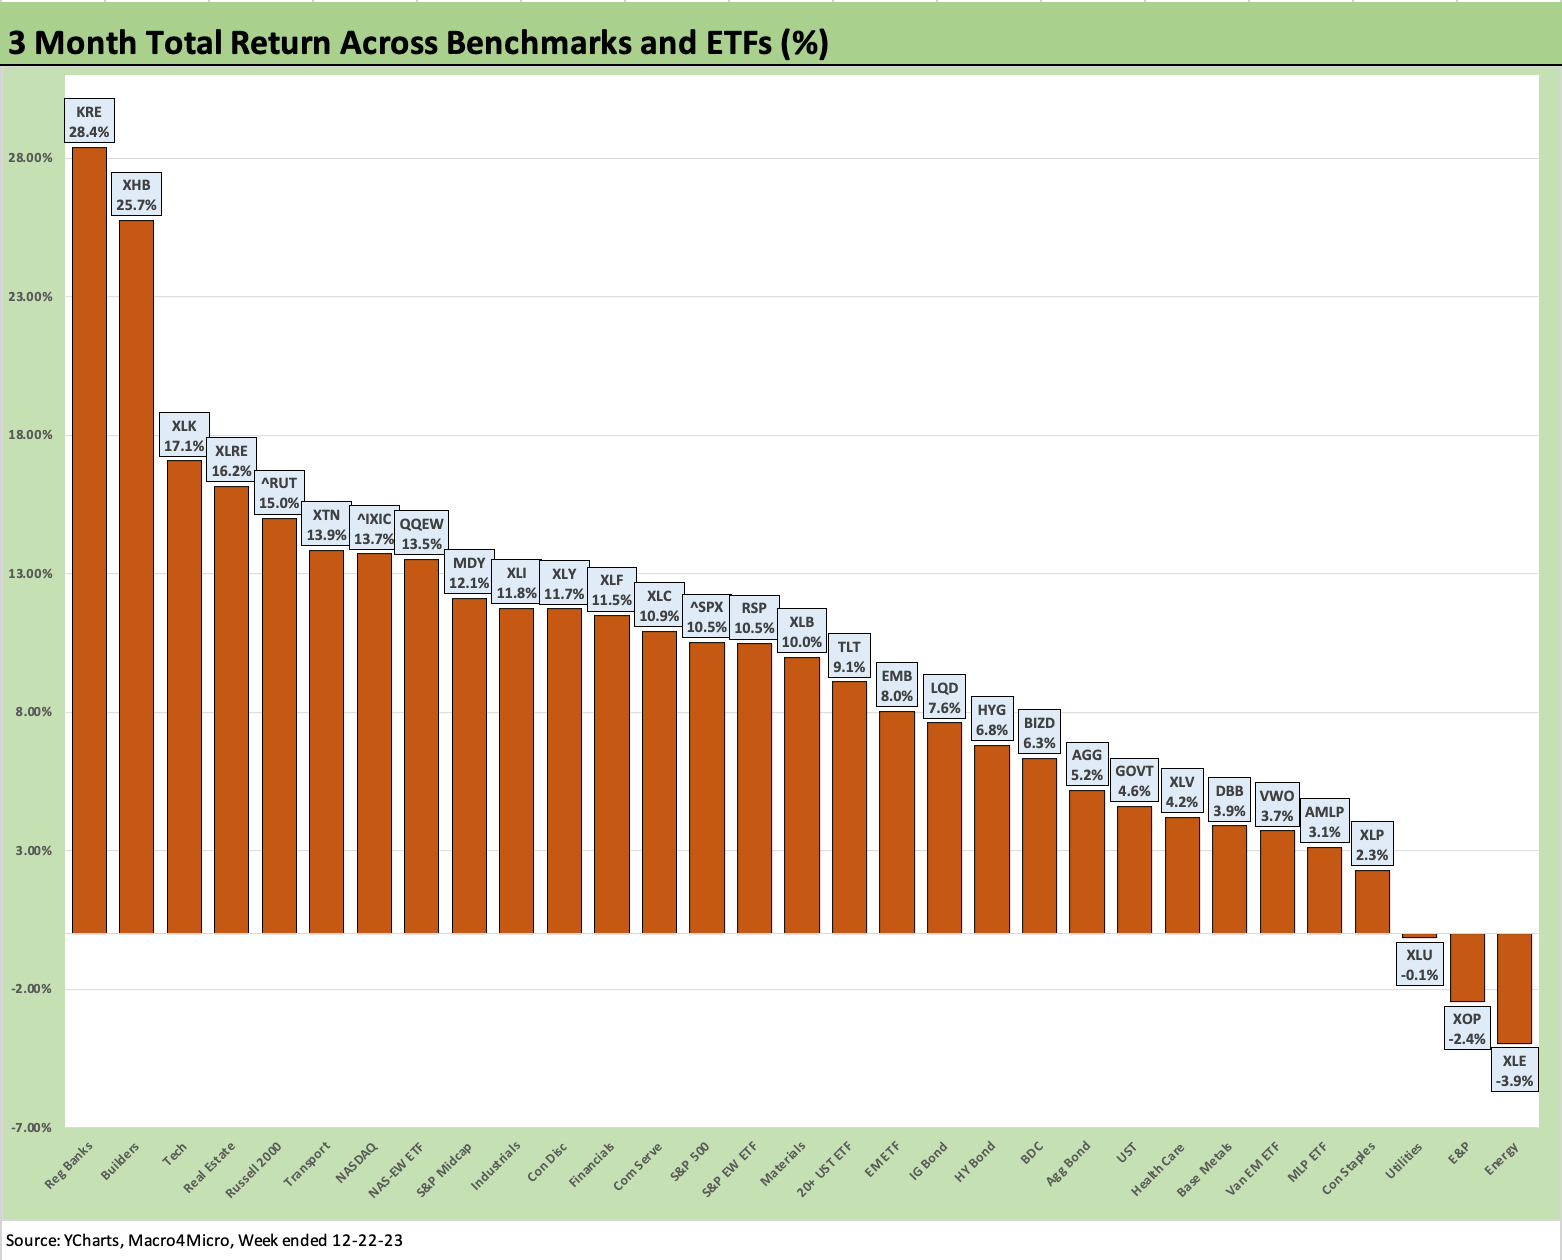
We already covered some of the 3-month stories in earlier time horizons such as the Regional Bank (KRE) comeback and the home run for Builders (XHB). We also addressed the rebound of the interest rate sensitive real estate equities earlier with XLRE posting a tough year but a few very good months in the home stretch. XLRE has worked its way back to the middle of the pack YTD at +11.5%. Clearly there are pockets of major trouble in real estate but also winners with successful business models and valuable asset profiles that deliver respectable dividend income.
With price-driven equities on a roll, the fixed income ETFs have done well in asset class context but are more clustered in the 3rd quartile with the most duration sensitive bond subsector leading with TLT and LQD. HYG ranked behind LQD over the short term as duration returns trumped HY spread compression.
YTD returns
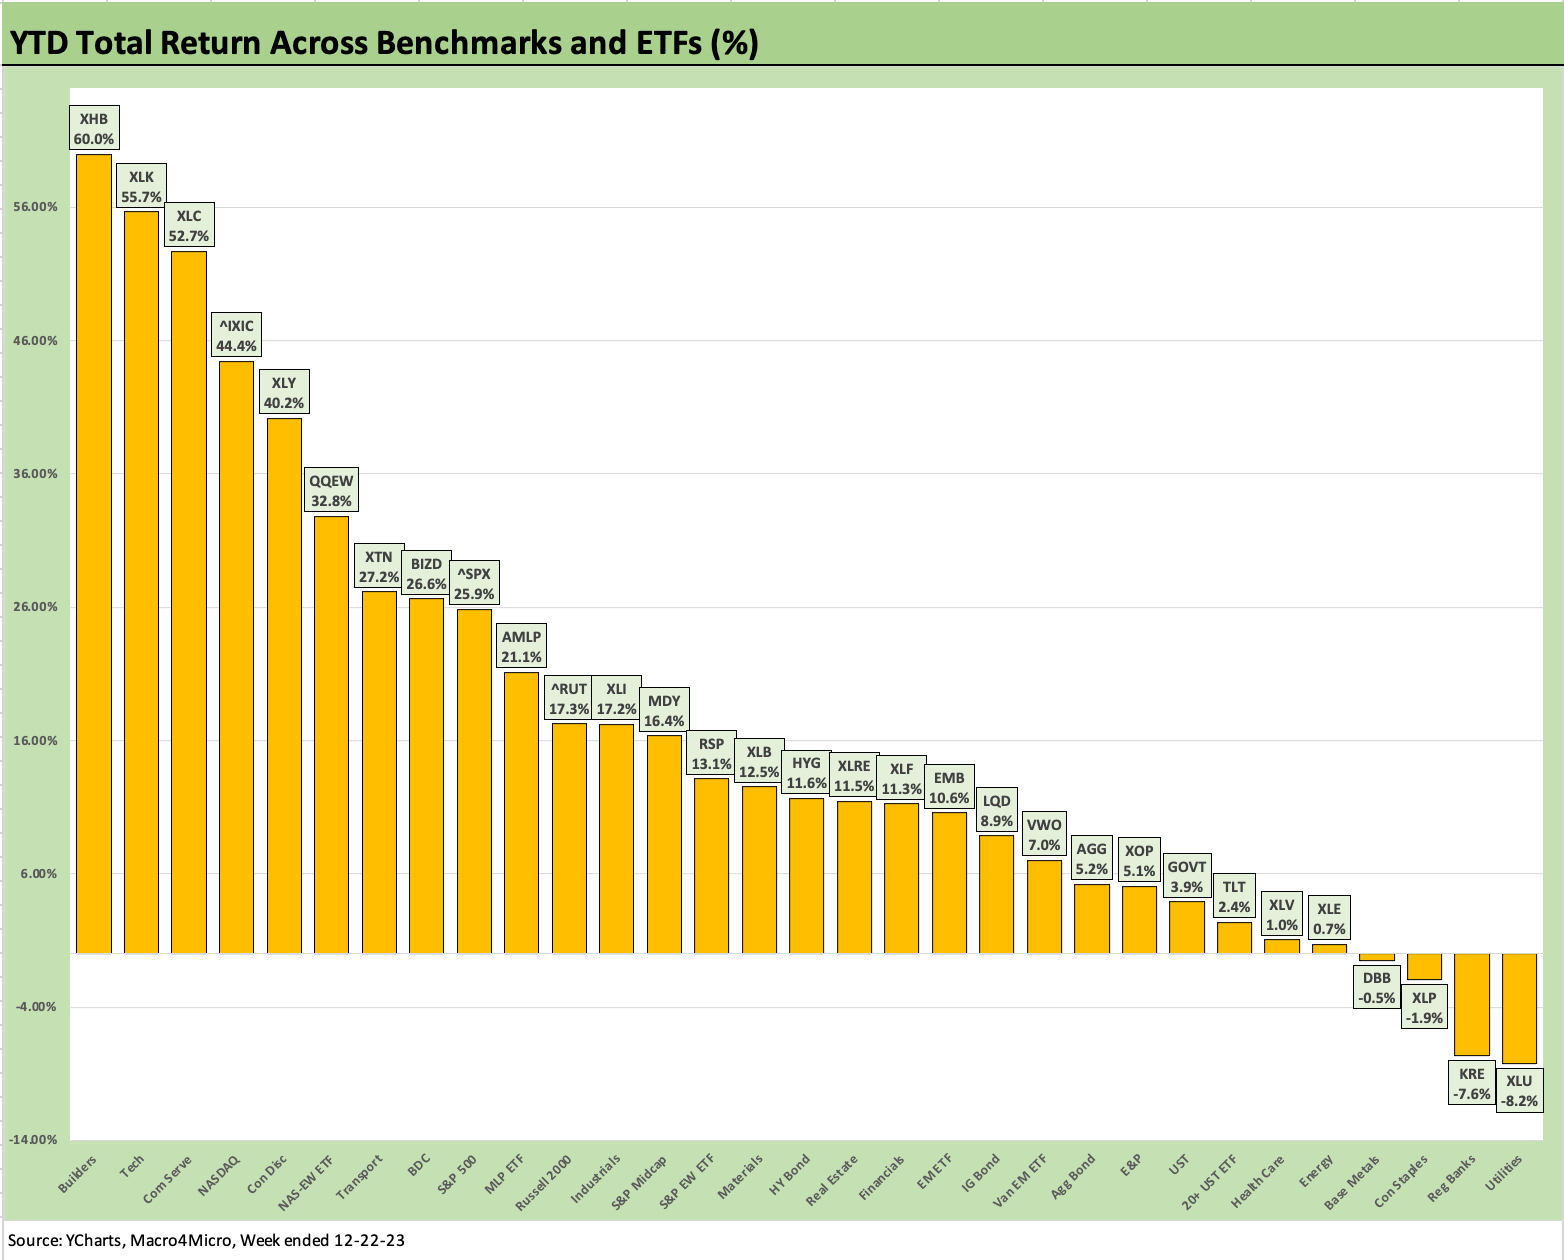
The YTD return lineup is 27-4 with the Hi-Lo return differential at over 68 points when framing Builders (XHB) vs. Utilities (XLU). If we throw out the Hi and Lo, we still get over 63 points of return differential for Tech (XLK) vs. Regional Banks (KRE). As we always note, it is differentials like this that will always encourage active strategies even if the dominant trend has been passive. It is part history and part human nature (I am just not sure what the mix of parts are but likely vary by investor).
As we get closer to the year-end derby. Builders (XHB) is still in the lead ahead of a group of tech-heavy benchmarks and Magnificent 7 led ETFs (XLK, XLC, NASDAQ, XLY, and QQEW). The only other ETFs to squeeze into the top quartile included the cyclically sensitive transports (XTN) and the BDC ETF (BIZD).
BIZD results are especially interesting to the many institutional investors and managers looking at private credit and direct lending as evolving markets now have a lot of options to take credit risk and drive income and cash flow returns off a bigger menu of alternatives.
With a week to go, 2023 has become a stunningly strong year despite high fed funds and a steeply inverted curve along with the lingering effects of a regional bank crisis, a major land war in Europe, an increasingly tenuous Middle East conflict, and tension with China and Russia. And last, but not least, we face a brutally ugly election on the horizon and a Congress that still needs to pass a budget. This was the same Congress that was leaning toward defaulting on US sovereign debt with the full support of the GOP party leader and former president. Yet the rally goes on!! After all, how could it get worse? (Don’t ask).
In the meantime, record high payroll, sharply lower inflation, a consensus for lower UST rates in 2024, a consumer sector that will not quit, and strong YoY growth in private domestic investment has been a recipe for economic success and high GDP growth.