Footnotes & Flashbacks: Asset Returns 8-13-23
We look at returns across a down week where good inflation numbers brought no rewards.
The past week took on the tone of the prior week with equity weakness in broad market benchmarks and duration suffering from upward migration of the UST curve.
Credit spreads have held in well in recent months as the regional bank anxiety eases, but bank credit standards are tightening as evident in the usual surveys with higher funding rates a fact of life.
Private credit availability and optimism around corporate bond demand remain mitigating factors to offset bank tightening.
The debate on repricing of credit risk in bonds and the direction of duration risk will pick up tempo into the fall as recession fears diminish.
The above chart updates the returns on the core mix of asset classes we watch each week in debt and equity. We line each asset class up in descending order of YTD total returns. The market exited July and entered the first half of August with a rough patch as the market saw two weeks of negative price action in equities and weak returns in broad benchmarks.
Meanwhile, the Magnificent 7 were shut out of the positive range the past week with all 7 in the red including a double-digit negative (-10%) for NVIDIA on the week. The Equal Weighted ETF for the S&P 500 (RSP) and NASDAQ (QQEW) edged out the market cap weighted benchmarks. NASDAQ is still posting a banner year despite the negative trailing month.
For now, the questions circling around the UST curve are keeping equity markets on edge, and the bulls are getting some pushback on China trends, fall season slowdown risk (not a contraction), potential disruptions from a UAW breakdown in September, creeping commodities and oil prices, and European macro pressures.
These are not new topics of debate and have been hanging around for a while (just substitute other industry labor deals from freight to transport). China and oil are more on the front burner in recent weeks.
Bonds have felt little joy on adverse UST curve moves. We look at the UST curve action in a separate Footnotes commentary (see Footnotes & Flashbacks: State of Yields 8-13-23). We still see HY comfortably ahead in the debt asset class with YTD total returns of 6.6% as spread compression north of 80 bps (using ICE index) and coupon income have set the pace for US HY.
In contrast, IG bonds are feeling the pain of the recent UST curve shift despite spreads being on the tighter end of the year in the +120 handle range vs. around +140 to start 2023 and +130 handles in June. EM USD Agg is running below the 1% line for the 1-month horizon and 3 months.
Duration setbacks have trumped the solid and resilient credit spread backdrop in credit markets with IG corporates and UST both in the negative zone in total returns for 1 months and 3 months. For the YTD period, IG is running at annualized returns below the par weighted coupon for US IG (3.9%). The UST index is just above 0% YTD.
Playing defense on the cycle had not been rewarding yet in high quality credit as the UST curve continues to gyrate on a number of other factors including heavy debt service (soaring interest expense of US government debt) and more deficit funding demands ahead running alongside refi needs for the UST market.
Inflation has not been the enemy in the recent UST longer dated curve trends. Aggregate fundamentals have not been a major threat despite the cyclical resilience since CPI has steadily declined in the face of solid jobs and mixed optimism around guidance in some key sectors.
The above chart updates the 1500 and 3000 equity benchmark returns. The fact that Growth has dominated YTD is old news, but Energy and Industrials are coming on strong over 3 months with double digit total returns for the period. Energy has been especially ramped up this past month after a lag through much of the YTD period. Oil prices have held up well around $83 after a sharp climb from the $74 range in mid-July.
For the YTD period, the main benchmarks we cover are all positive YTD and rolling 3 months. Real Estate (S&P 1500 Real Estate) has been the main laggard in our sample over 3 months with 2.7%. Russell 3000 Value is second to last at 7.7%. Industrial is now ahead of Growth over 3 months and Energy even further ahead. The short-term 1-month period shows Russell 3000 Growth in the red and the same for Real Estate, which is very much a subsector and issuer selection game at this point.
ETF and benchmark returns…
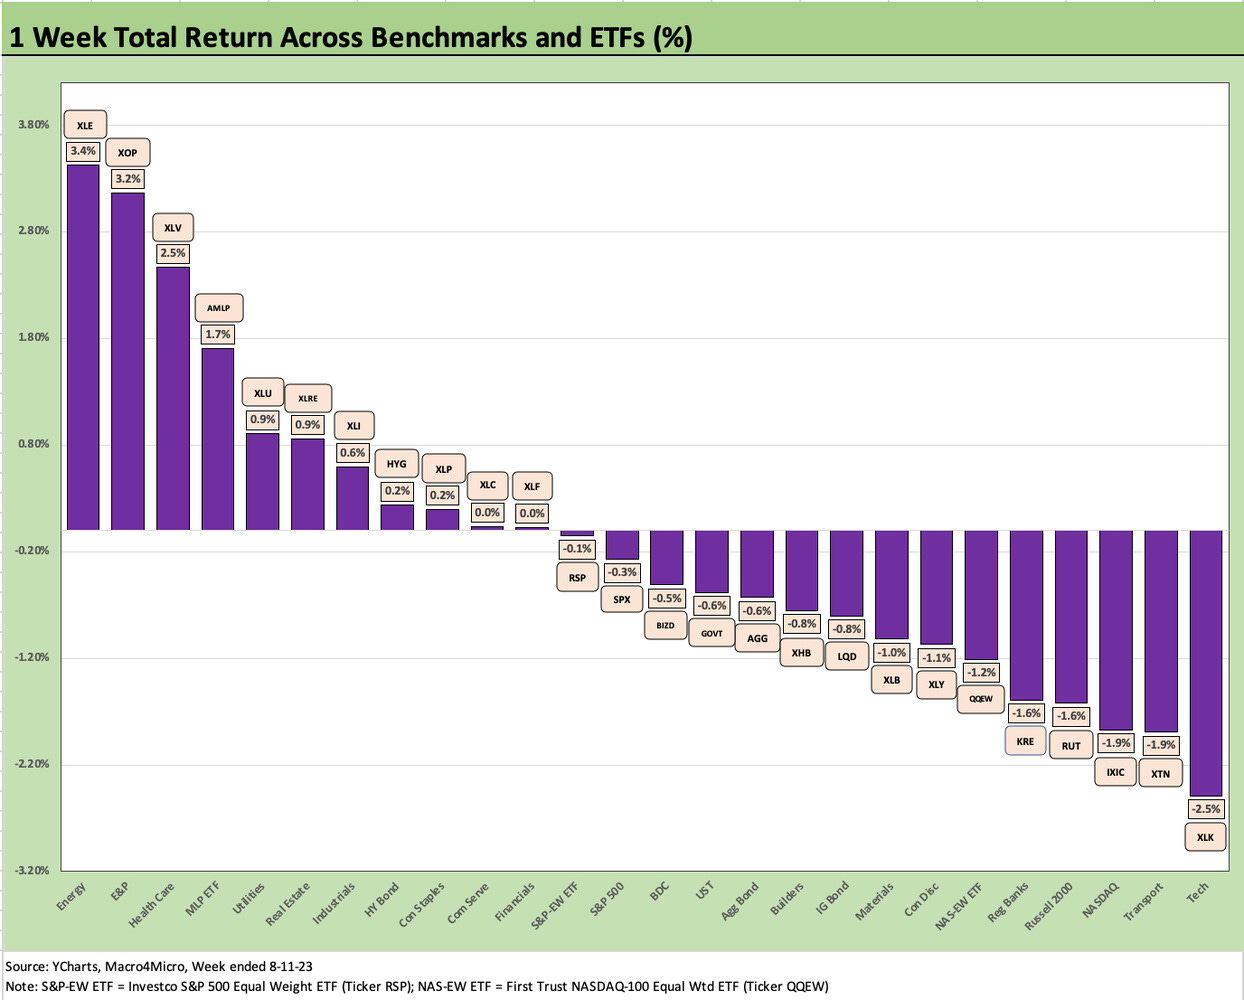
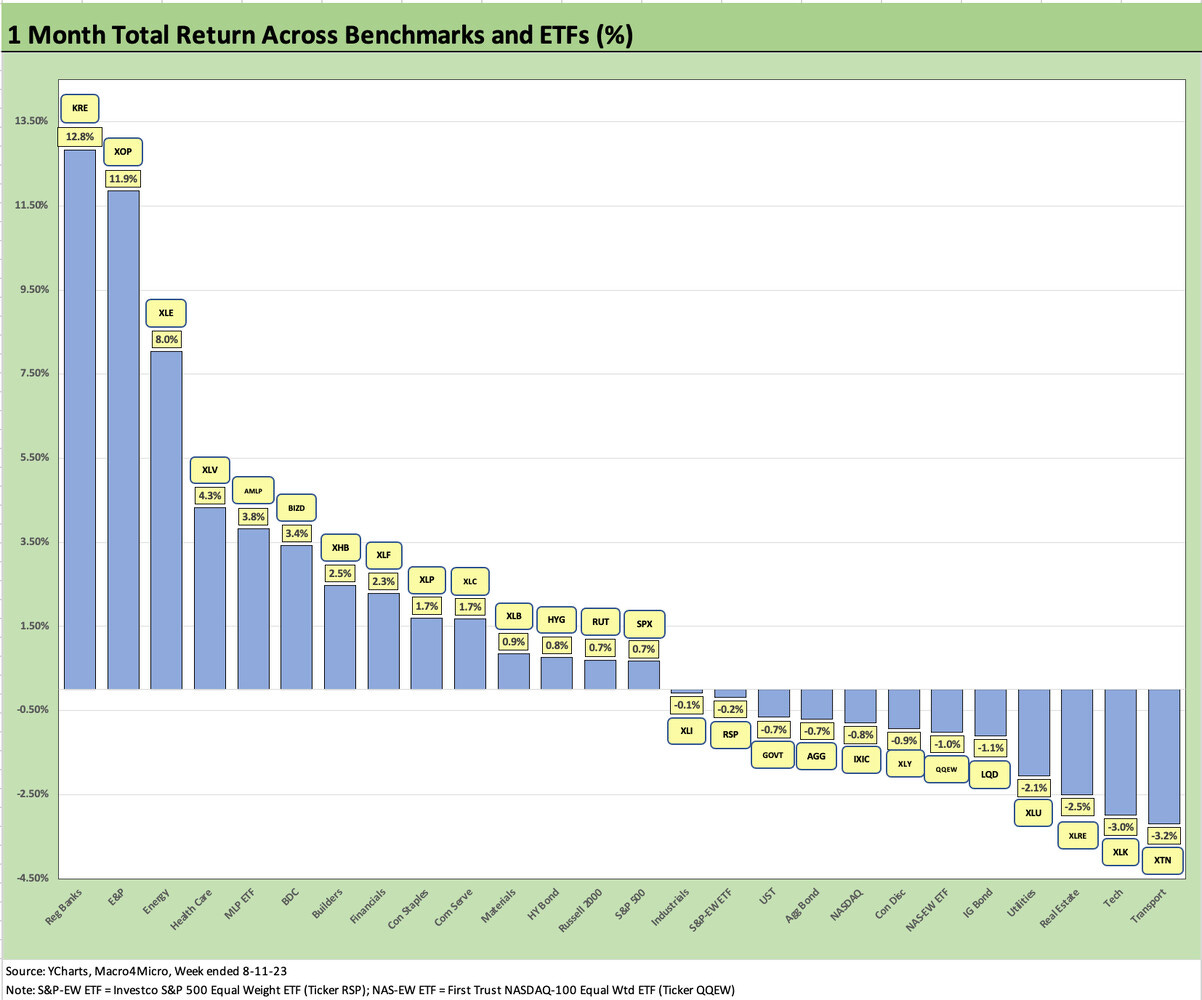
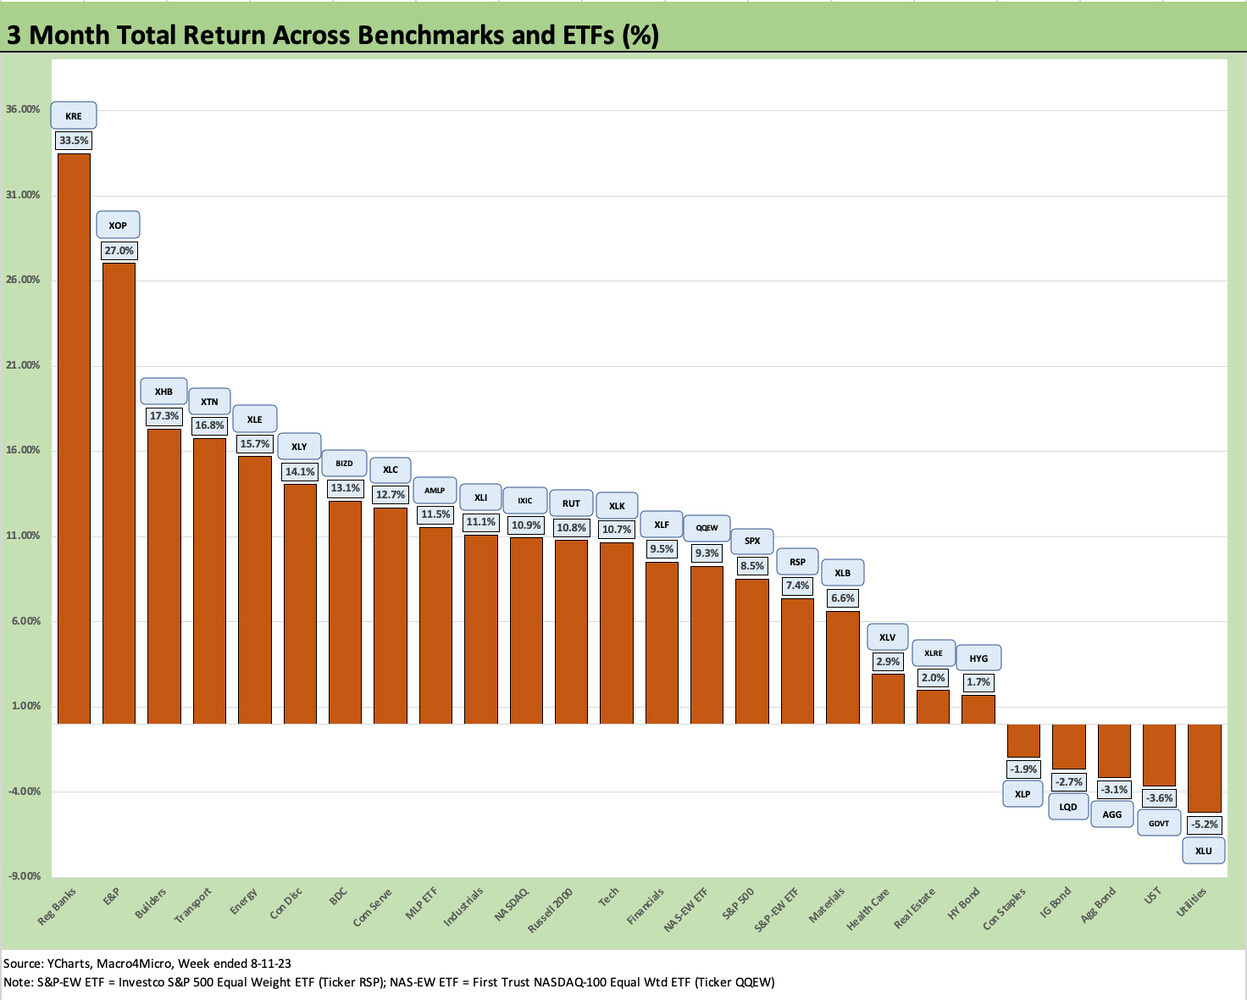
In our next three asset return charts, we cover 1-week, 1-month and 3-month time horizons. We look at 26 different benchmarks and ETFs. We recently added equal-weighed ETFs for the S&P 500 (RSP) and NASDAQ 100 (QQEW) given the market cap weighted distortions in the total returns for those benchmarks that had been driven for much of the year by the mega-names.
The 1-week charts highlight the second bad week in a row for Tech stocks with the overall score for the 26 ETFs and benchmarks detailed above at 11 positive and 15 in negative range. The Tech ETF (XLK) is sitting on the bottom and NASDAQ is third off the bottom with the Transport ETF (XTN) second off the bottom. Transport is interesting since it has been a very good performer earlier and has a cyclical flavor that ties into shipment volume, tonnage, and working capital cycles.
The Bottom 5 is rounded out by the small cap Russell 2000 (RUT) and the Regional Bank ETF (KRE) that was hit by the Moody’s downgrades this week. We also see 3 of the 4 fixed income ETFs in the red with HYG just above the line in positive territory.
The setback for the week in KRE did not derail KRE’s spot as #1 for the trailing 1-month time horizon as well as trailing 3-month period. The rebound in regional bank equities off the bottom has kept rolling even if most names are still in negative range since early March and for the year. The recent relief rallies in regional banks have benefitted from two quarters of constructive earnings reports under their belt. There is still a lot of doubt on the challenges ahead for interest margins and asset quality angst – notably in real estate.
Moody’s downgrades of banks and watchlist commentary reflect catching up to the headlines and due diligence updates that presumably they should have had well in hand months ago. We had looked at a cross-section of the regionals in our return commentary to end July (see Footnotes & Flashbacks: Asset Returns 7-30-23). That sector will remain skittish after the market’s first major experience with an online bank run.
The superior performers on the week include 3 Energy ETF names in the Top 5 (#1, #2, and #4) with diversified energy ETF (XLE) on top followed by E&P (XOP) at #2 and Midstream ETF (AMLP) at #4. The other two in the Top 5 were part of defensive sectors in Healthcare (XLV) and Utilities XLU). The defensive names weighing in near the top might be seen as a side-effect of the anxiety in the equity markets the past two weeks as Tech sold off and “corrections” and “dip” debates ruled some forums.
After such a heady run for Tech, we see higher interest rates and second guessing on valuation or “too far, too fast” commentary on AI valuation. There are ample excuses to get nervous with oil prices higher, China catching a lot of bad macro headlines, bank lending fears, and European cyclical worries among others. It is a good exercise to second guess the direction of the moving parts, but employment numbers and CPI progress tend to offer the best relief when framing economic fundamentals.
The trailing 1-month period shows balance at 14 positive and 12 in negative range. As discussed above, the 1-month numbers have Regional Banks (KRE) still in comeback mode despite the downgrades of the past week. There is still ample room for disappointment subject to many of the same debates that revolve around the UST curve and the broader equity markets on asset quality and sustained growth and how that all flows into Fed policy and inflation.
We see 3 of the 4 fixed income ETFs in negative range, but the sharp move lower in Tech and Transport brought up the rear. For Transport (XTN), we have been seeing some good numbers there in recent months (XTN is still Top 5 over trailing 3 months) and the sharp reversal is one to watch. The XTN is comprised of a well-diversified mix of transports and is heavy on freight and logistics names. The collapse of Yellow got some headlines with its somewhat unique set of issues, but pressure on pricing/rates tied to capacity vs. demand and questions around where the inventory cycle and volume cycles go from here is the bigger cyclical variable heading into the fall. Something to watch.
The 3-month chart reminds us of why the UST curve was getting nervous as 21 of the ETFs/Benchmarks were positive and 5 were negative. Of the 5 negatives, 3 were fixed income ETFs (LQD, AGG, GOVT) and two were defensive equity sectors, Staples and Utilities. We see 13 of the winners (half the lineup) with double-digit returns and from a broad cross-section of industries.
The big winner for the 3 months was the Regional Bank ETF at over +33% followed by E&P (XOP) #2 with +27.0%, Homebuilders (XHB) at #3 with +17.3%, Transport (XTN) at #4 with 16.8% and Diversified Energy at #5 with +15.7%.
Notable subsectors in the Top 10 included the BDC ETF (BIZD) at #7 with +13.2% as confidence in the cycle, higher earnings rates on its floating rate assets, and two quarters of generally good news around asset quality have been reported with pockets of dividend increases and special dividends.
There will be much to sort out around the cyclical and consumer sectors into the early fall around the shape of the UST curve, oil prices, China news, and the threat of a US government shutdown on a longer list.


