Footnotes & Flashbacks: Asset Returns 8-6-23
We look at asset returns in a bad week for equities, a UST steepening, and a downgrade of the US credit rating.
We look at the asset return mix across debt and equities for the first week of August and the July wrap-up.
While a bad week for stock and fixed income alike, more bears seem to be abandoning their post and more year end stock market targets are rising on the street.
The negative return week was tied to a mix of factors from a broader equity sell-off to a poor stretch for duration as the longer end of the curve steepened.
The downgrade of the US credit rating got more airtime in headlines since it has an inherent political flavor, but the substance was self-evident in that sovereign debt metrics are much worse than the old days and the US is a dysfunctional nuthouse (outhouse?) in Washington.
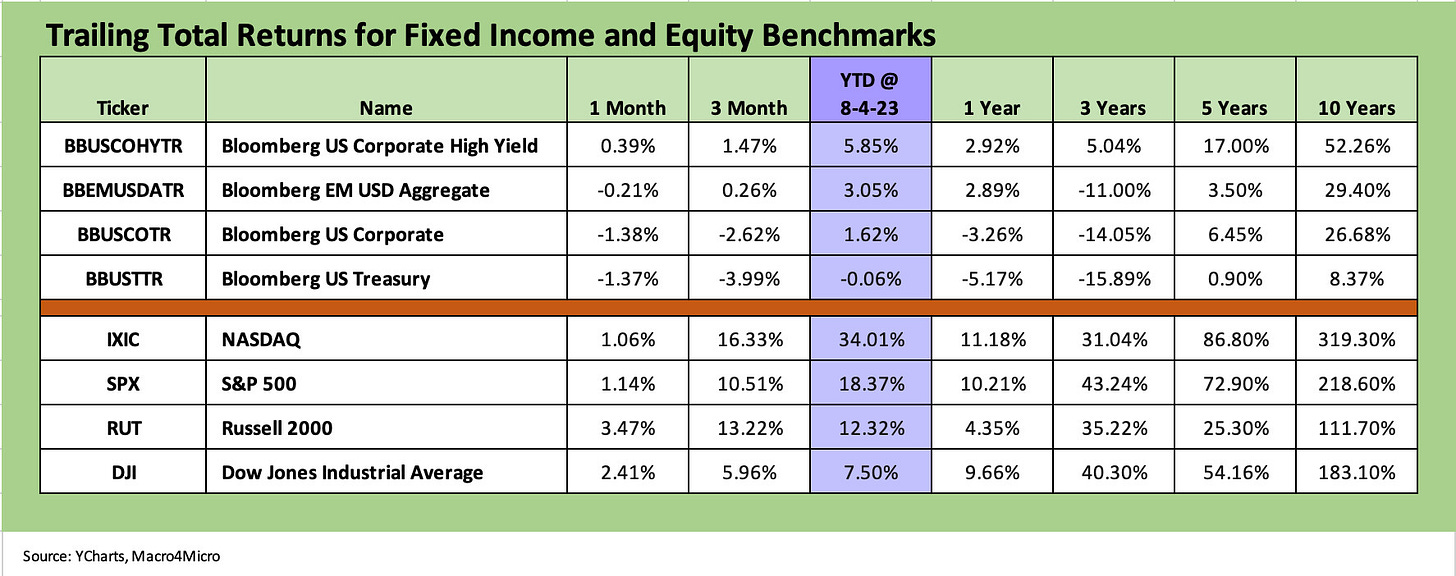
The above chart updates the returns for the debt and equity benchmarks we like to track and lead with each week. We line each asset class up in descending order of YTD total returns. Debt returns struggled this past month and week while equities are coming off a July that was the first stretch of 5-months of positive monthly returns since 2021.
Fixed income was weak this past month in an overall soft year for bonds…
With the market now in month 8 of the calendar year, the YTD bond returns are mediocre with the notable exception of US HY. The 1-month returns detailed above saw 3 of 4 bond benchmarks in the red and higher quality fixed income benchmarks were negative.
On a rolling 3-month basis, we see duration on the receiving end of adverse curve moves with UST and IG bond benchmarks both negative. For the YTD time horizon, the UST benchmark is negative. IG Corporates only carry a 1% handle YTD return. As we review in our separate “Footnotes” publication covering the State of Yields, the full UST curve ended the week above the 4% line across the UST curve with maturities out to 1Y at 5% handles. The moves in the UST curve have not been “total return friendly” YTD.
The second half and home stretch in risky credit markets is always treacherous after a good running start with so many uncertain variables, but the US HY market is running at a rate now that would be in line for a 12-month total return well above a coupon year on an annualized basis (HY par weighted coupon ~5.9%). The running rate for now is in line with long-term returns on equities. Spreads are compressed and that will keep the wild finish to 2023 interesting.
The above chart updates the 1500 and 3000 series, and we see steady trailing 1-month numbers despite a rough week. We look at the 1-week mix in the ETF and broad market index benchmark breakdowns below.
The most notable winner over the past month was Energy in the 1500 index at +6.8% with Financials a distant #2 at +3.8%. The full list edged back into the positive range this summer. For the running 3 months, we see banner numbers in Energy and Financials after being out of favor earlier in the year. Industrials ran at double digits over 3 months. Looking back across 1 year, Energy and Industrials are in the lead for those with a longer-term time horizon. During calendar 2023, Growth has still been by far the dominant broad asset class sector.
ETF returns across short term time horizons…
In our next three asset return charts, we cover 1-week, 1-month and 3-month time horizons. We look at 26 different benchmarks and ETFs. We recently added equal-weighed ETFs for the S&P 500 (RSP) and NASDAQ 100 (QQEW) given the market cap weighted distortions in the total returns for those benchmarks that had been driven for much of the year by the mega-names.
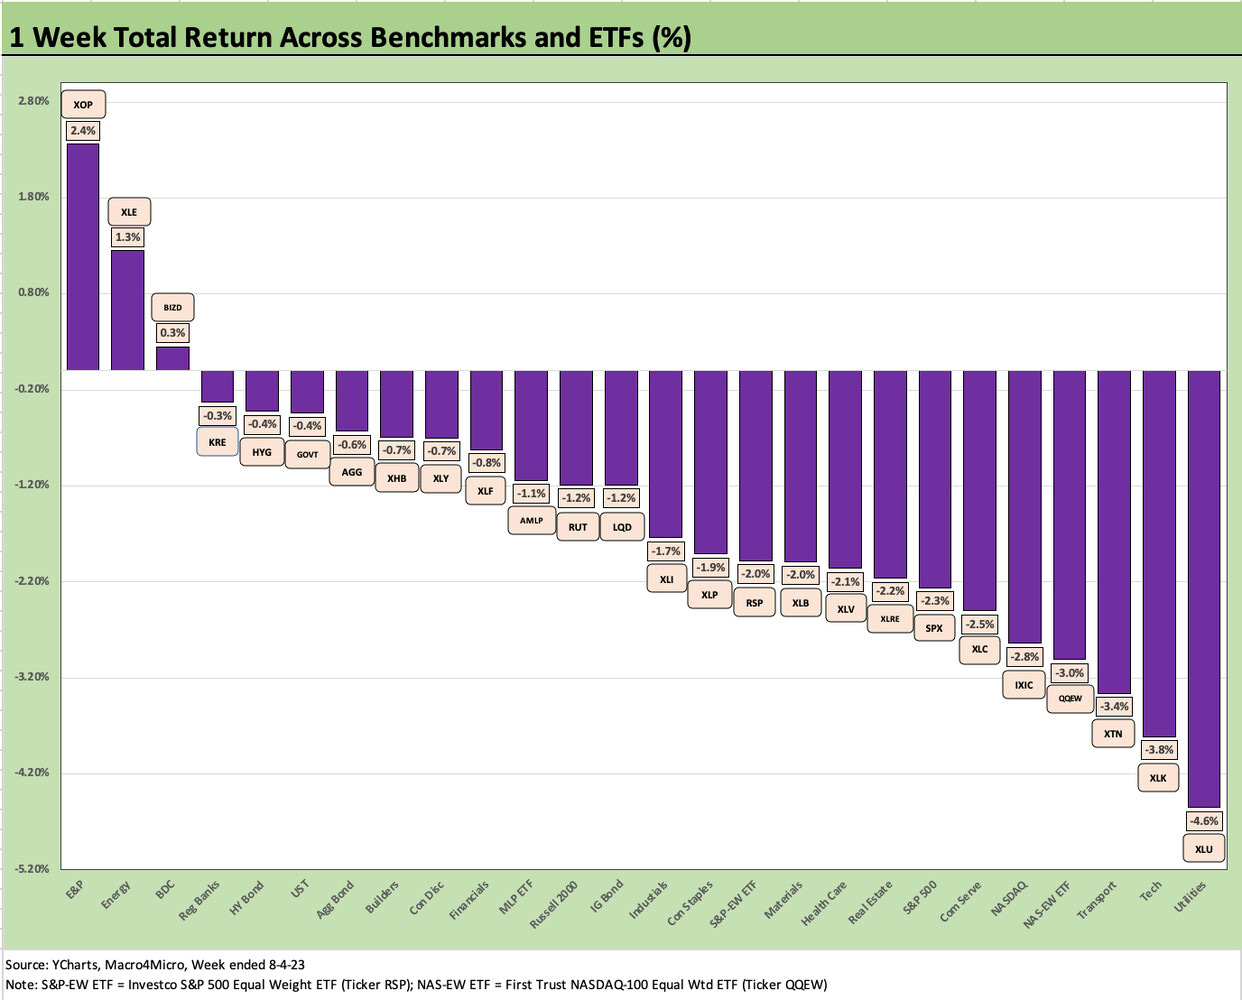
The above chart shows a dramatic swing for the past week to kick off August (Friday Aug 4) after a month of July that saw the 5th consecutive month of positive returns for the first time since 2021. The score on the week was 3 positive and 23 negative with two Energy ETFs (XLE, XOP) and a BDC ETF (BIZD) posting positive returns. That contrasted with the balance of returns in the 1-month and 3-month returns for the same mix that we look at in the following charts.
The week posted negative returns on 6 of the Magnificent 7 with Amazon positive and the rest in the red for the week (Apple, Microsoft, Alphabet, Meta, NVIDIA, Tesla). The sell-off was broader than the “big boys” as highlighted by the negative on the equal-weighted NASDAQ ETF above (QQEW). The Tech ETF (XLK), NASDAQ (IXIC), and Communications Services (XLC - dominated by Meta and Alphabet) are over on the right.
The negative numbers show the IG corporate bond benchmark (LQD) as the worst of the fixed income ETF pack for the week with the other fixed income ETFs (HYG, AGG, GOVT) clustered with negative numbers further over on the left but still negative.
The diversified Energy ETF (XLE) and E&P ETF (XOP) had a good week. OPEC and spot oil have been in the news with WTI in whispering distance of $83 as the Saudis operate somewhat unilaterally to support oil. OPEC production was down by 1 million bpd in July (per various reports). We have the July CPI release coming out this coming week, and oil is always a line item that plays a big role in inflation sentiment and inflation politics. Away from energy use and discretionary household budgets, oil flows into raw material costs, freight and transport charges, air fares, and more. Cartel behavior with their Russian tag team partner will be one to watch for the fall.
Meanwhile, numerous BDCs have rallied on the high-income flows from their floating rate asset base and high dividend payout rates around the 10% area. Earnings season for more BDCs had been underway this past week, and the news has been good for most. BDC investors might be feeling more optimism around the economic cycle and strength of small cap benchmarks that BDCs have more in common with in their borrower profiles than the large caps.
Of course, major rallies in large caps this year help sentiment as well with the equal weighted S&P 500 ETF beating the market cap weighted composite over 1 week and 1 month while essentially running alongside the broad benchmark over 3 months.
The above chart frames the 1-month returns with the score 18 positive and 8 negative. We see 3 of the 4 fixed income ETFs in the negative zone with HYG positive. Real estate (XLRE) is feeling the weight of a number of factors across fundamentals and curve related headwinds while the defensive Utility ETF (XLU) sits on the far right. The negative Tech ETF (XLK) numbers reflect a bad week after a heady run. The weak performance of Consumer Discretionary (XLY) reflects an ugly month for Tesla.
The winner in the trailing 1-month ETF return ranks was the Regional Bank ETF (KRE) at over +16% followed by the two major Energy ETFs (XOP, XLE), the BDC ETF (BIZD), and Homebuilders (XHB). For KRE, the earnings season rally was heavily about the absence of disaster in the news flow (deposits, asset quality metrics, outsized real estate flags, etc.) and the fact that this was the second earnings season since the SVB chaos that the banks have passed scrutiny and Q&A in earnings reviews. As we covered in more detail last week in our peer group stock return tables (see Footnotes & Flashbacks: State of Yields 7-30-23), the mix of small to mid-sized regionals are still heavily negative in 2023 stock returns YTD and since the SVB meltdown (post 3-8-23).
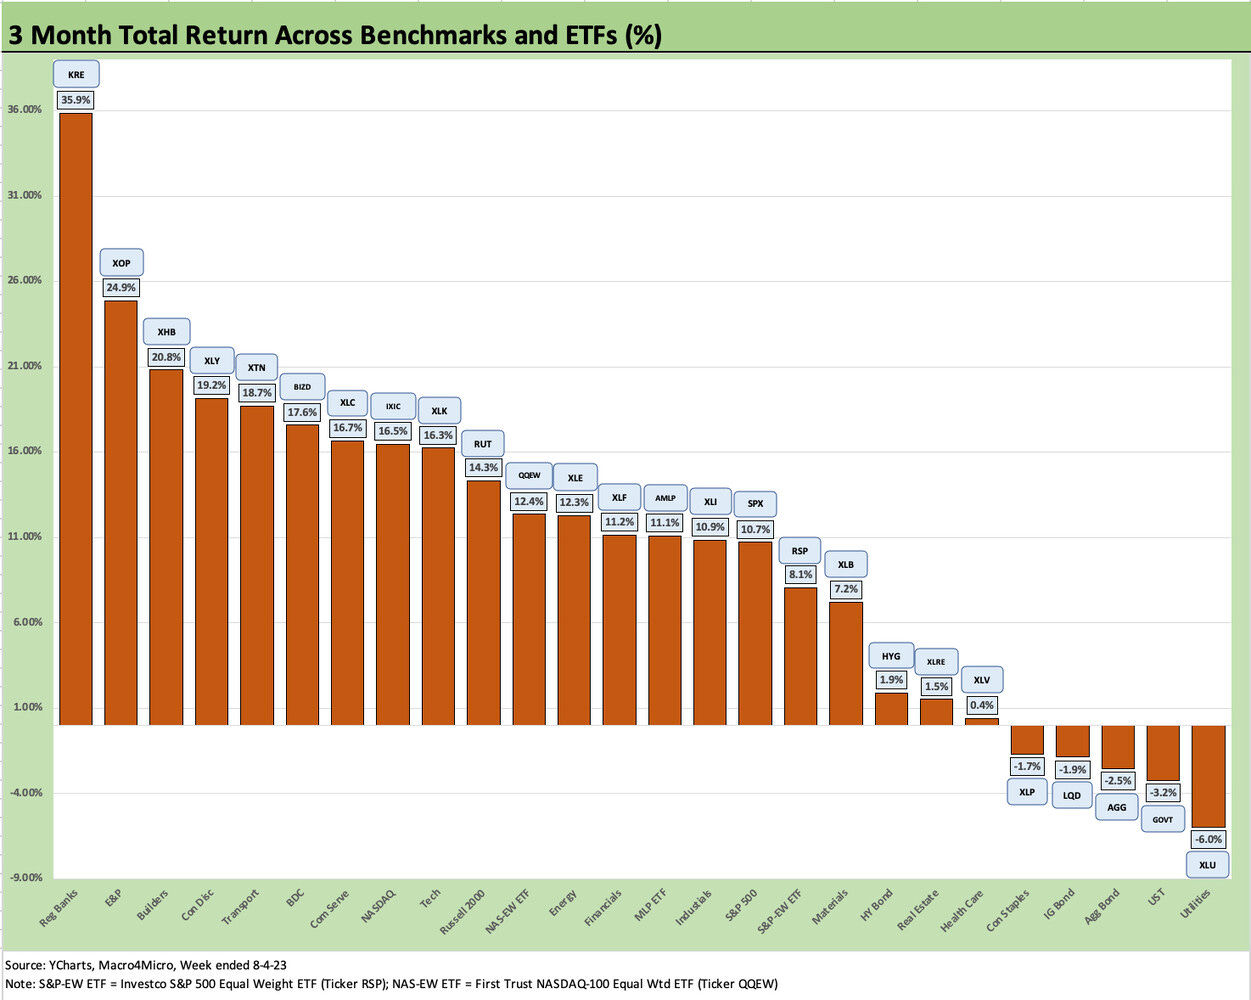
The 3-month time horizon for returns is still overwhelmingly positive at 21-5 with 3 of the 5 negatives being fixed income ETFs along with 2 defensive stock ETFs for Utilities (XLU) and Staples (XLP). HYG has ridden income flows (coupons) and a shorter duration profile in HYG’s underlying assets into the low end of the positive range for 3 months.
The Top 5 in the ETF return mix show two out-of-favor industries rebounding sharply with Regional Banks (KRE) at #1 and E&P (XOP) at #2. Homebuilders (XHB) at #3 started the year as out-of-favor but was rolling already into the 3-month time horizon and just kept on rolling. XHB is above 37% YTD at last count. Consumer Discretionary (XLY) has been driven by outsized returns over 3 months for Amazon and Tesla that dominate that ETF. Transport (XTN) is a very well diversified ETF that is winning on constituent performances tied to cyclical strength, improving supplier chains, and downstream demand trends.
See also:


