
Footnotes & Flashbacks: Asset Returns 11-12-23
We look at asset returns in another week that badly needed a strong Friday.


A good week kept the subtle but favorable YTD performance shift going in asset returns and pushed more debt subsectors into the black for the trailing month as the UST curve helps a small comeback.
We see 5 fixed income ETFs in the black for the trailing month, but all are in the red for 3 months with 3 of 5 in the black YTD as some late year duration mercy and the HY spread rebound helps the numbers.
HY is now well positioned for a “coupon plus” year if this holds up while the IG index benchmark will need good news from the curve in the home stretch to get closer to a 4% index coupon return.
The above chart reflects a two-week comeback attempt with a big part of the rally tied to a few days for the UST curve. The ability to swing from negative to positive on some of these line items YTD highlights how weak the returns were for so many asset class benchmarks. For debt, the adverse total return moves tied to duration were killing the year in high quality fixed income.
Two weeks ago, trailing 1-month and trailing 3-month for both the debt and equity lines above were all negative. For debt, the 1-month is now all positive. For the 3-month time horizon, we see HY back in the black now.
In equities, 1-month was all negative two weeks ago also and deeply negative for the 3-month period. For the 1-month period, 3 of 4 in equities are now positive with only small caps in the red. The gap has been materially narrowed for 3 months with NASDAQ back in positive range, but the S&P 500 just short. The Dow is a few good trading days from being in the black. Small caps remain mired in the red.
The YTD run rates for the debt asset classes three weeks ago saw only HY positive, and that was below a 4% YTD return handle. The lineup of the debt benchmarks is now 3 of 4 positive and HY as a leader at just under 7%.
If HY closes out the year around the long-term nominal equity return median at closer to 10%, that would be a major achievement and a surprise from those low spread levels in a UST tightening cycle with a par weighed coupon slightly below 6%. The flip side is an adverse curve move and case of nerves in equities could upset that scenario pretty easily for HY if the usual correlation effects hold.
With the recent set of numbers, the YTD HY index total returns just pulled ahead of a coupon year with six weeks to run. HY had been living off its early year spread contraction and lower duration exposure to this point.
The above chart updates the 1500 and 3000 series. Growth still holds a commanding lead in a very strong year. So far, this YTD lineup amounts to what would be a bad year for small caps and some major sectors such as Financials, Energy, and Real Estate.
We see 4 of 6 benchmark line items in the red for the trailing 1-month period and 5 of the 6 negatives for the trailing 3 months. The performance over the past two weeks has whittled down the 3-month column from 4 of the 6 being in double-digit negative numbers to the potential to claw back into the black for Financials and Energy. Real Estate still faces a lot of headwinds. It will take a friendly UST curve to rally Real Estate.
ETF and Benchmark Returns
In the next section, we update our usual asset class subsector returns through a mix of ETFs and market benchmarks. We added the time horizon matrix chart below for a quick visual on the relative symmetry of returns across each time horizon. It is more about the shape of the return charts since we dig into the numbers in the next section.
These trailing period returns have been shifting over the past two weeks back towards the positive side. We include this week’s below and then last week’s right below that as a frame of reference for the shifting return lineups.
The visual makes a clear statement that the 1-week, 1-month, and 3-month time horizons are mixed after a very strong rebound last week and a solid Friday performance salvaging this past week.
On a YTD basis, the balance of positive and negative is biased toward positive by 17 to 11 after being weighted toward the negative side just two weeks ago, when the trailing 1-month was entirely negative (see Footnotes & Flashbacks: Asset Returns 10-29-23 10-29-23).
The rally week ended Friday 11-3-23 was the big move back for many sectors that had been hanging around in low single digit returns (negative and positive). This past week needed another big Friday to keep the streak going.
Time Horizon Returns
In our next four asset return charts, we cover 1-week, 1-month, 3-month, and YTD time horizons for a range of ETF and benchmark returns. We look at 28 different benchmarks and ETFs that cut across a wide expanse of the economy.
We see the equal weighted S&P 500 barely in positive range YTD at +1.0% and the small cap Russell 2000 is negative at -1.9%. Time is running out to achieve a median year. The Magnificent 7 has carried the S&P 500 into the positive zone, but that is not a real portfolio with prudent diversification.
In contrast, NASDAQ has been a winner in market cap weighted or equal weighted, so that is something. It will take a few monster weeks for the broad benchmarks to pull this out for the broader mix of equities with a lot of the same macro questions still in play.
The Magnificent 7 heavy ETFs…
Some benchmarks have a few issuer concentration elements that leave them wagged by a few names. When looking across some of the bellwether industry/subsector ETFs, it is good to keep in mind which narrow ETFs (vs. broad market benchmarks) get wagged more by the “Magnificent 7” including Consumer Discretionary (XLY) with Amazon and Tesla, Tech (XLK) with Microsoft, Apple, and NVIDIA, and Communications Services (XLC) with Alphabet and Meta.
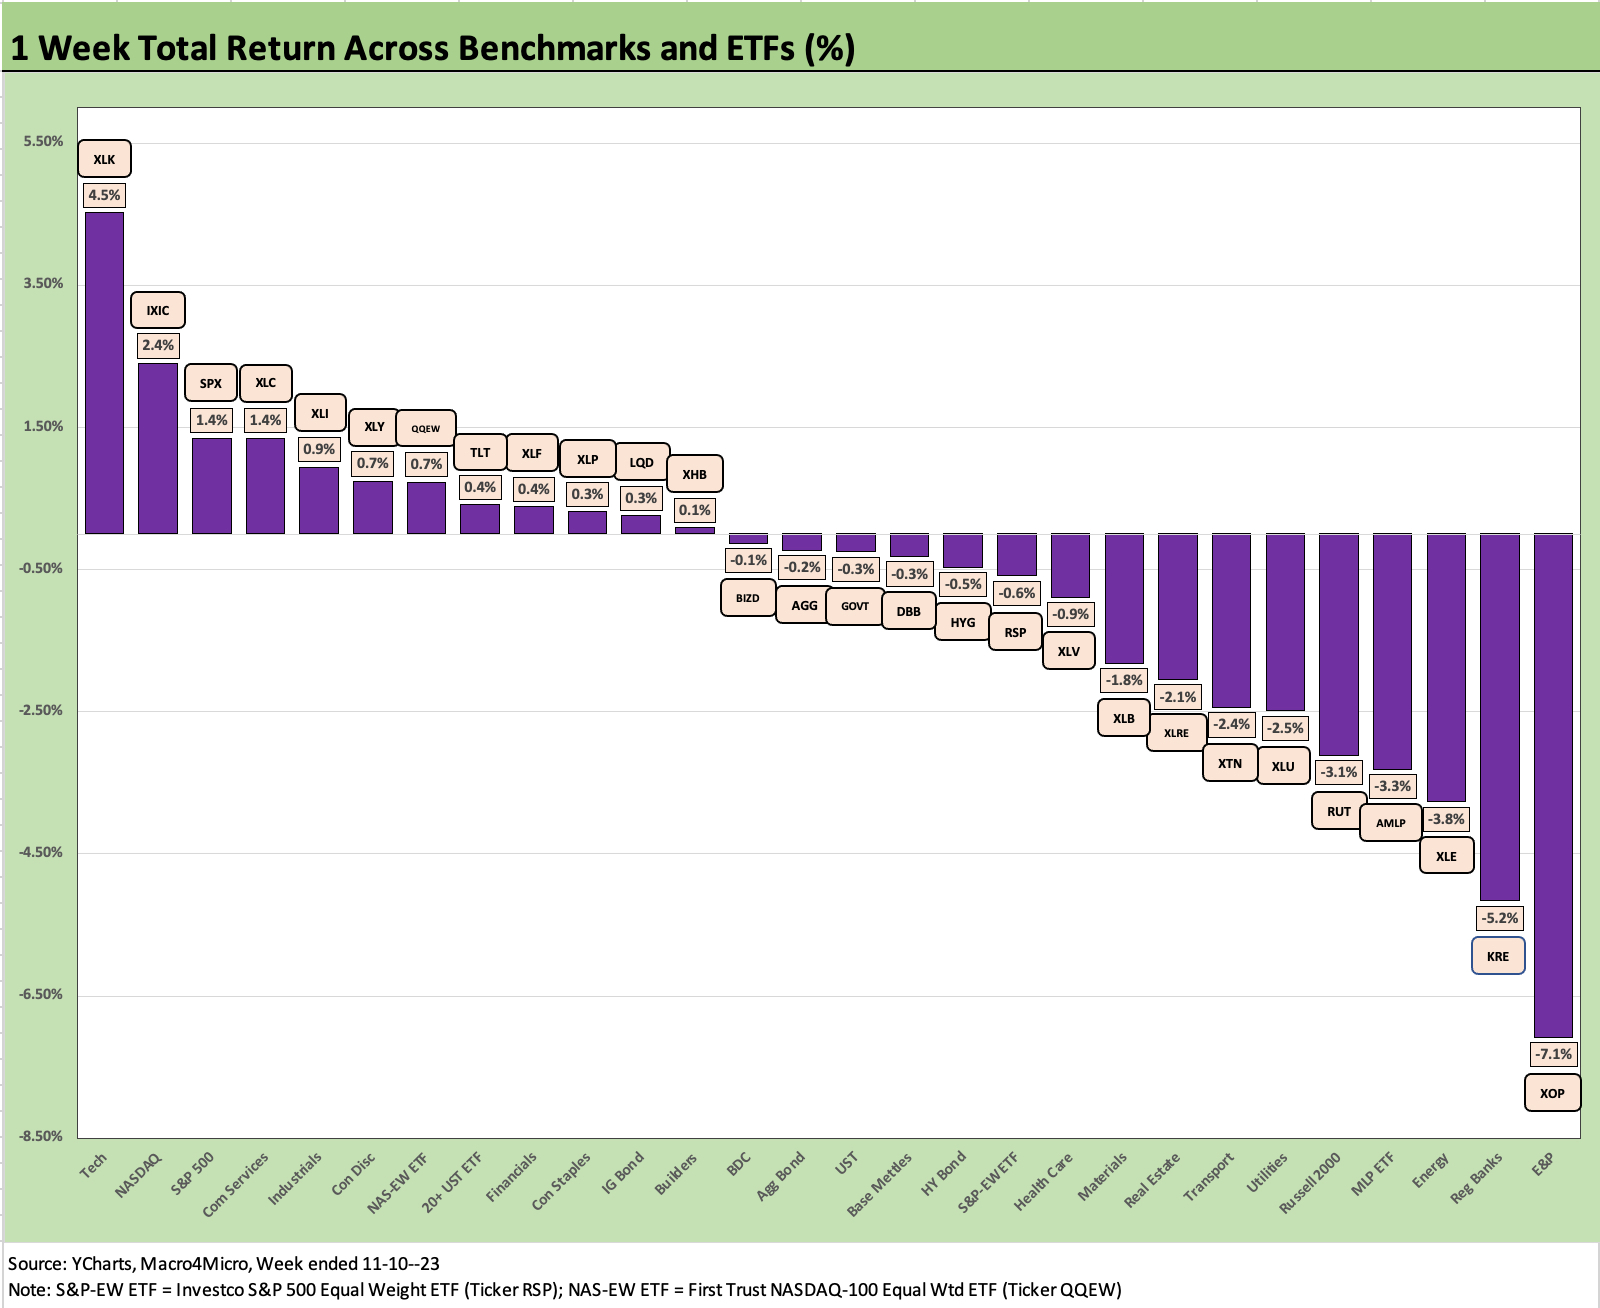
The 1-week time horizon posted 12 positive and 16 negative with Energy, Regional Banks, and small caps taking a beating. We see 3 of the worst 4 performers in Energy with the E&P ETF (XOP), Energy (XLE), and Midstream (AMLP) dragging on weak oil prices and the absence of OPEC escalation (i.e., Iran) in the Israel-Hamas War. They join Regional Banks (KRE), Russell 2000 (RUT), Utilities (XLU), and Transports (XTN) in the bottom quartile.
The upper quartile was Tech (XLK) and Magnificent 7 heavy with the exception of the Industrials ETF (XLI), which has made few appearances in the top ranks. The S&P 500 made the top quartile, but the Equal Weighted S&P 500 ETF (RSP) was across the line in the negative zone at -0.6% well into the third quartile.
The fixed income ETF proxies were mixed with TLT, LQD, and AGG in the second quartiles and GOVT and HYG over in the third quartile. The weekly results crossed over from negative to positive returns in the second quartile, so that was not much of a week and overall performance for broader benchmarks got by on a major Friday equity market rally. The UST curve was an adverse move as we framed in our weekly yield curve commentary (see Footnotes & Flashbacks: State of Yields 11-12-23).
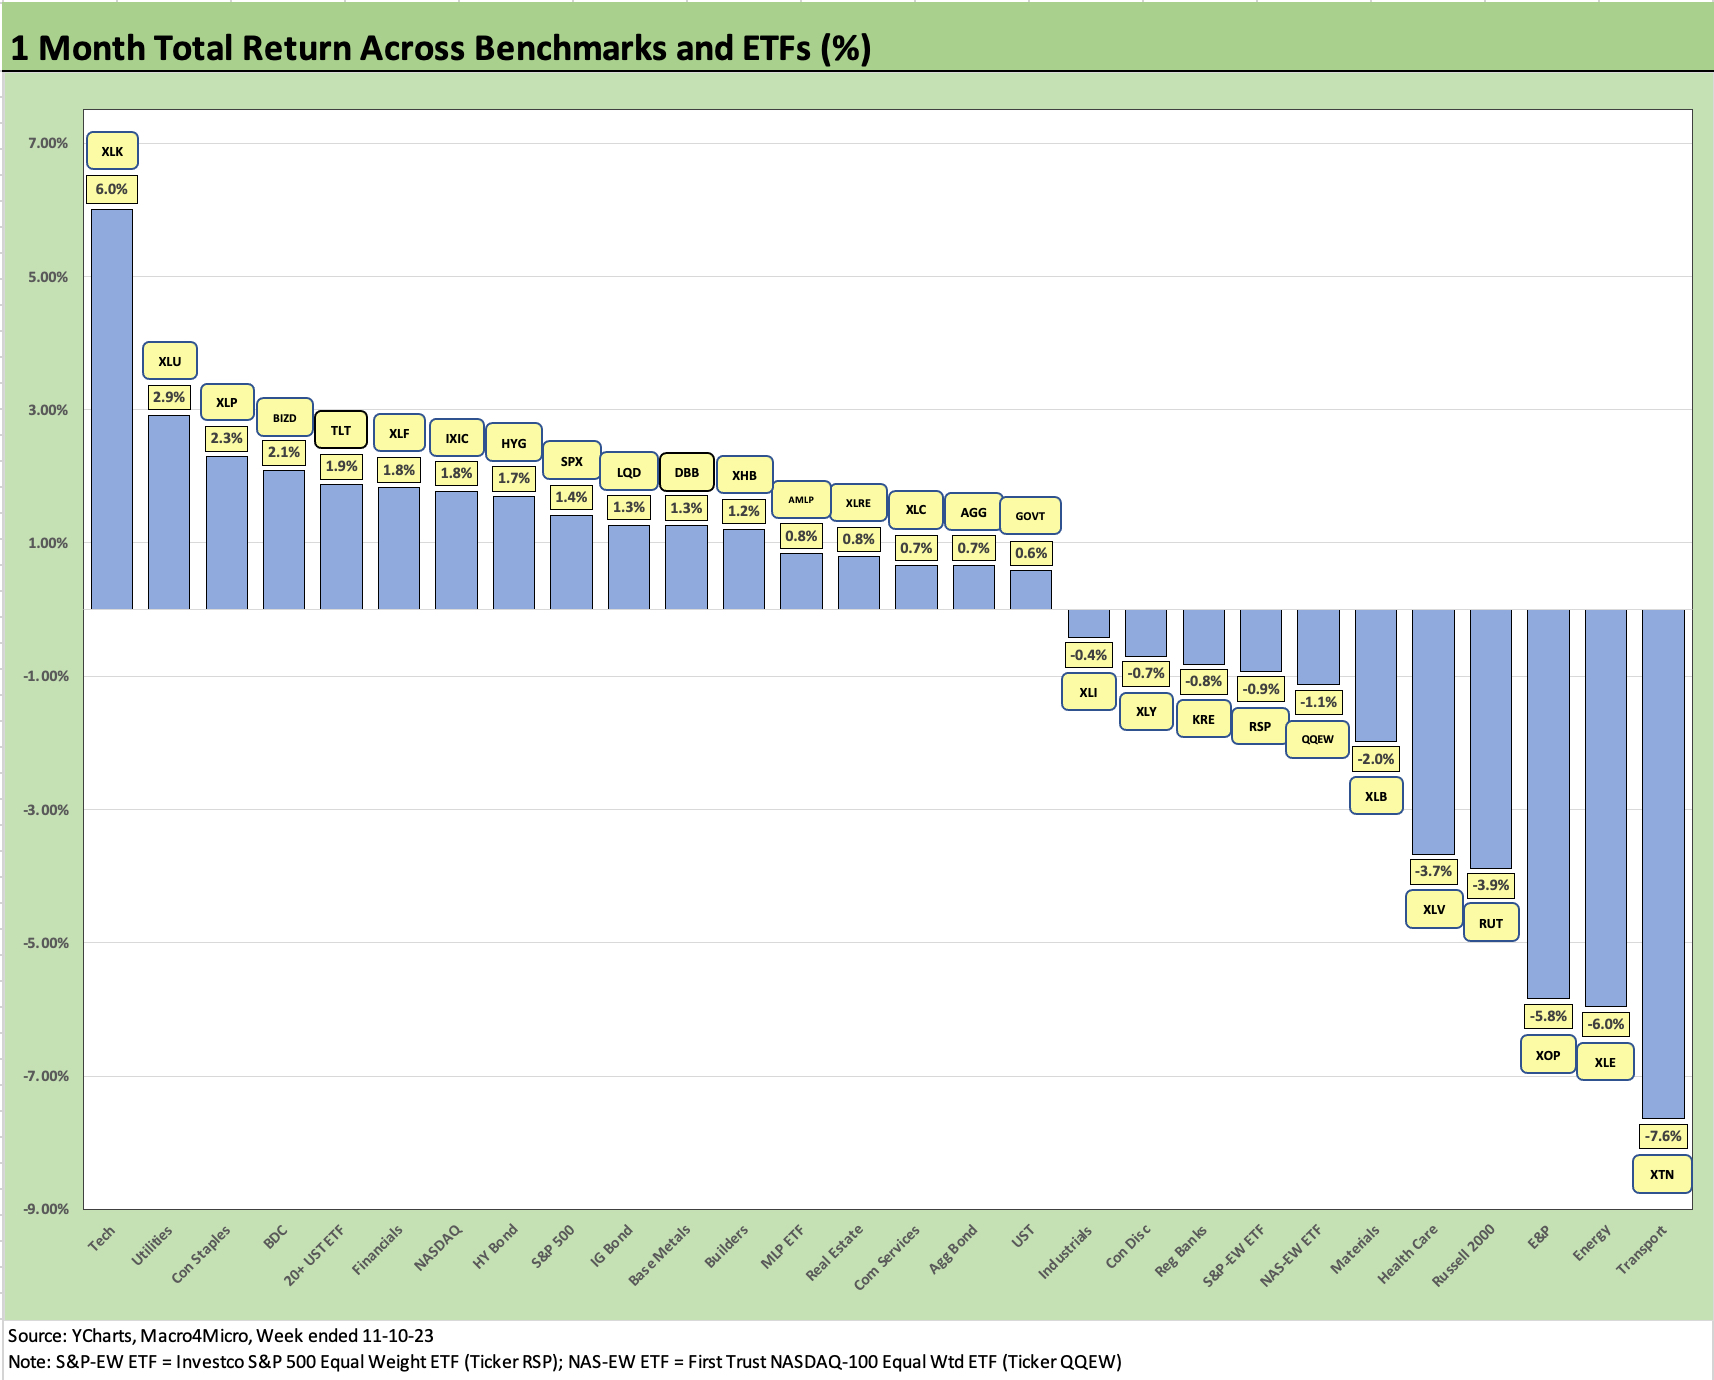
The trailing 1-month returns posted 17 positive and 11 negatives. The 1-month has all 5 fixed income ETFs and the BDC ETF (BIZD) on the positive side. When we get to the YTD numbers, we see high quality fixed income weakening in the rankings with 3 of 5 fixed income ETFs (AGG, GOVT, TLT) dropping into the red zone with LQD barely positive for the YTD period. HYG is positive YTD and in the second quartile. BIZD as a credit risk surrogate made into the top quartile.
For the 1-month time period, we see the recurring fundamental worries around Transports (XTN), but we also see the beating handed out in the Energy sector as oil prices slipped all the way into the 70-handle range with WTI touching down to $75 this week and wrapping it up at $77 Friday.
Small caps remain on the negative side in the bottom quartile consistent with its YTD performance while the defensive Health Care sector rounded out the Bottom 5. Extending that to the low quartile of 7 names we see Materials (XLB) and the equal weighted NASDAQ 100 ETF (QQEW).
The high quartile for 1-month still features Tech at the top with the Tech ETF (XLK) at +6.0% for the month and the other side of the top quartile bookend at #7 with NASDAQ. Between those two, we also see some of the rebounders from last week’s UST tally with Utilities (XLU), Staples (XLP), the 20+ Year UST ETF (TLT), and Financials (XLF). Another name in the top quartile might be up for “most consistent” prize with the BDC ETF (BIZD) holding down a spot at #4.
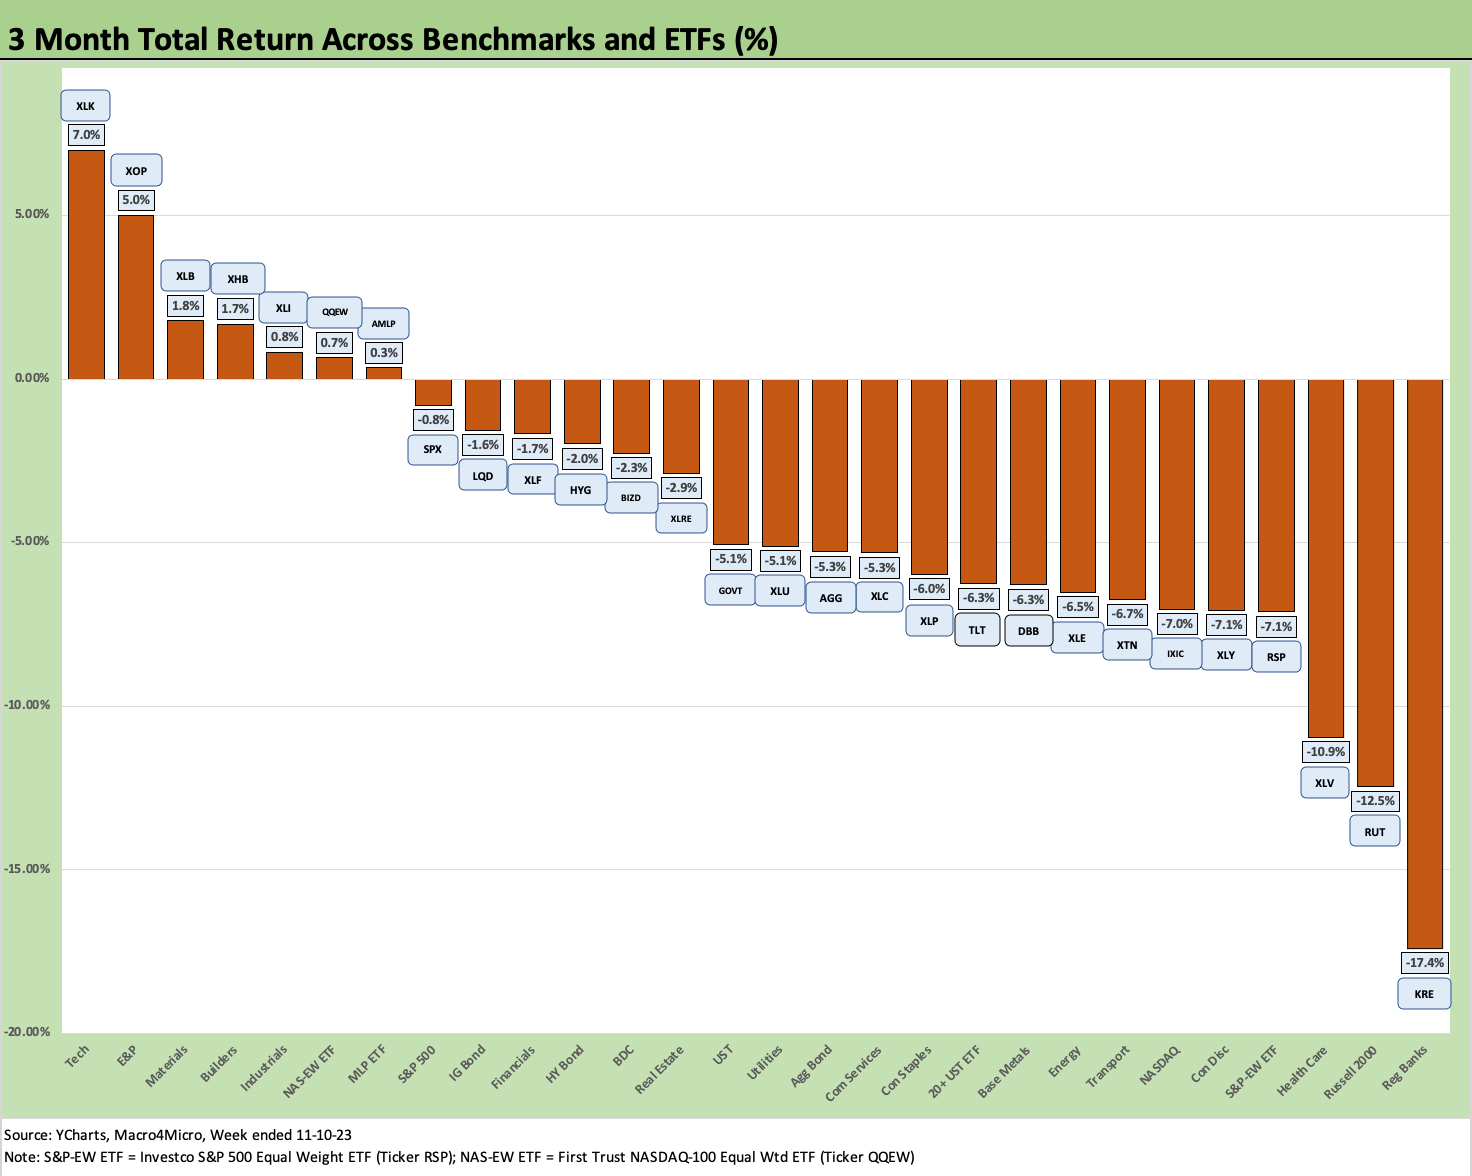
The 3-month performance shows the lingering effects of the pre-rally weakness and how that flowed into equities and debt alike. We see all 5 fixed income ETF proxies in the red with the most duration sensitive (TLT) in the worst relative position of fixed income peers. We also see some pain for the NASDAQ and Magnificent 7 heavy ETFs (XLY, XLC).
The winners were a mixed bag with some Tech ETF winners on issuer mix (XLK), Energy related ETFs (XOP, AMLP), Builders (XHB), Materials (XLB), Industrials (XLI), and equal weighed NASDAQ 100 (QQEW). The 3-month showed more divergence than we usually see in Tech, “Mag 7” and Energy.
We see Regional Banks (KRE), Small Caps (RUT), and Health Care really struggling with double-digit negative returns on the bottom of the performance metrics. The equal weighted S&P 500 ETF (RSP) was down at -7.1% in a very poor stretch.
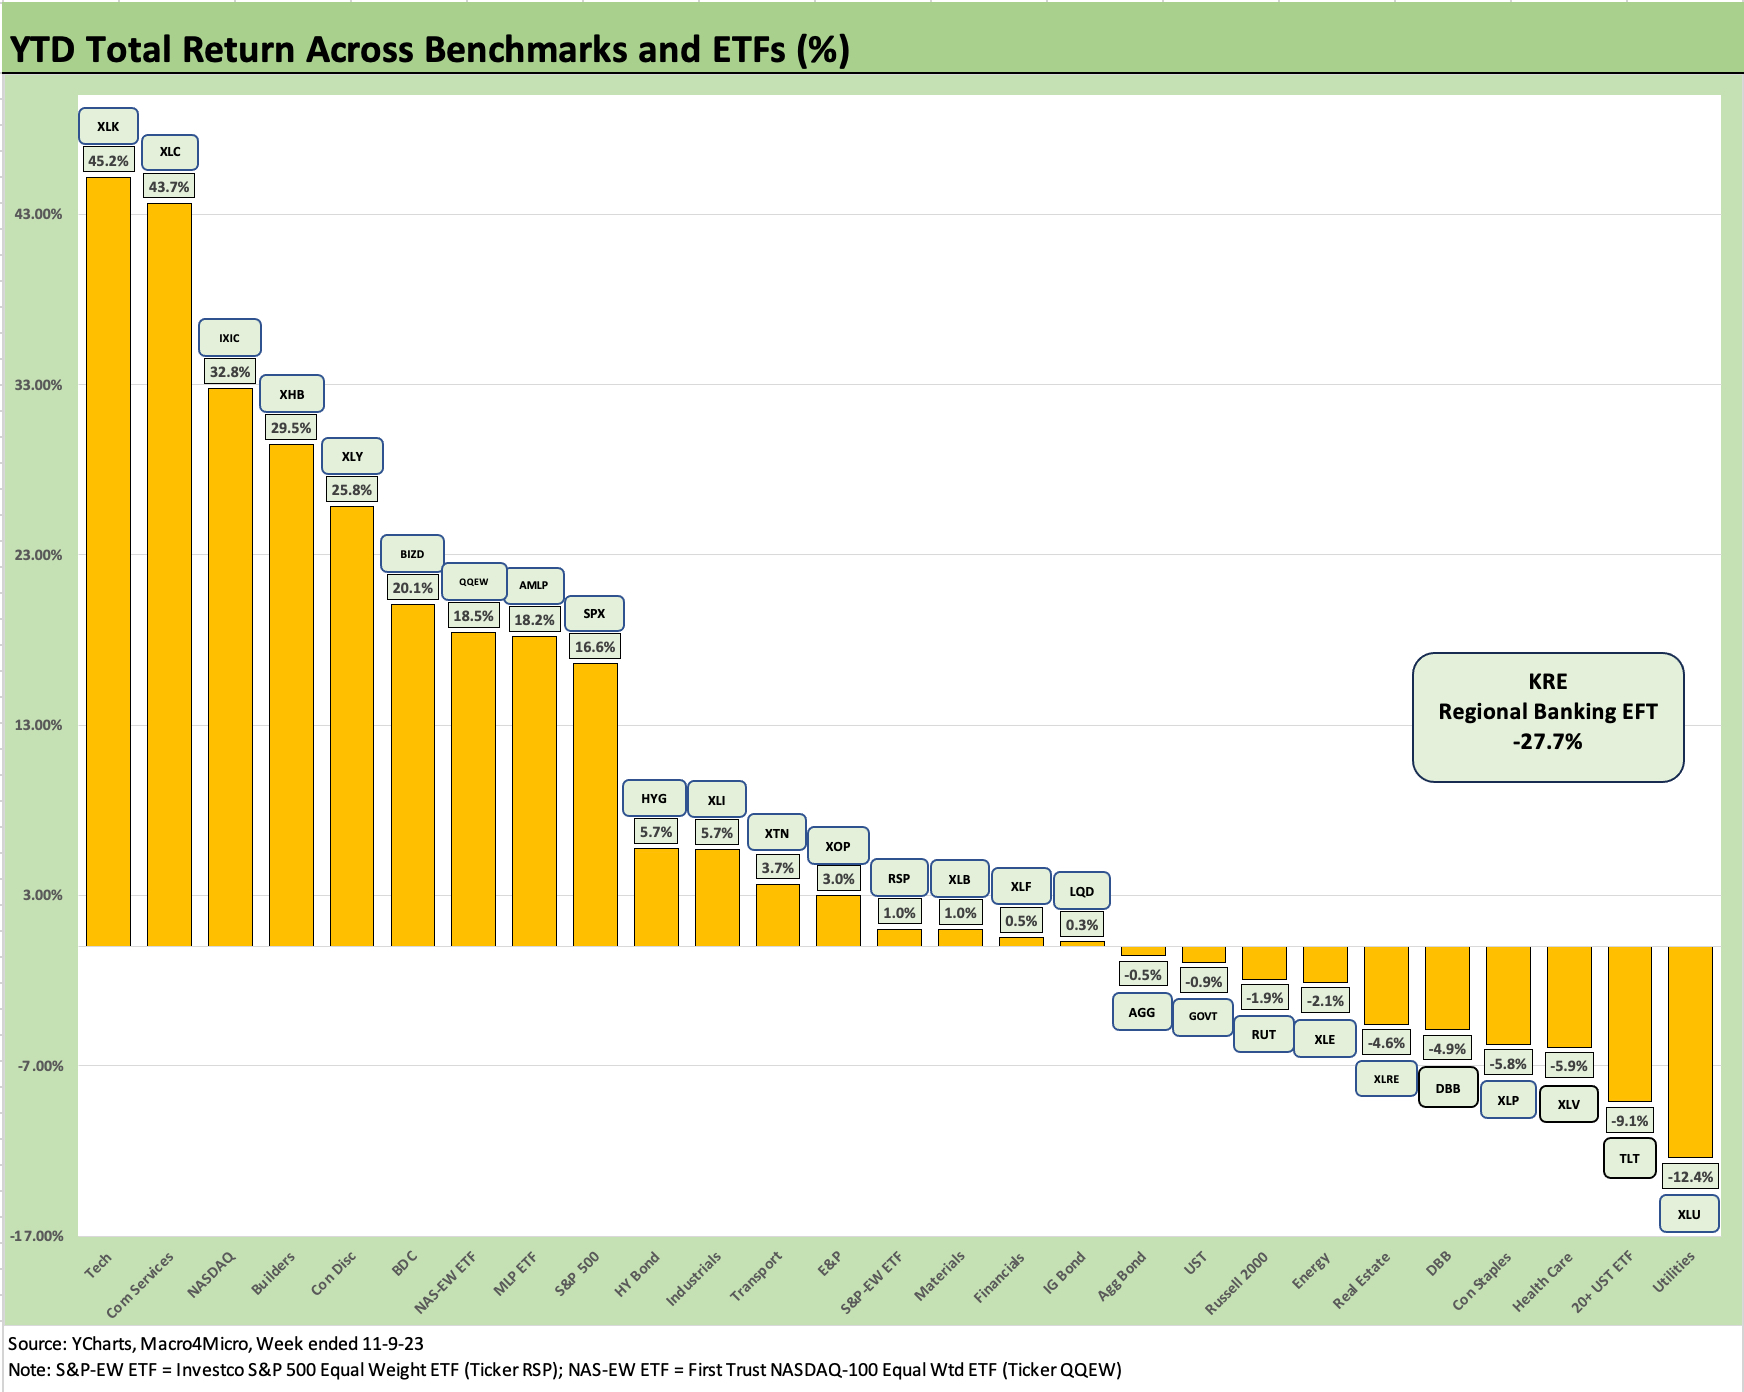
With the NASDAQ and tech rebound over the past two weeks, the top quartile is back to 5 of the 7 in that quartile being tech-heavy or led by Magnificent 7 bellwethers. The Tech ETF (XLK), Communications Services (XLC), and NASDAQ lead the pack before Builders (XHB) break up the group.
Rounding out the top quartile, we then see Consumer Discretionary (XLY) at #5, the BDC ETF (BIZD) at #6, and the NASDAQ 100 Equal Weighted ETF at #7. Builders and BDCs outperformed expectations with AMLP just below the top quartile at #8 followed by the S&P 500 with its dependence on the Magnificent 7.
Bringing up the rear was the Regional Bank ETF (KRE) at -27.7% with the interest rate sensitive Utility ETF (XLU) also in negative double-digit returns. The long duration (20+ years) UST ETF (TLT) was third off the bottom at -9.1%. Rounding out the bottom quartile was Health Care ETF (XLV) and Staples ETF (XLP) around the regular bottom dwellers. They were joined by the Base Metals ETF (DBB) on cyclical worries and China concerns. The Real Estate ETF (XLRE) feels a recurring source of anxiety with the tightening cycle.
The Hi-Lo return range for the 28 weighed in at 72.9 total return points for Tech (XLK) vs. Regional Banks (KRE). If we toss out the Hi and the Lo and use the next assets subsectors, we see a 56.1 total return point differential for Communications Services (XLC) vs. Utilities (XLU). That keeps active managers and day traders in the game. The divergence between the winners and losers keeps the blood up for many.
Overall, the week was mixed with a Friday rally pulling it back into a strong benchmark rally that lacked breadth. More than half of the 28 are either negative or have +3% handles or lower. It will be a crawl to the 2023 finish line and hopefully not a sprint in the wrong direction.