CPI: Make Your Own Metrics
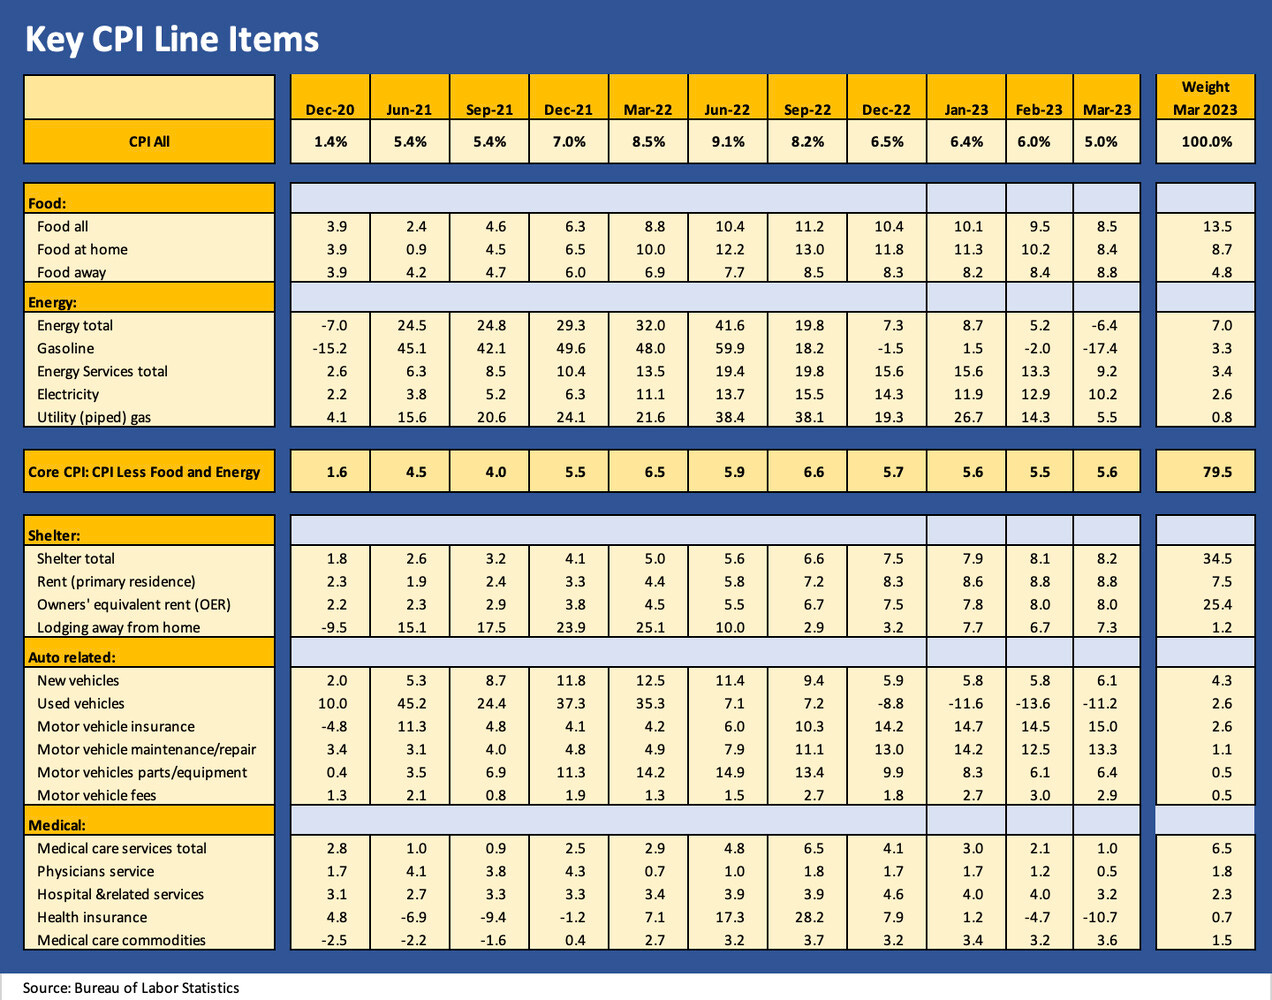
We update our CPI checklist for March 2023 and break out the Big 5 categories and add-ons that comprise over 85% of the index.
Any decline in the headline CPI is a good thing, but the mix of metrics gets more complex as energy deflates (for now) and we see such a wide range across goods and services from high to negative.
We like the “ex” family at this point as some variation on the CPI recipe should get more focus from here with “All Items ex-Shelter” at 3.4% right at the top of the relevance list followed by “Services less rent of shelter” at 6.1%.
The favorable YoY comps math is now starting to kick in since the invasion of Ukraine and the flow-through of all the supplier chain and feedstock problems that came with the oil and gas spike.
With a bigger selection of sentiment shapers to be found in the CPI line items, we thought the make-your-own pizza theme applied. There are a range of metrics that can mean more in the sea level economy (as opposed to the FOMC gathering of pedigreed, more theoretically driven “smaht guys”). Core CPI is now well under headline CPI on the swing in energy inflation, and that is one that requires some mental readjustment on the key drivers.
Among the notable Special Aggregate Indexes that show up in the CPI release each month, we routinely look at the following:
All items less shelter: This one stands at a more optimistic 3.4%. The “shelter CPI” theories are painfully theoretical and not very relevant to someone whose rent is fixed for 1 or 2 years or who might own a house with no mortgage or a fixed monthly mortgage. The shelter CPI does not fit the “cash in, cash out” school of household bookkeeping. The shelter metrics and especially “owners’ equivalent rent” comes with an asterisk (and is often ignored by analysts). There are plenty of timely alternatives to assess housing direct costs.
Services less rent of shelter: This one stands at 6.1% and has been the tougher nut to crack in the inflation picture. Rent for those who “literally rent” is relevant but can very widely by region for household sentiment. Shelter CPI is not timely for the month-to-month realities of when it “reprices.”
Services less energy services: This is a high-level measure that stands at 7.1%, and that is a lofty number still. Ex-food as a metric is hard for many to stomach, but the ex-Energy Services one highlights the breadth of Services inflation. The labor intensity or pricing power along the Services supplier chain really is a drill-down exercise by category.
All items less food, shelter, and energy: This one stands at 3.7%. This is basically Core Inflation adjusted for shelter inflation. We don’t see it as all that relevant to a consumer, but those who like Core Inflation can use this to satisfy their objections to a highly questionable methodology and weighting assigned to Shelter in CPI. You tend to need to eat even if you live in the woods and walk the earth. Then again, you can eat what you kill in the woods.
The Big 5 and add-ons…
Below we break out the Big 5 as we do each month (see CPI: Feb 2023 Big 5 and Add-Ons 3-14-23). This Big 5 group accounts for almost 75% of the CPI index (74.6%) for March 2023. We tailored our own combination of Automotive related inflation trends since we believe the focus on just new vehicles and used vehicles prices misses a lot of the cost pressures in owning a car (see Automotive Inflation: More than Meets the Eye 10-17-22)
The second chart in the mix further below includes numerous categories near and dear to many households and those add another 11.2% for a total of almost 86% for the combined line items. Those include the usual suspects of daily household life from Recreation Services to Apparel and Phone/Internet among others. Recreation is where a lot of payroll action is in the employment statistics and part of the bigger services inflation story in wages.
Overall, March 2023 CPI ups the ante on getting into the weeds of the line items, but it also provides relief with headline CPI at 5.0% that is now below Core CPI of 5.6%. This is about that time when those opposed to Fed policy will restate the headline number as the most relevant. We like looking at more rather than less line items of course, but with a gun to our head we pick headline CPI every time since that is so much a part of the consumer culture and history.
As someone who came of working age in the stagflation years of the 1970s growing up in a below median income, working-class town, food and energy inflation (plus employment) are always the main event in framing the “real world” economy. In much of the US, uninsured deposit rates do not resonate as much for so many households that live check-to-check.
In Energy, the gasoline decline YoY is a major positive even if it is under an OPEC cloud. For natural gas, prices have plunged. The natural gas storage process and the later seasonal draw-down is a seasonal thing that can be watched via the EIA website. Food is still a problem, but CPI has seen Food at Home drop into single digits this month from 10.2 last month to 8.4% in March.
For the “add-ons,” we see a decline in Recreation Services but 3 out of 6 categories rose sequentially. Airlines fears saw some relief even if just on the aviation fuel factor although more variables are at work there. We will hear from Delta this week on its earnings followed by the other majors. Their pricing power has to get reeled in at some point on supply and demand.


