

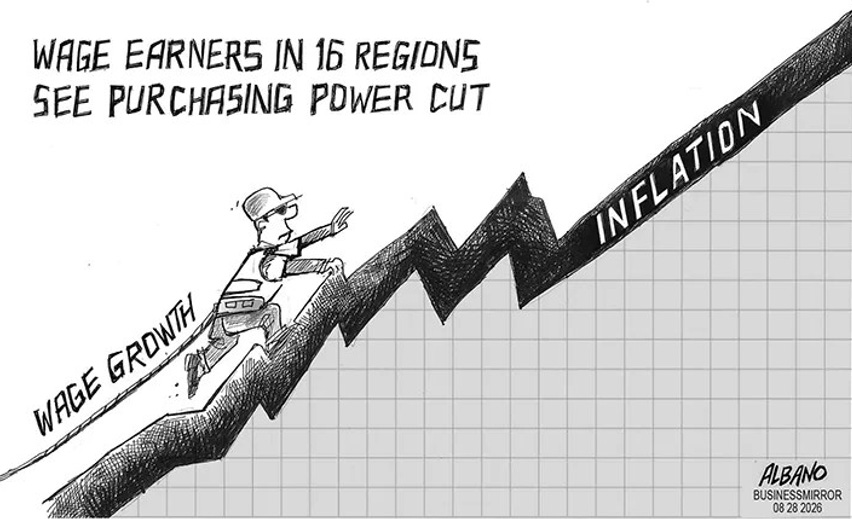
The Employment Cost Index has not changed much in 2026 with 3.4% total compensation growth for all civilian workers, which is flat to the June quarter. The wage number was 3.1% for the September quarter. “Private industry” was also 3.4% for total compensation, and that grouping seeing a modest uptick from 3.3% in the June quarter. State and local government workers ticked lower to 3.5% from 3.6% with wages at 3.2%, down from 3.4% in June. (see Employment Cost Index June 2026: Inflation > Wage Growth 7-31-26).
The balancing act between the low upward wage pressure on inflation creates the tradeoff “inflation vs. household pain.” Inflationary forces away from labor are something we routinely cover with CPI and PCE inflation at the headline level higher and the same across critical pieces of the “household basket.” The effect is a body blow to real wages and household cash flow. Inflation exceeds wage growth, and that is a bad thing by definition (see PCE Sept 2026: Inflation, Income & Outlays 10-29-26, CPI Sept 2026: Does Chronic Inflation Need More Treatment 10-15-26).
With health care still a pain point with rising health insurance premiums and/or the shift to higher deductible plans (or no healthcare insurance at all), these 3% handle wage and total compensation numbers are bad news for the workers. Employers get the better part of the deal as they raise prices in many areas from goods to services.
The waves of layoffs in the news and the AI threat ahead for many workers is undermining wage leverage and job mobility in a “low hire, low fire” economy that might shift into a “low hire, high fire” backdrop. The “benefits” piece of compensation will be especially tenuous and costly for those who end up without health care coverage.
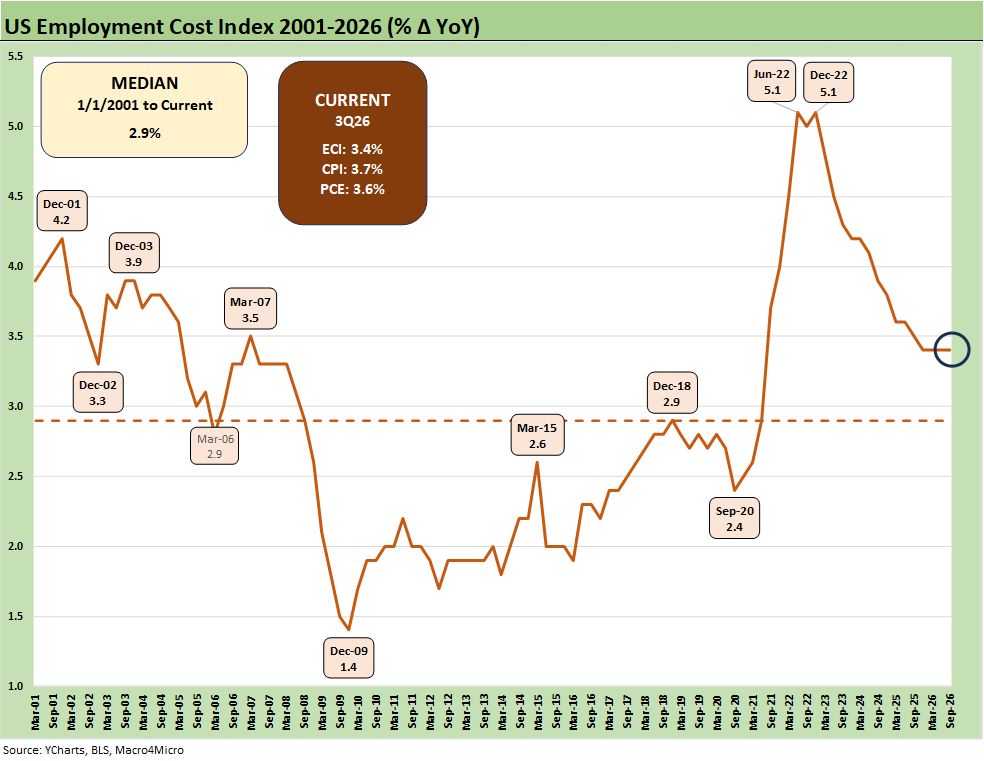
The above chart updates the Employment Cost Index (ECI) time series since 2001. We see a current rate of 3.4% for all civilian workers for total compensation that includes a 3.1% salary component as noted in the bullets. The median of 2.9% will not work for consumers in a market where 3% handle headline inflation becomes the norm.
We see the steps down for the various ECI mini-peaks across the new millennium from the tech bubble peak in 2001 of 4.2% to late 2003 at 3.9% to the pre-housing meltdown period of March 2007 at 3.5%. Then came the credit crisis.
The post-crisis period worked its way back to the 2.9% ECI level in late 2018. The 2022 inflation spiral after COVID sent the ECI back up to 5.1% even as inflation in 2022 was battering consumers.
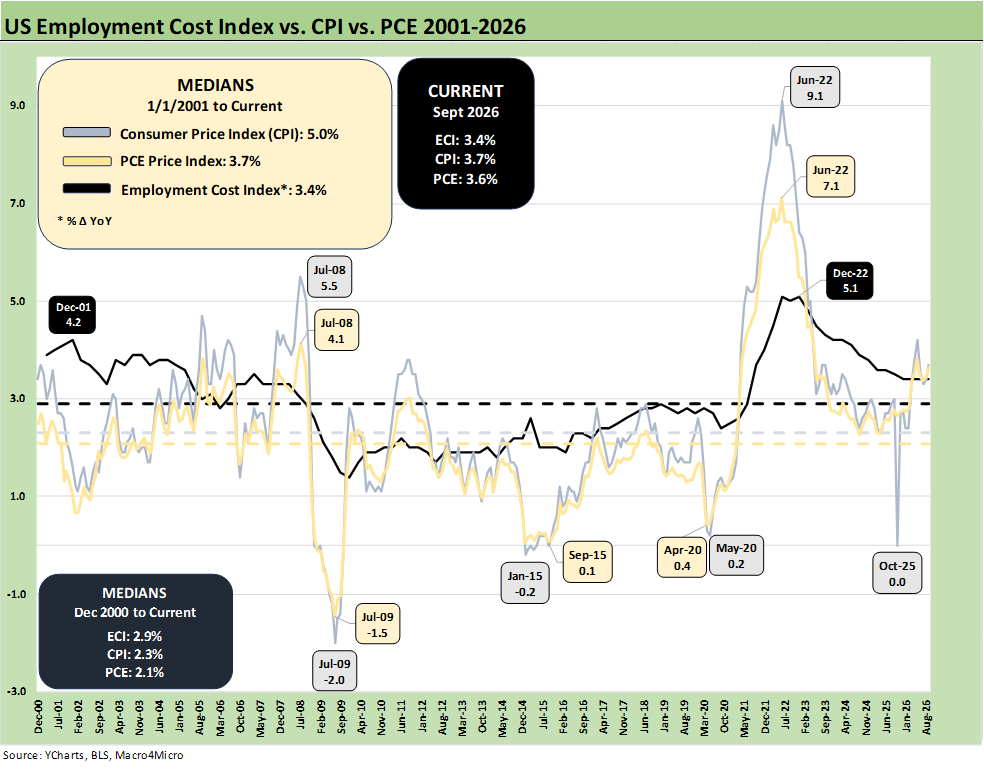
The above chart offers some context on employment costs vs. inflation with CPI and PCE inflation both detailed. The box in the lower left details the medians since 2000 for ECI at 2.9% vs. CPI at 2.3% and PCE at 2.1%. That timeline included an extraordinary period of low CPI and PCE with the financial system crisis and a pandemic. That period also includes a mix of oil price spikes and collapses after starting off with a tech bubble implosion during the 2000 to 2002 chaos.
The current levels for ECI (3.4%), headline PCE (3.6%) and headline CPI (3.7%) are in an unfriendly cluster for now. A return to the 2% handles for any of those is part of the daily handicapping exercise. With costs of energy, commodities, downstream materials (steel, petrochemicals), tariffs, and semiconductors on the short list, it is very hard to be optimistic on inflation declines. The USMCA uncertainty and the announced intention to escalate in Iran after the election is not helping the story line.
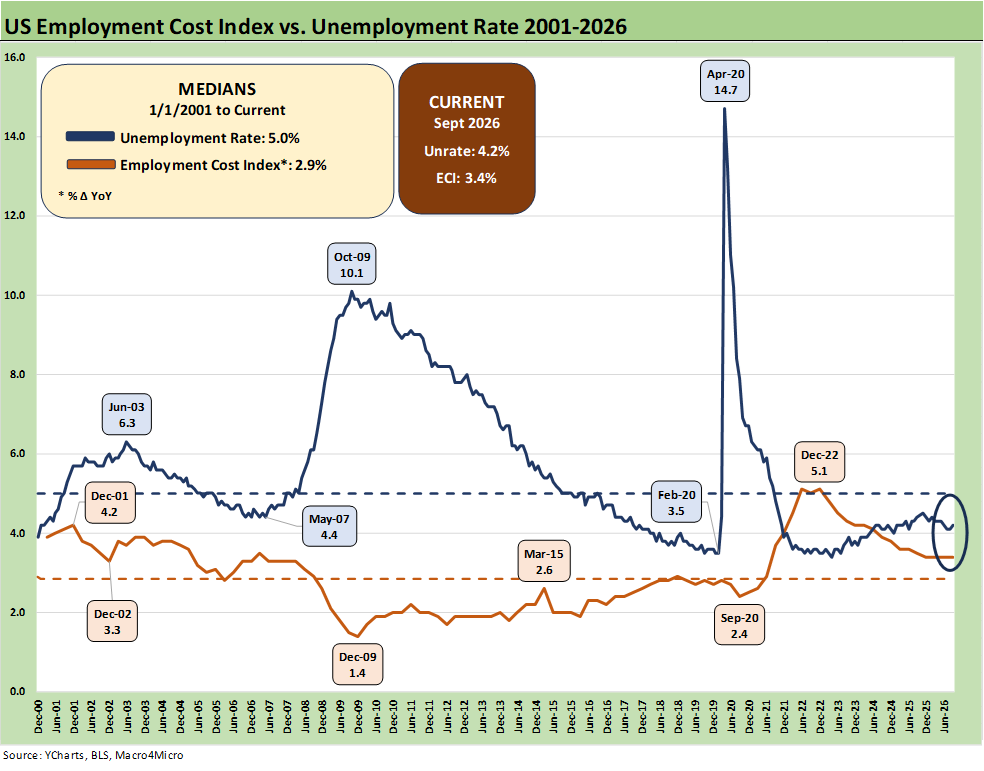
The above chart updates the unemployment rate time series vs. the Employment Cost Index. The labor economists and the market can debate where pricing power flows to labor and when it doesn’t in a macro backdrop such as 2026.
A low 4% unemployment rate would be full employment across most historic cycles, and the 3% handle unemployment rate was a key factor that also fed PCE growth and prevented a recession during the inflation panic of fall 2022 (see Unemployment, Recessions, and the Potter Stewart Rule 10-7-22).
Some pockets of labor shortages have surfaced in goods sectors such as homebuilding and construction markets and health care in services (among others) flow from the mass deportation damage and fear created by ICE and the violent, masked Goon Squads seen so often on video with an occasional execution.
Those forces can shrink labor on two fronts. First, those deported immigrants deplete the employment ranks in numerous subsectors with some more regionally concentrated than others. Second, those fearing harassment (even with a green card or citizenship) are at times afraid to leave the house. Some parties hope that fear will carry over to the voting poll booths. That will be documented (or not) next week.
The subject is a toxic one in this environment and fraught with the usual “diverse sets of facts” (aka lying). The rise of open racism and xenophobia is a self-evident fact that many still deny.
So far, the wage effects and supply-demand tradeoff shifting to support labor have not moved the needle much in 2025-2026. The AI handicapping on how it will all flow into headcount and wage power does not bode well.
That takes the edge off the wage piece of the inflation story, but wage growth is already underwater for workers even before the threat of sustained pain ahead in energy and health care costs.