Capacity Utilization: No Recession Numbers Yet
Expectations for recession remain high, but so far manufacturing is not cooperating. Durables are working hard.
The Very Short Form:
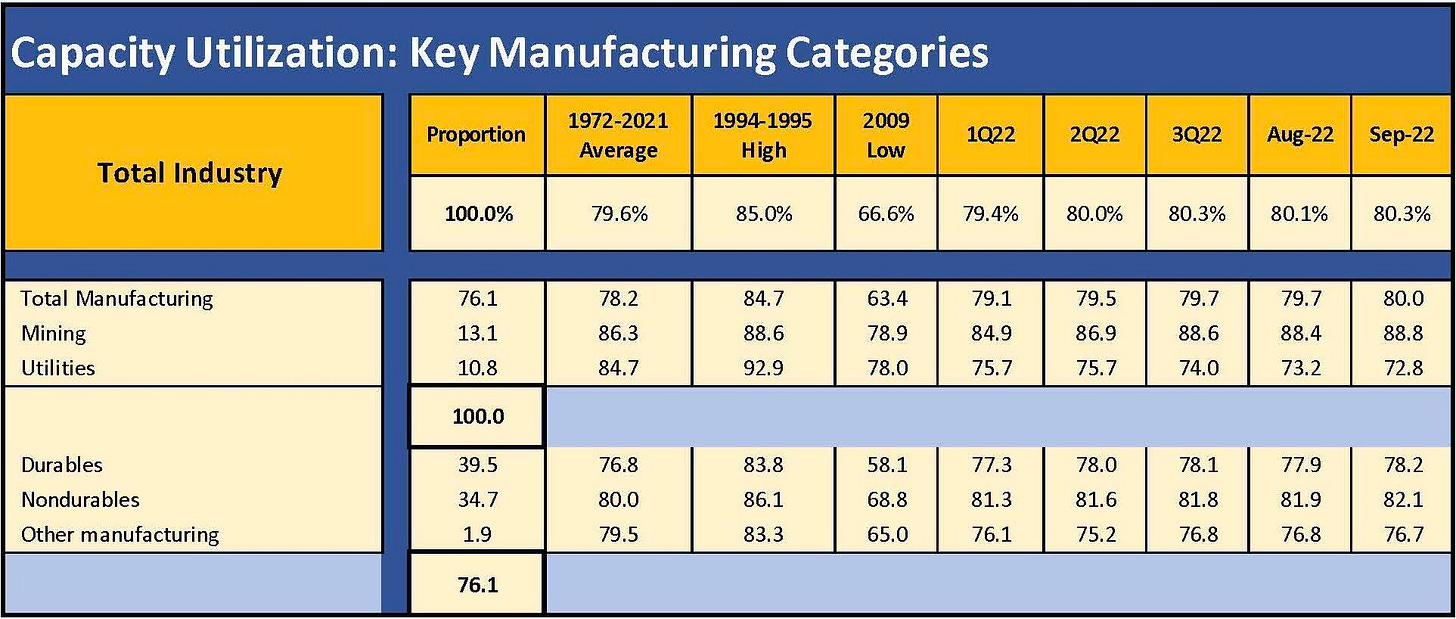
The capacity utilization numbers for Sept 2022 are just above the long-term total averages (1972-2021) for all industrials. The same goes for total manufacturing. This could signal more limited pricing power ahead, but supply chain distortions raise questions around “deliverable capacity.” The theory on when pricing power kicks in is less than straightforward at a time when freight and logistics have been in chaos and inventories for industries were running down. Inventory levels are correcting in numerous industries such as autos, but there are still plenty of headwinds. The takeaway on pricing power is that it’s still there in aggregate. The takeaway on capacity utilization in cyclical context is that these are quite steady and do not say “recession.”
Key takeaways
Capacity Utilization is a good monthly gut check: The Industrial Production and Capacity Utilization data release by the Fed each month is always worth a glance for hints of weakness in total or across the material line items in the various categories. In the charts, I compare the current numbers with multi-cycle long-term averages (1972-2021), strong cyclical growth years in the 1990s expansion (1994-1995), and the very ugly lows of 2009 in the post-crisis recession.
Cap ute run rate is helping the recession pushback theme: The high-level manufacturing line at 80% is above the long-term average and higher sequentially from 1Q22, 2Q22, and 3Q22. The breakdown into durable and nondurable has the same pattern. In other words, a 50-year low in unemployment and steady (if not overly impressive) rate of capacity utilization together do not tell a story of imminent recession. Some industries are still feeling the effects of dislocations (chips and autos at the top of the list), but a lot more needs to happen to make the bear recession case.
Industry groups are firm in durable and nondurables: In the chart above, I look at key industry groups within durables and nondurables, which carry the highest weightings and account for over two thirds of the weights in each category. We see Machinery and Fabricated Metals holding in well. Motor Vehicles are still struggling with supplier chain issues from critical components such as chips to important smaller nagging items such as blue ovals (Ford). The 75% capacity utilization is weak in relative terms given how successfully the OEMs restructured after the credit crisis. The Motor Vehicles line was routinely in the low 80% to some mid-80% levels in 2014-2019, so the production slowdowns have been notable. Aerospace is regrouping from the Boeing setbacks and slowing aftermarket demand from the COVID period. The 69% lows of 1Q22 have risen steadily through Sept 2022. Within durables, Chemicals and Food, Beverage, Tobacco lines are steady with Chemicals well above the long-term average.
The lows of April 2020 are otherworldly: As a conventional disclosure item, the Fed shows the 2009 lows for the post-crisis period. The April 2020 data was not included in the mix. I looked back at the May 2020 release for some lagging adjustments: the April 2020 lows during peak pandemic stress included 64% for total industry, 60% for Total Manufacturing, 54% for Durables and 67% for Nondurables. Motor vehicles dipped below 13% and Aerospace hit 50%. Plant shutdowns in major industries really move the needle.


