Capacity Utilization: Grinding Not Fading – Yet
Industrial production and capacity utilization is a pitched battle. Mixed so far in durables. We break out the details.
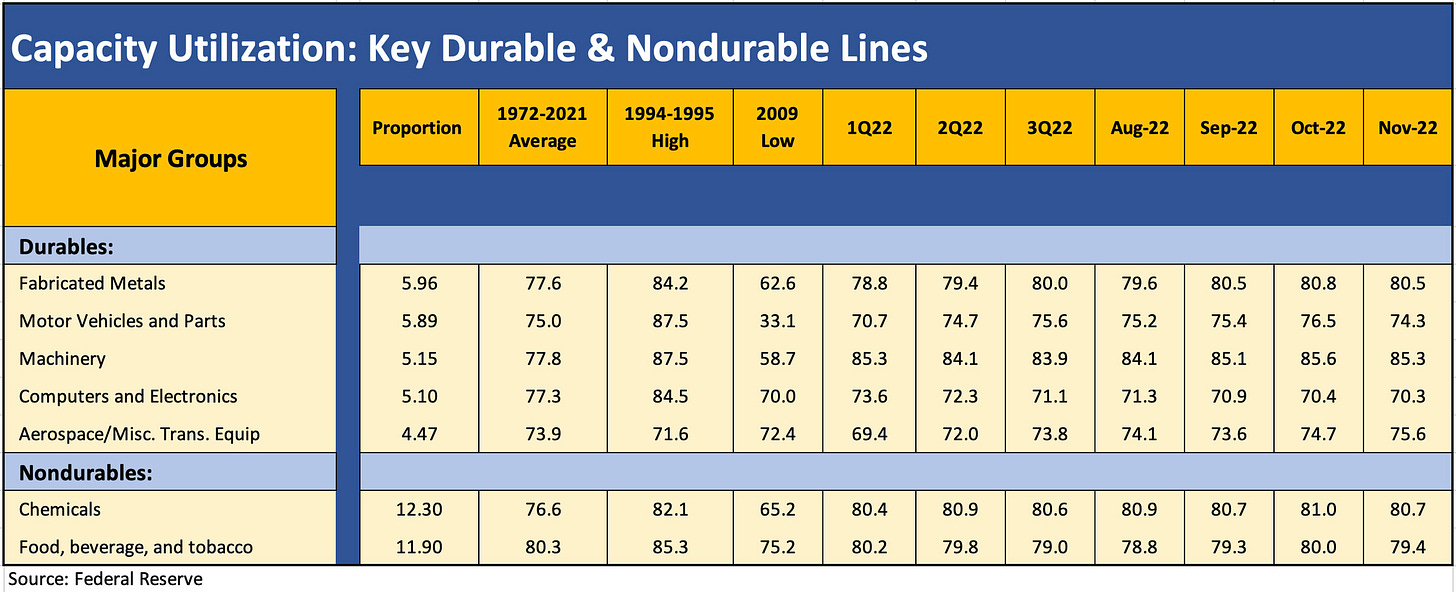
The sequential fade in the total manufacturing number raises some warning signs but most of the major durables subsectors have been strong to this point with Motor Vehicles seeing a weak November.
The fact remains that total capacity utilization is still higher YoY vs. 2021 and more than 5 points higher than Nov 2020, so the contraction debate will roll into the new year.
Leaner costs and lower breakeven volumes helped industrials across the post-crisis cycle, but the sequential cost pressures in wages and materials have changed the math in the post-COVID period.
We update our view on what the capacity utilization trends look like after last month showed a pretty solid set of numbers from the durables sector (see Capacity Utilization: Durables Still Steaming Along). The prior month was steady as well (see Capacity Utilization: No Recession Numbers Yet). The sequential drop in November and noisy Fed headlines naturally will raise questions around when inventories will be normalized by sector and when downstream demand will weaken. The expectation is that the cumulative effects of Fed actions weigh on a broader cross-section of manufacturing end markets. We look at some of those key durables sectors and their line items further below, but some of the key industries held in well.
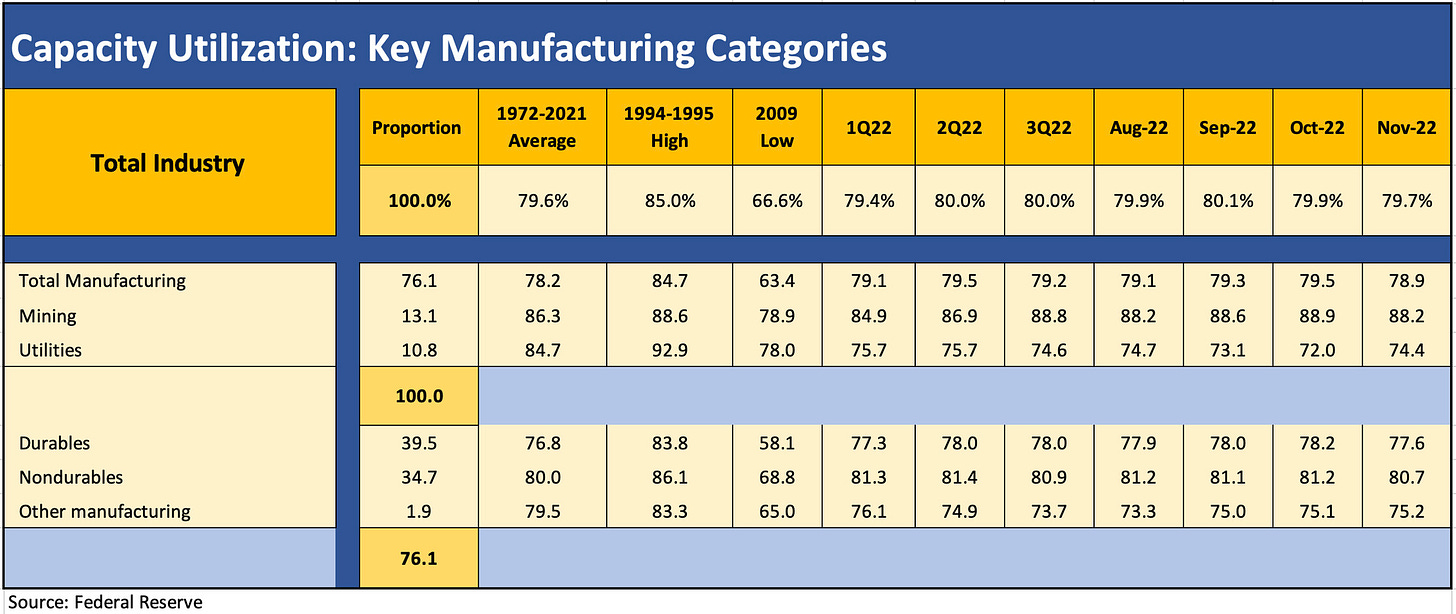
The chart below details the total capacity utilization trends in 2022 and recent months. We show the broad sector weighting in the index for various groups and detail the long-term averages across the cycles from 1972 to 2021. We dropped in the 1994-1995 highs as a memory lane item for how solid the utilization numbers can be. 1994 was a year of very aggressive Fed tightening and an ugly bear flattener of the UST curve, but it was also a somewhat early cycle year of the 1990s boom. The June 2009 cyclical low for utilization stood at 66.6% and was just one month of a year of bad data points for industries that saw annual numbers at 68.4%. As a reminder, the 2009 year saw the auto bankruptcy crisis and the multiplier effects of those disruptions.
For a cyclical frame of reference, the 79.7% total capacity utilization number in Nov 2022 stacked up well against the 79.0% of Nov 2021 and the 74.4% of Nov 2020, as the vaccine was just hitting the headlines. The annual utilization number for the COVID year of 2020 was 72.6% in a year that saw three 60% handle months in April, May, and June. The pandemic distortion still put up a much better year than the crisis transition year of 2009 when utilization weighed in at 68.4 % for the entire year. The peak year since 2009 was 2018 at 79.5% with 2014 at 78.7%. By that standard, the current run rates are still quite strong despite the tendency to do some serious extrapolation to sing a Bearish tune. The recession might come but these are not close to recession numbers.
The pre-crisis years of 2005-2007 saw 80% handle annual numbers each year in a reminder of how high utilization can have its drawbacks if demand is distorted by easy credit (housing) or driven by extremely friendly Fed policies. In the recent period, the combination of ZIRP, pent-up demand, or artificial supply-demand dislocations can allow pricing to move materially higher and support producers’ earnings at lower capacity utilization levels than they needed historically. The whole topic of breakeven volumes gets into assumptions on pricing, mix and cost structure that are going to be all over the map in 2023.
The chart above breaks out the higher weighted durables line items (we cite the weights on the left). The list is more reassuring than not despite the snapshot headlines that came out this morning. Follow the bouncing numbers across 2022 and 4 of the 5 largest durable sectors are looking solid vs. 2022 ranges even if Autos is inevitably going to be erratic around supply chain issues and production rates. Bellwethers such as Machinery and Aerospace held up well enough. The same for Fabricated Metals. Our view is on “team recession” for 2023 but these numbers or the sequential trend do not make that case yet.


