Capacity Utilization: Manufacturing Puzzle Box
We look at the trend line for Industrial Capacity Utilization as Durables shows some modest weakening in an overall balanced month for the total index.
“Is there an economic Hellraiser in our future?”
The trend line for industrial production and capacity utilization got some curveballs in March with the waves of annual revisions, and we update the trends including those revisions.
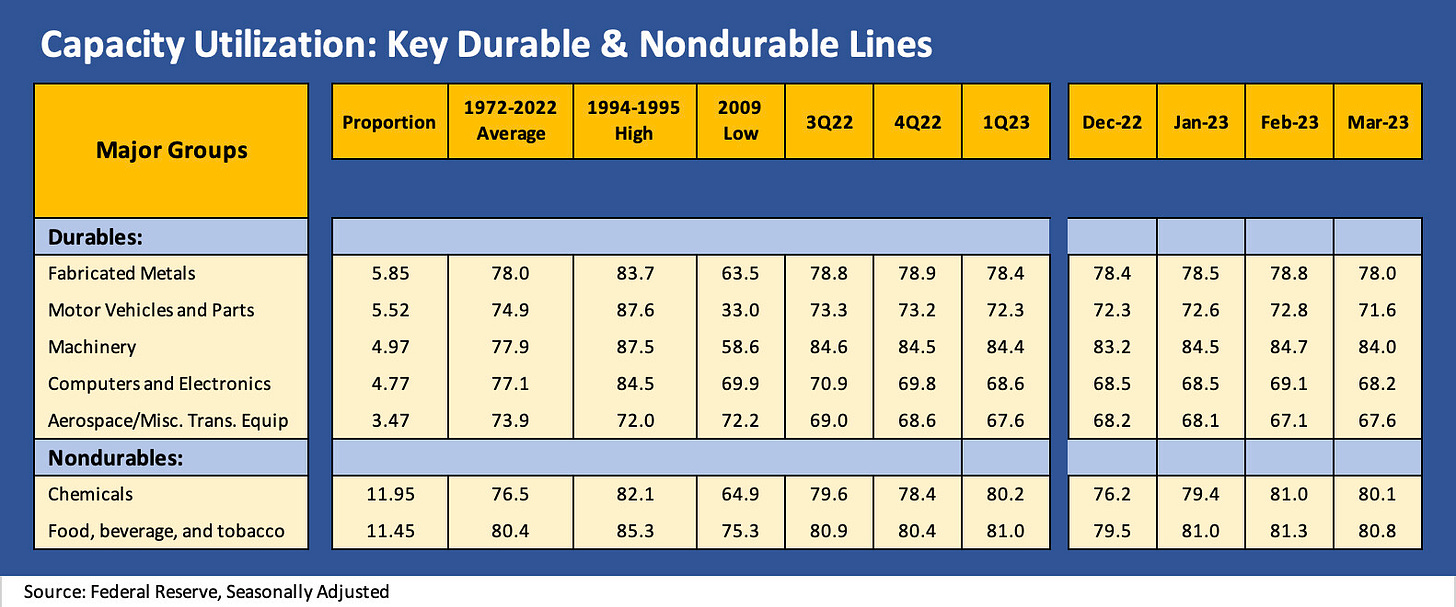
The net takeaway from the new Industrial Production data is that durables capacity utilization is flagging with 4 of the 5 largest durables sectors easing sequentially.
Nondurables are hanging in so far in 2023 in a relatively tight range with 2H22.
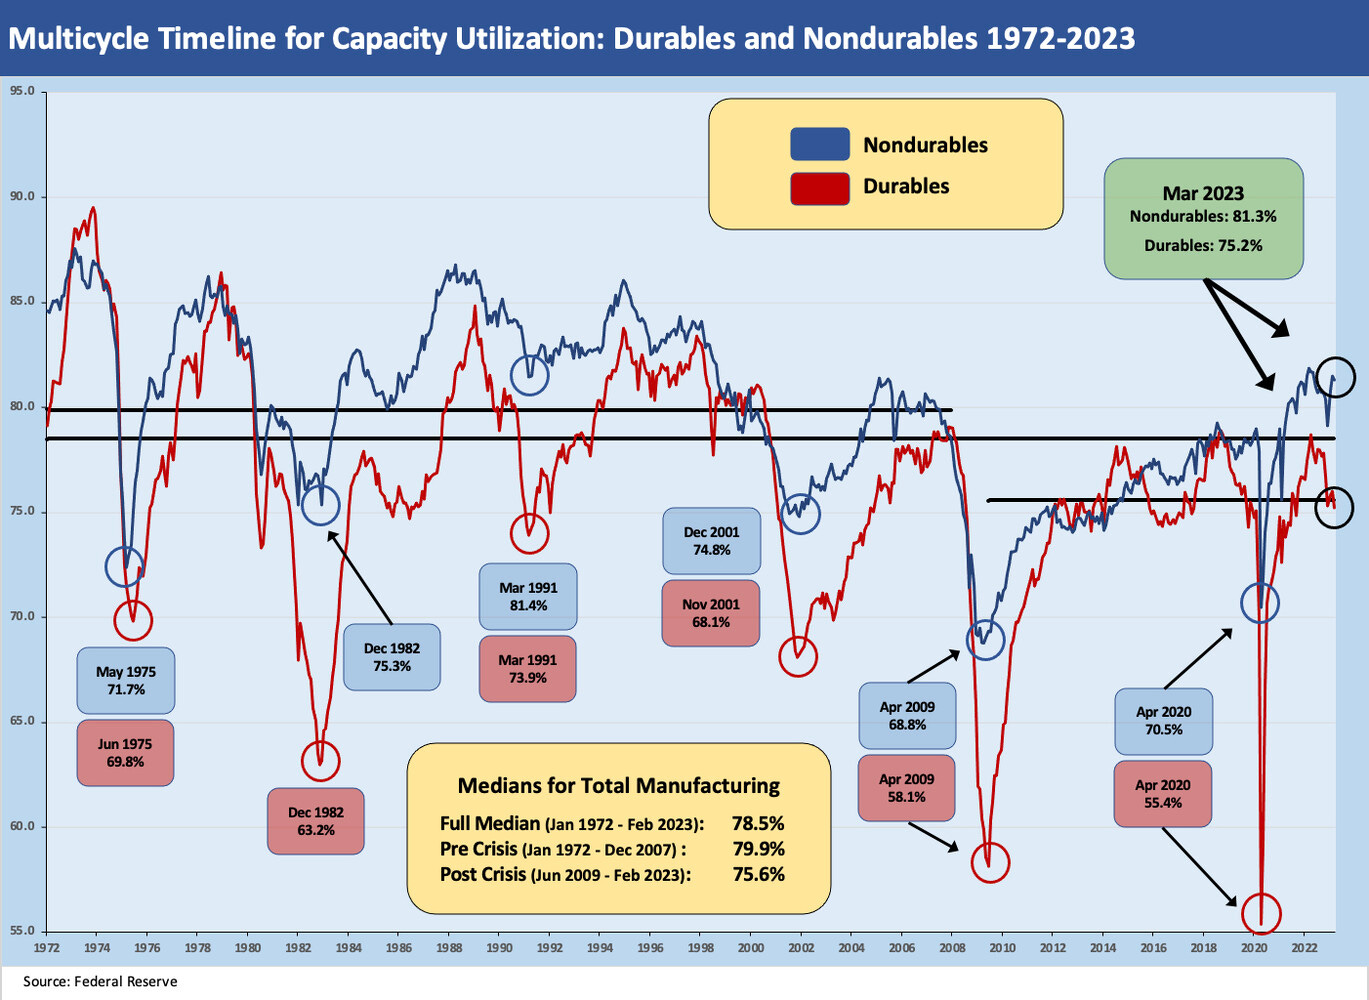
In the above chart, we plot the Durables and Nondurables capacity utilization timeline (“Cap Ute”) across the cycles with some key time period medians as frames of reference. We flag some recession lows as a reminder of how low a hard landing can go. When you hear from a bear how bad things are, these numbers offer a reality check on what is “bad” vs. what is just sequentially weaker and ripe for fresh handicapping.
The real plunges in Cap Ute take place under unusually bad circumstances such as when hard landings unfold (1975, 1982) or major industries face a demand crash with inventory overhangs (2009). We would argue that 2001 was a soft landing for the broader economy, but there was a hard landing in some select manufacturing, supplier chain, and utility subsectors. The 2001 Cap Ute was much worse in a handful of industries in manufacturing. There is no question 1991 was a hard landing, but the Fed rode to the rescue.
We discuss our main reasons for watching this Cap Ute metric in earlier commentaries (see Industrial Production: Flat for Now, New Downside Risks Loom 3-17-23, Capacity Utilization: Durables Still Steaming Along 11-16-22). The Cap Ute monthly data is one of several benchmarks that offer good monthly gut checks, and the signals so far are showing some softening in pockets but no broad weakness yet.
Durables are running below the long-term average but ticking only slightly lower in the newly revised numbers. Nondurables are above long-term averages and are holding in well in 2023. As we break out below, the Durables line items have plenty of end markets to consider with a diversity of cyclical dynamics.
Capex as the swing factor…
The Goods market has been showing some weakness in 2023 vs. Services, and the ISM manufacturing numbers have kept markets on edge around manufacturing prospects. The ISM started off the month of April with the lowest reading since May 2020, so that is not helping sentiment. Fears around potential consumer weakness and tighter credit conditions factor into a mixed view of what lies ahead in Manufacturing. Housing markets, commercial real estate, and construction question marks in some major segments add to the concerns.
We expect manufacturing overall to remain resilient on capex needs and the preparation for potential US-China trade stress in the future. The supplier chain risks will need to be addressed regardless of the cycle. While there is plenty to worry about at the macro level (notably credit contraction, recession risk, weaker real estate markets in residential and key areas of commercial), the more positive side of the ledger ties into the need for more capex across many industries.
The “need to invest” is a theme for a wide range of industries with the infrastructure bill and the IRA in theory driving capital budgeting priorities and opportunities. The use of free cash flow for capex rather than buybacks (or a more optimal mix) is on the menu of outcomes. The secular and cyclical mix takes industry and issuer level homework, and new capex guidance in 1Q23 earnings season will make for interesting inputs.
The monthly chart exercise…
As a reminder on this monthly drill, we update total capacity utilization each month and then drill down into the two major Manufacturing categories (Durables, Nondurables) that make up over 74% of capacity utilization. Mining and Utilities account for the remainder at around 26% of the index. We detail the proportions in the chart. We adjusted for all the revisions that were provided by the Fed in a late March release that flowed into the monthly “G.17” report on Industrial Production posted today.
We also break out the leading industry groupings within Durables and Nondurables for signals on who is rising and falling and where we can expect to see some signals around pricing power. The relationship between capacity utilization is reasonably intuitive even if never simple given the layers under those macro measures.
The next round of questions would delve into capacity and demand by product categories or such factors as the role of imports in the pricing picture. The monthly Industrial Production and capacity utilization exercise is a “numbers drill” that frames the macro metrics, and that in turn feeds into the next tier of micro analysis at the industry and company level.
Mining has been strong vs. historical averages even if the market saw a downtick in March vs. Jan/Feb 2023. Utilities can have material seasonal swings and we just saw another one.
The major line items in Durable and Nondurables are broken out above. The latest revisions flowed into every column, and we made the tweaks in the above where needed. The most visible trend is that 4 of the 5 largest durables lines weakened sequentially. If we frame current run rates in durables vs. long term averages, 3 of the 5 line items are running below the 1972-2022 average (Motor Vehicles, Computers, Aero), one is flat to the average (Fabricated Metals), and one is running well above (Machinery)
Aerospace ticked up, but this release comes just after Boeing announced a need to slow production. The Aerospace and Defense industry broadly is doing well on defense needs and Ukraine demands, but commercial aerospace is a dog fight across the OEMs and supplier chain, who are all looking to exploit a very strong airline industry recovery after the brutal setbacks during COVID and the 737 MAX crisis. At a 67.6% Cap Ute rate, Aerospace is well below the long-term average of 73.9%.
In Nondurables, Chemicals has always been a strong industry for the US as a low-cost producer in some of the highest volume commodity chemical segments with the US benefiting from a natural gas based feedstock cost advantage. Cap Ute for the Chemicals sector at 80.1% stacks up well against the long-term average of 76.5%. Food, Beverage, and Tobacco is just slightly above the long-term average at 80.8%.


