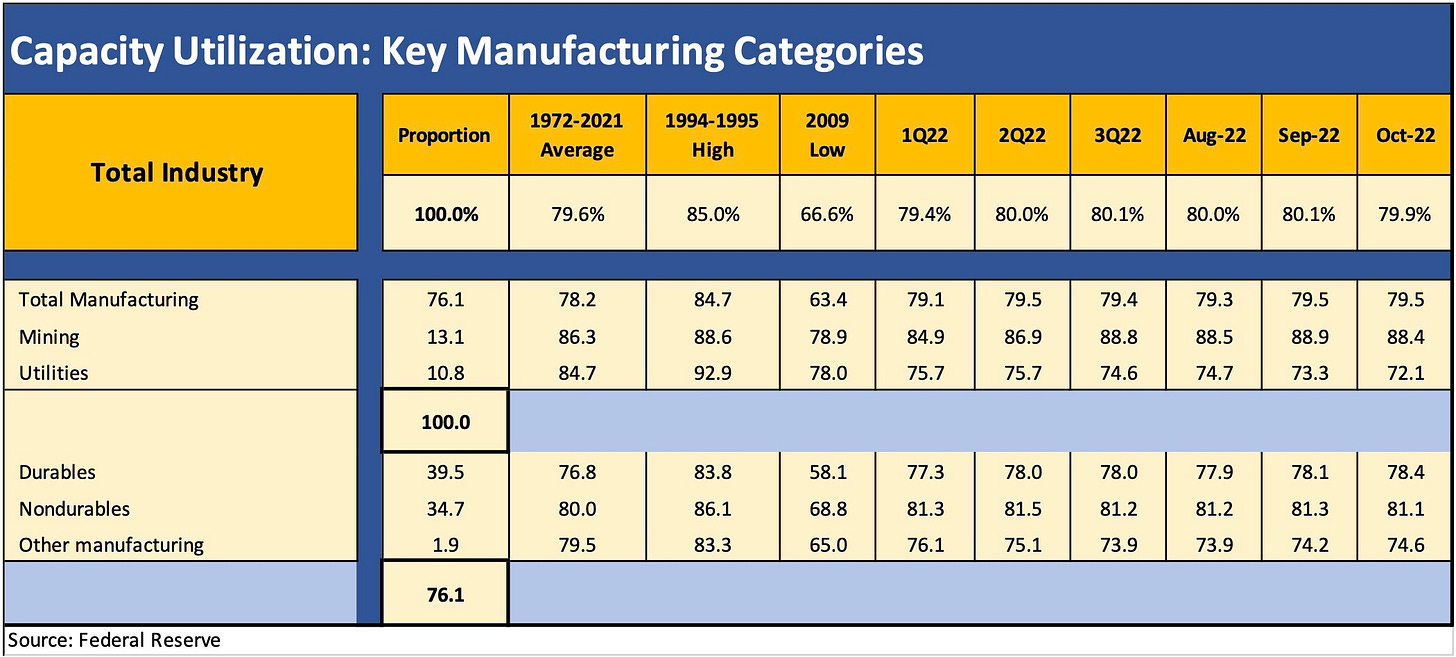
Capacity Utilization: Durables Still Steaming Along
Industrial production hanging in better than expected with durables firm. Inventory and the cyclical checklist a challenge.
Highlights:
Total Industry capacity utilization ticked down slightly to 79.9% from 80.1%.
Total Manufacturing Cap Ute was flat sequentially after revisions.
Durables utilization was higher and still solid.
Nondurables ticked lower but still in a tight band in 2022.
Mining and utilities were weaker.
Still not a case of recession numbers, but nondurables tapping brakes…
Having started my credit career in the manufacturing maelstrom of the early 1980s (autos, cap goods, steel, metals), I watch the manufacturing sector out of necessity and nostalgia. The Industrial Production numbers are on the short list of items that set the decision-making table for the Business Cycle Dating Committee over in NBER-land (See Business Cycles: The Recession Dating Game).
As with the September numbers, the manufacturing sector metrics in October are still not saying “Recession” (See Capacity Utilization: No Recession Numbers Yet). There are plenty of leading indicators to economic weakness out there in various industries at the micro level, but this one is not there yet. The strong performance of “heavy” (or heavier) industries was solid while nondurables softened slightly at the headline level. Even nondurables were more mixed in the line item ranks. As broken out in the charts herein, Mining and Utilities came up weaker.
Industrial production and capacity utilization are still crucial metrics to monitor even in a services-heavy economy. These are priority metric even if Retail Sales grabs more headlines (Retail Sales were stronger than consensus this morning). A lot of services industries are fed by the manufacturing chain. Those trying to handicap recession risks and hard landing scenarios will want to watch durables closely given some of the secular shifts where manufacturing capacity is supposed to be redeployed (as in reshored or onshored). Nondurables are holding in well enough, but this is where consumer spending weakness could start to offer hints. I don’t see many yet.
The line items for Durables are reassuring to those thinking soft landings. Solid numbers in Durables pushed back on the hard-core cyclical bears. Autos especially has a lot going on with investments in the secular shift to EV and the need for sustained buildout of capacity at the OEMs and battery capacity planners. Then there is the simple reality of artificially low production volume in 2020-2021 tied to supplier chain problems (notably chips) that left OEMs producing at recession levels in some cases. Toss in infrastructure spending, and the capex cycles for some subsectors are more secular in profile than cyclical.
We see solid numbers in Motor Vehicles, Machinery and Fabricated Metals. Those are the three largest categories by weight in Durables. Even Aerospace with its myriad problems on the US side is showing some resilience. Defense and Energy spending over the near term (2013-2025) offers some constructive stories to work into expectations, but those are for another day.
Capacity utilization theme music…
One of the biggest mega-trend themes ahead is reshoring and nearshoring (e.g., Mexico), and the manufacturing subsectors are at the heart of such supplier chain and finished goods structural evolution. EV supplier chain and Semiconductors are near the top of the strategic priority list, and the China rivalry will remain a big debating point in terms of “how far, how fast” to use Industrial Policy measures to ramp up (anathema to old line conservatives, but the tune is changing).
Manufacturing metrics are near the top of NBER’s list of good reasons. Manufacturing is over three quarters of the weight assigned in Capacity Utilization and just under three quarters of Industrial Production (“IP”). IP and “Cap Ute” are essentially part of the same branch on the same tree, and the line items can reflect the trends in overall economic multiplier effects upstream and downstream. Manufacturing makes a lot of industries tick in both goods and services. Materials, Freight and Logistics, Processing Industries, Finance, Insurance, and Retail all get touched by a finished goods order. That is why the imposition of tariffs needs to be very measured and well thought out so not to upset that chain or the working capital cycles.
The lessons from the post-crisis period are that industrial and manufacturing operations were able to make very solid profits at much lower average capacity utilization levels. The reaction coming out of the 2008-2009 crisis was to “get lean” through lean manufacturing practices, lower breakeven rates, and in many cases continue to find lower-cost global supplier chains (China and Mexico near the top of the list). The China connection will face a lot of challenges ahead, a trend which may strain breakeven volumes and test global competitiveness. These will be battles in Washington for another day.


