
Auto Sector Equity Performance Update: The Dealers
In connection with our AutoNation Credit Crib Note, we update where the dealers stand in equity performance with the OEMs and Used Car players in the mix.


We run through various time horizon returns on the public auto franchise dealers, the used car retail operators and related service companies, and the major OEMs.
We frame the #1 public dealer based on units (Lithia) against the #2 player (AutoNation), who Lithia dethroned after a massive stretch of M&A and related debt and equity issuance.
The auto dealers have mostly materially outperformed the Equal Weight S&P 500 index across a period that included a pandemic, a supplier chain crisis, a tightening cycle and the weaker affordability metrics for both new and used vehicles.

This commentary is a low ambition reconciliation of relative stock performances over various time horizons of the public franchised dealers, the major mass production OEMs operating across those dealer networks, and the used car specialty players and related service operators.
The above chart plots the total return path for the current #1 and #2 public franchise dealers, Lithia and AutoNation, since the start of 2019. We don’t have to recap what a strange running period it has been for the consumer. The timeline saw a pandemic, a supplier chain crisis, a spike in inflation, aggressive Fed tightening, and sharply higher financing costs (for dealers and customers alike).
Both Lithia and AutoNation had been very strong performers across that time. We included the Equal Weight S&P 500 ETF (RSP) above to cast a wider net on the comps in equity performance, but AN and LAD were dramatically ahead of the broad market cap weighted S&P 500 as well over this time horizon. The next table also includes the market cap weighted S&P 500 with all of its tech-driven and MAG 7 glory. We see AN well ahead of the S&P 500 over 3 years and 5 years but modestly lagging over 10 years.
The Lithia pattern above cuts across more than 5 years through Friday close (+243%) and is especially interesting even though it falls well short of AutoNation’s performance (+359%) with both of them easily beating the Equal Weight S&P 500 (+97%).
Lithia shows “the buzz” of its very aggressive digital retail and used car strategy back in 2020-2021 when Carvana was also flying higher with its digital strategy before crashing back to earth on its way to a debt restructuring guided by bondholders. CVNA is back up and flying again, but the used car strategies by dealers have had mixed reviews on the equity side of late for those who went into stand-alone used operations most aggressively.
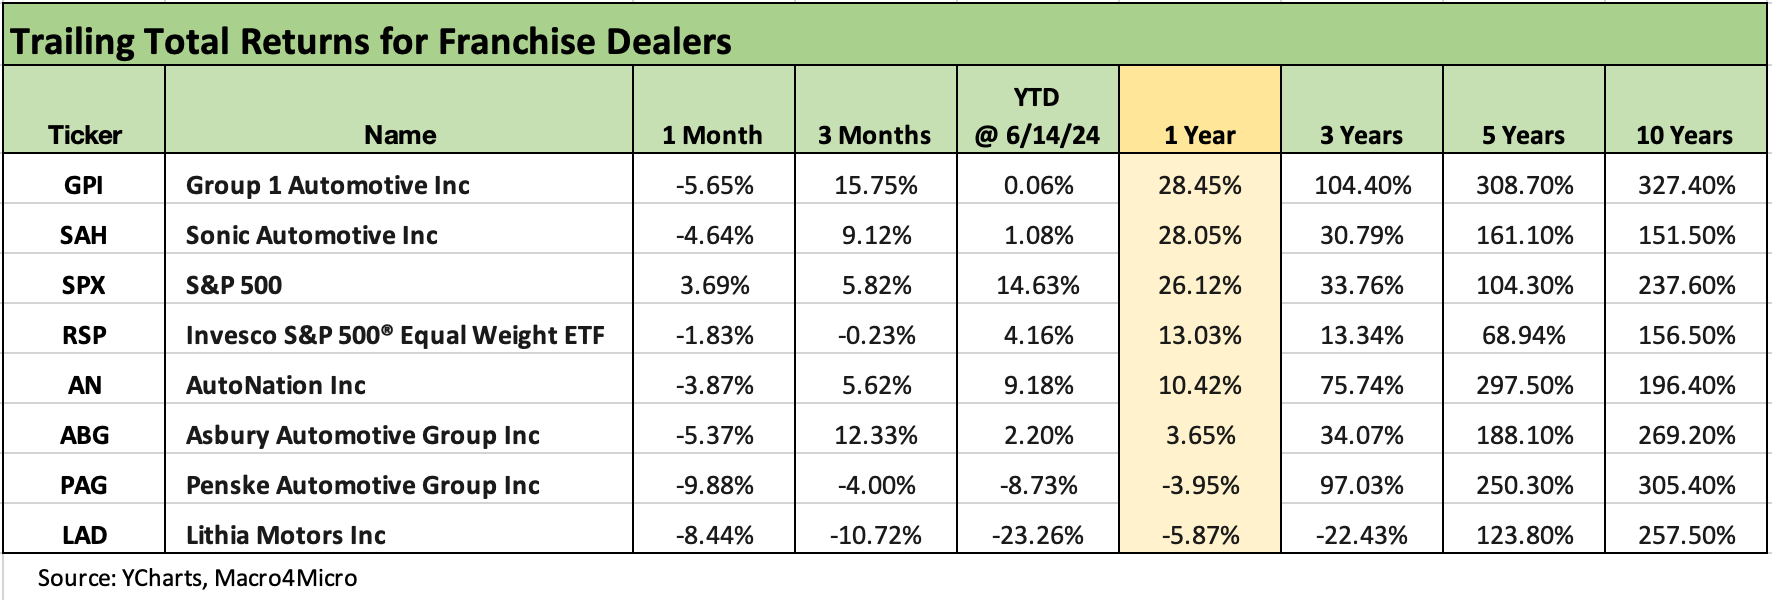
The above chart shows the broader peer group of the Big 6 public dealers, and performance has been solid in recent years with Group 1 (GPI), AutoNation (AN), and Penske (PAG) the winners over 3 and 5 years. Looking back 10 years, PAG and GPI were the biggest winners vs. the broad market with the winners north of 300% (GPI at +327% and PAG at 305%).
Looking back 1 year, we see the sector on average lagging the broad market as growth expectations start to fade and used car exposure is somewhat in disfavor with the exception of the post-restructured CVNA as that company is finally showing both revenue growth and positive EBITDA (see Carvana: Counterattacking in Style 5-6-24).

The above chart offers some flavor on how the OEM “suppliers” of product (and wholesale credit) to the dealers are faring in a market where volumes are off the supply-constrained lows but pricing is flagging and customers are facing affordability problems on borrowing cost pain in the tightening cycle.
The range above shows Ford and Nissan sitting on the bottom over the past year with Hyundai, Stellantis and GM above the S&P 500. The year to date period in 2024 is all over the place but still showing Hyundai and GM well above the pack.
Looking back across 5 years, the Auto OEMs overall turned in a strong performance as the crow flies across COVID, the supplier chain stress, and the tightening cycle. Up until a sloppy period YTD for more than a few OEMs in the stock market, you might not have guessed that Stellantis would be in the consistent group with Hyundai and Toyota. Nissan has had more than its share of trouble over time while Ford has been struggling again over the past few years. Honda also has been a laggard.
The net takeaway from the OEM chart is that it offers a reminder of why the franchise dealers diversify across brands.
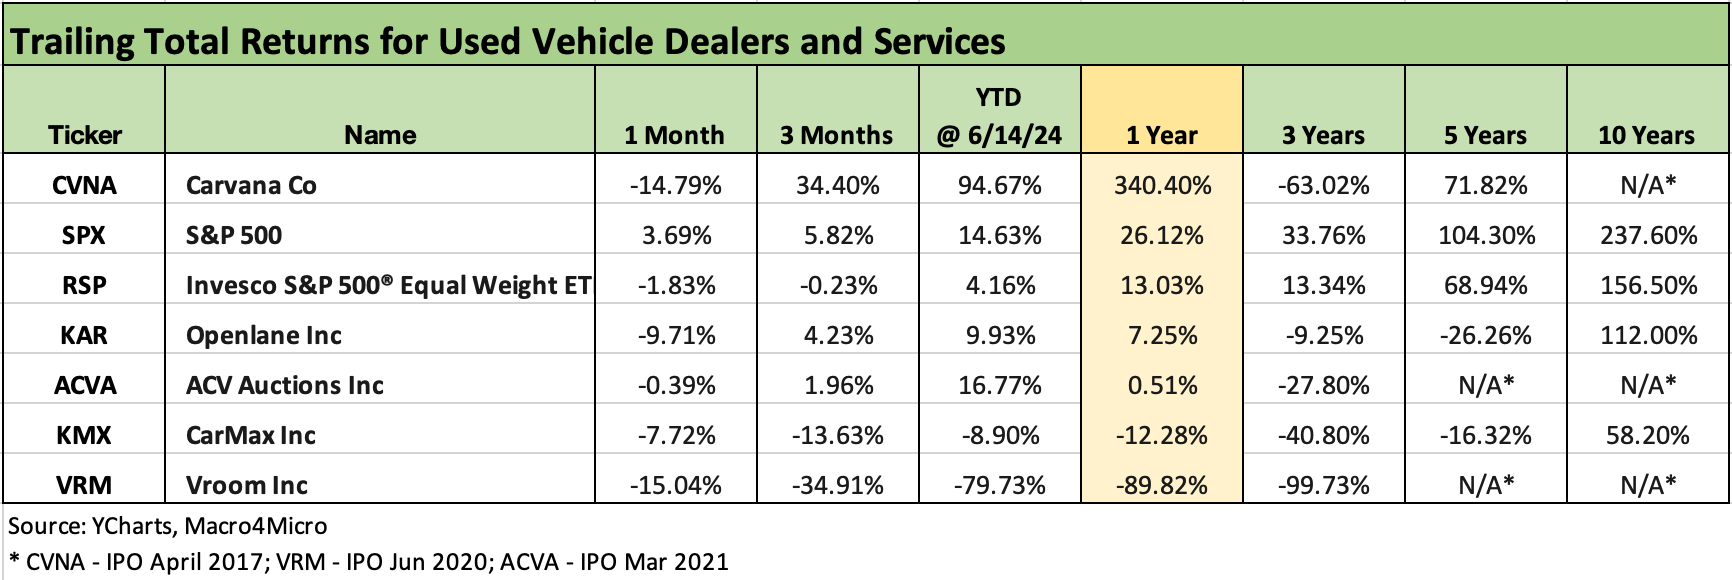
We add in the above chart to round out the peer group of auto cycle exposed names. These names are more exposed to used cars and the related services chain from auctions to digital retail to full service used car dealers. CarMax (KMX) and CVNA are the highest profile names. KMX is a traditional real estate intensive retail model shifting its business into a more digital and omnichannel strategy ( Credit Crib Note: CarMax (KMX) 2-21-24, CarMax: Credit Profile 7-9-23). KMX reports 1Q25 earnings on Friday (KMX is a Feb fiscal year).
For its part, CVNA is by far the lead player in digital auto retail and has been back on the rise after facing a liquidity crisis and inability to pay its interest. The bondholders stepped in and saved the company given the intrinsic and substantial value of its digital franchise. CCC tier bondholders took a material impairment in a distressed exchange, but CVNA has been finally starting to prove its model (belatedly) in a market where sourcing used cars will remain a challenge.
We included Vroom (VRM) on this list for one last time, but it has now exited digital used car retailing and e-commerce business and will settle into a role in auto finance. Over 3 years, VRM has returned a -99.7% stock return. We see a couple of IPOs from the COVID cycle and later in the chart above including VRM and ACVA. ACVA has also struggled in its stock performance.