


Giant ANT something to watch in scarier times…
We looked at what was a devastating week in tech in a separate commentary. That week ended with an especially brutal Friday as NVIDIA (NVDA), Micron (MU) Advanced Micro (AMD) and the Semiconductor Index (SOXX) posting double-digit negative returns just on Friday. The returns were much worse for the week with MU, NVDA, AMD and Taiwan Semi (TSM) posting -20% handle negative returns (see Asset Returns: Tech Check 11-21-26).
When the VIX hits 40+ as it did on Friday, history usually flags that as a buying signal, but there is a lot of debate to unfold in coming days on AI and any risk of revised spending plans in the sector. Trump was on the warpath on Friday demanding that all data centers be built in the US. That will raise many questions in capacity potential and thus growth potential with so much data center opposition at the state and local level. That also flows into the myriad non-tech industries that are influenced by capex and infrastructure decisions and power and water needs.
The benefits of AI ecosystem multiplier effects have been in evidence along the GDP lines in fixed investment (see 3Q26 GDP: Happy Days?). We get the 2nd estimate on 3Q26 GDP this week. The AI capex boom has generated benefits across industry groups from commodities and materials to manufacturing to freight and logistics and financial services among others. Any nerves around the AI-related demand forecasts or the pace of investment could spill into the broader array of industries. We saw this concern the past week. All 11 S&P 500 sectors were negative.
The week brought an Anthropic (IPO priced at $83) that sent the stock flying toward a $2 trillion valuation before retreating back closer to the IPO price and closing Friday at just under $89. With the ticker ANT, we could not resist the pic above revisiting the classic 1950s era science fiction horror film THEM. After all, the ANT offering documents include risks of threats to humanity. Lately, many people are wondering openly on AI threats after a rough week in systems meltdowns.
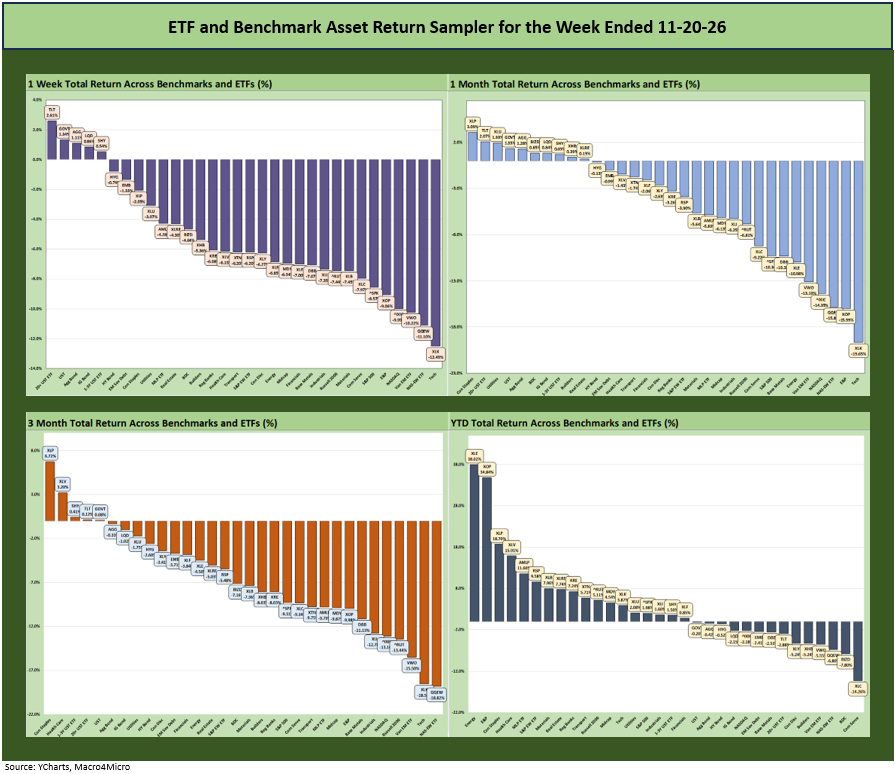
The above chart presents the positive vs. negative mix for the 32 benchmarks and ETFs in our asset return update for 1-week, 1 month, 3 months and YTD. The YTD returns is the only timeline showing some balance as life started to get more challenging in the late summer/early fall on the way to a brutal trailing 1 month period and a steep sell-off this past week.
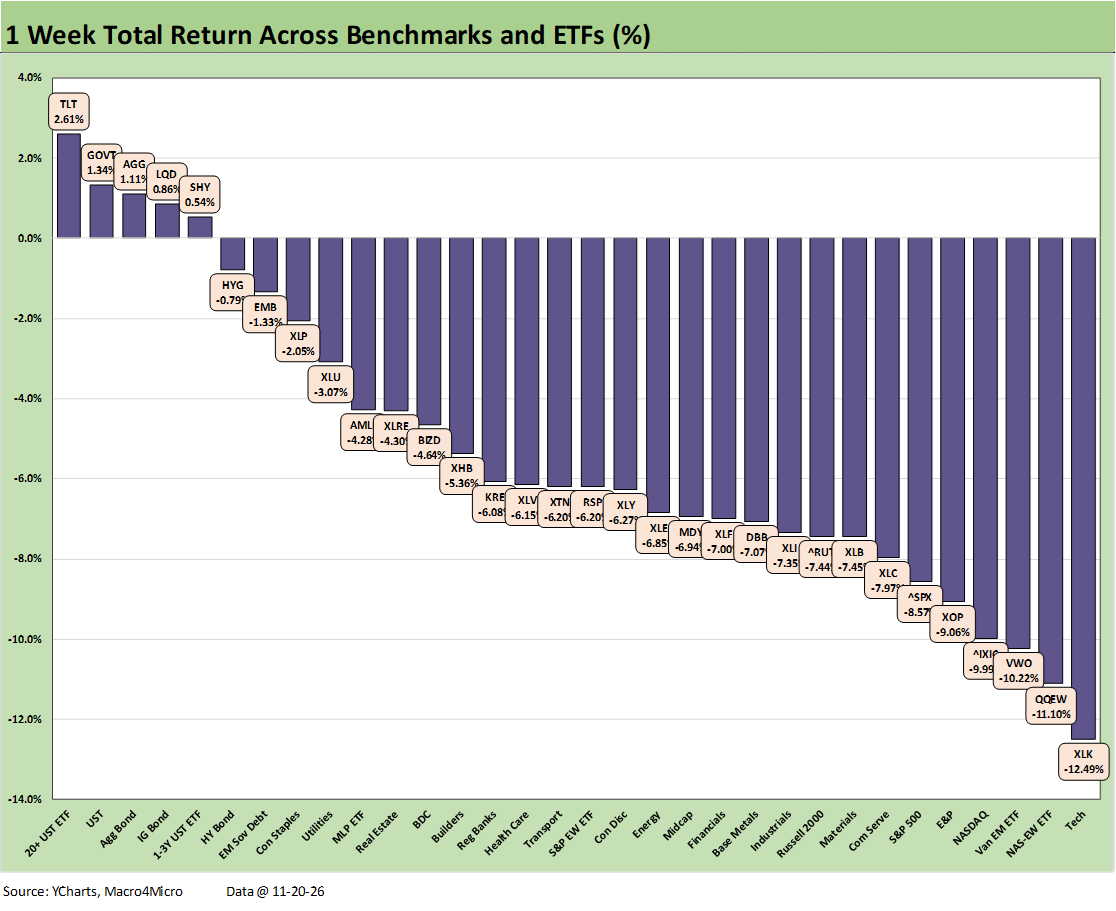
On the commodity side, the expectation of lower oil prices in the face of expanded supply shows up in the weak returns for the E&P ETF (XOP) in the bottom quartile. Lower refined product prices will take time to work their way downstream into the end markets after working capital cycles get there. The market has seen weakness in some base metals also with some nerves around weaker copper prices and demand questions around the heavy data center end markets and the AI-related infrastructure needs in power.
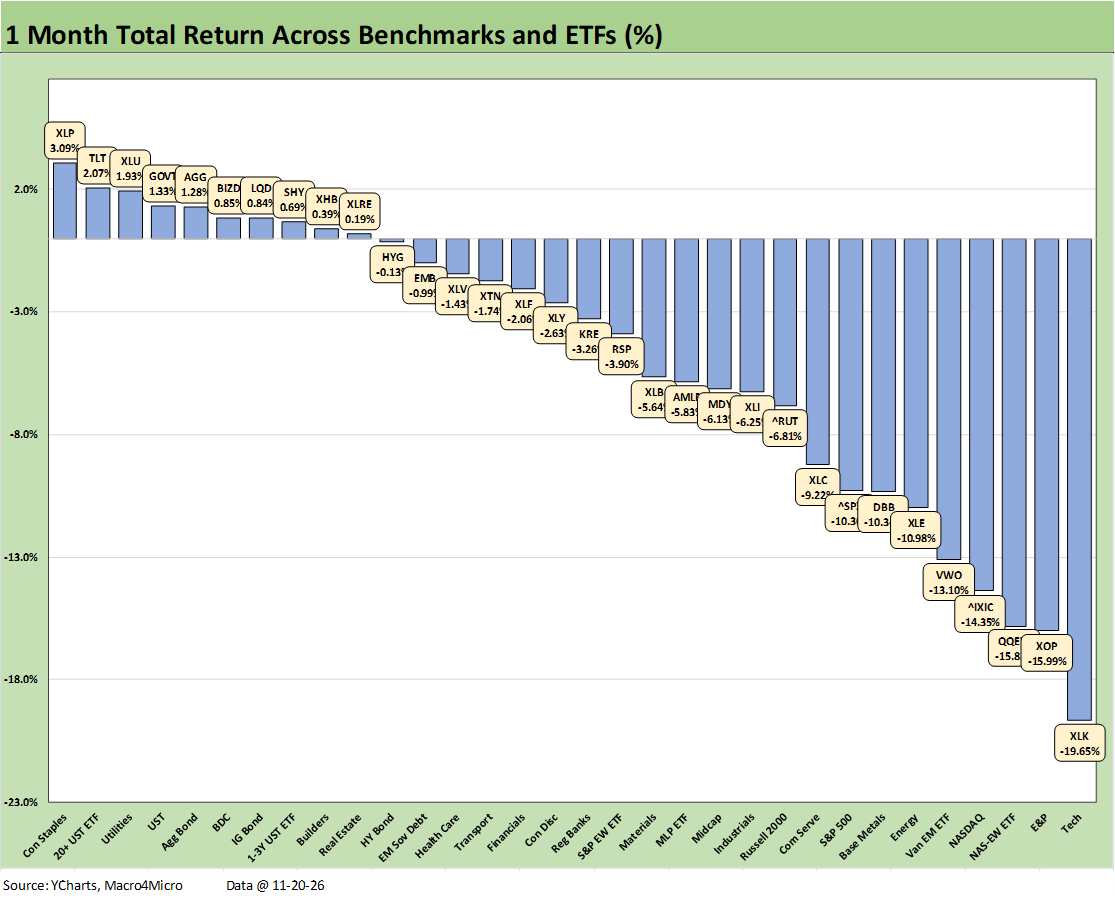
The 10-22 score for the 1-month timeline shows bonds leading the count in the top quartile with interest rate sensitive assets performing better in relative terms. In the top tier, bonds were joined by higher quality dividend stocks including Consumer Staples (XLP) at #1 and Utilities (XLU) at #3 with the long duration 20+Y UST ETF (TLT) at #2.
This past month gave another positive vote to the BDC universe (BIZD) in a post-earnings season signal that the sky is not falling in what is a very diverse asset base in the BDCs structure with very high dividend yields.
The bottom quartile also shows the fallout in tech with the Tech ETF (XLK) in last place at -19.7% with the Equal Weight NASDAQ 100 ETF (QQEW) 3 off the bottom at -15.8% and the broader NASDAQ 4 off the bottom at -14.4%. The tech-heavy S&P 500 is at the top of the lower tier quartile at -10.3% with the Communications Services ETF (XLC) at the bottom of the 3rd quartile at -9.2%.
We again see energy weakness in the results with the E&P ETF (XOP) and Energy ETF (XLE) in the bottom tier joined by Base Metals (DBB) at -10.3%.
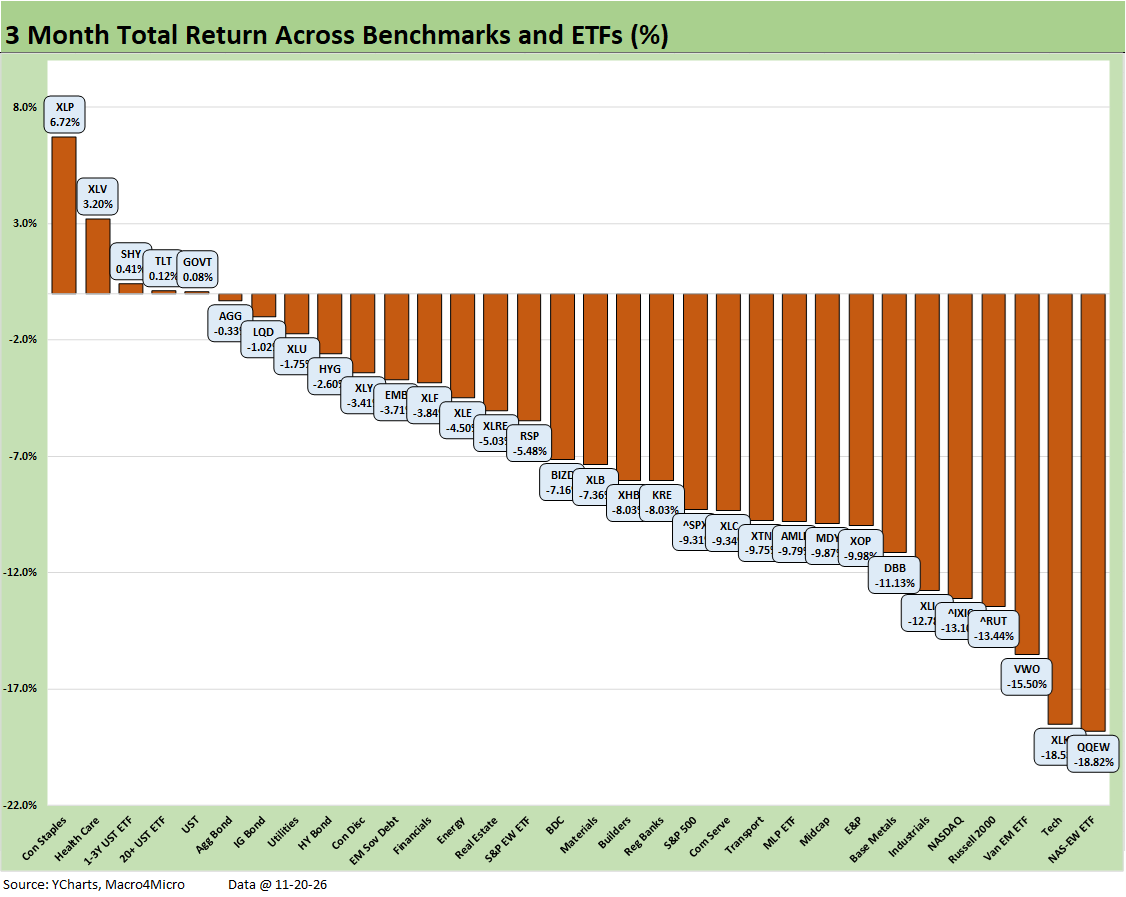
The 3-month performance shows bond ETFS leading the upper ranks with the higher quality and dividend heavy and/or defensive equity ETFs in the winner ranks. That includes Consumer Staples (XLP) again at #1 as we saw in the trailing 1-month and the defensive Health Care ETF (XLV) at #2 with Utilities (XLU) rounding out the upper quartile. The top quartile includes 5 of its 8 members being bond ETFs.
The bottom two asset lines in the low quartile are the Equal Weight NASDAQ 100 ETF (QQEW) in last place at -18.8% and the Tech ETF (XLK) in 2nd to last at -18.5%. The bottom quartile included the NASDAQ in the bottom 5. Once again, we see E&P (XOP) and Base Metals (DBB) in the bottom tier with commodities pressure.
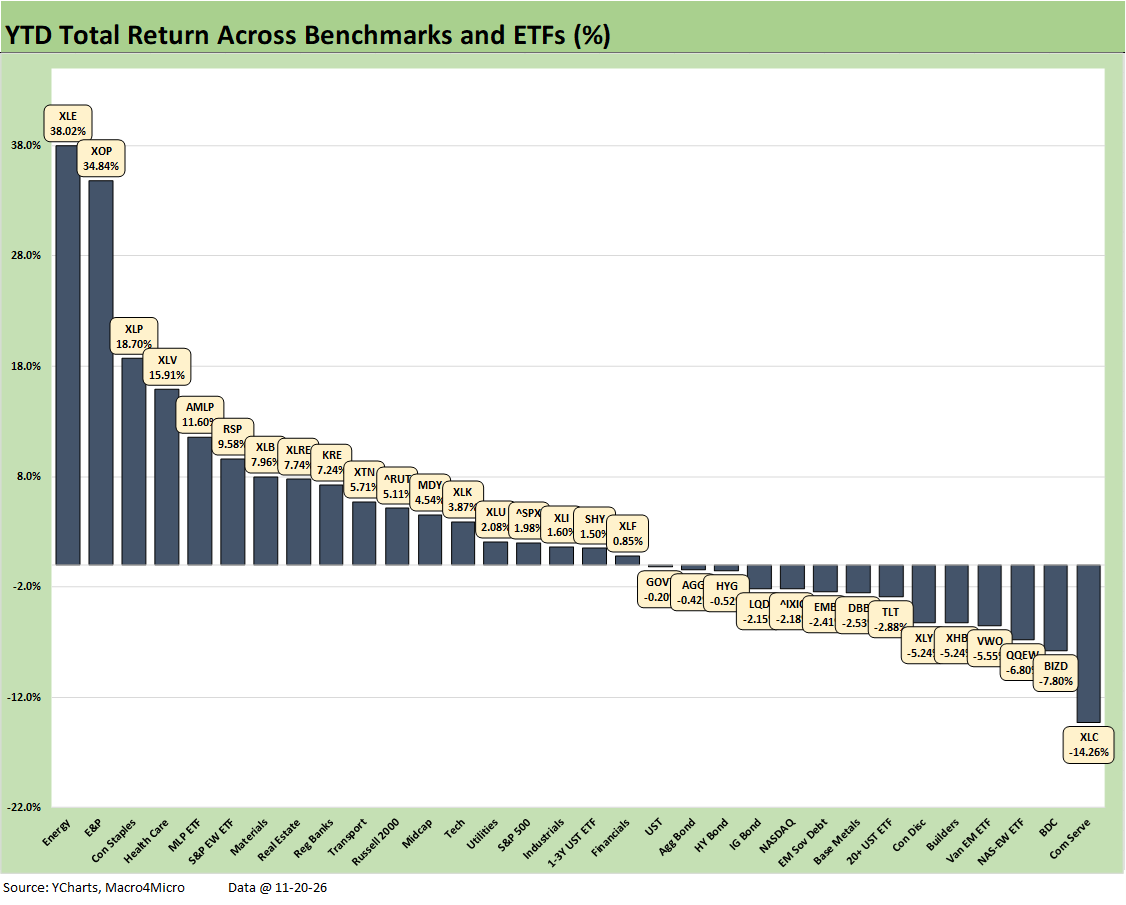
The YTD returns for the broader mix of 32 posts a score of 18-14 with tech and interest rate sensitive asset lines more prevalent in the bottom tier. The top tier has no tech and includes 3 energy ETFs with the broad Energy ETF (XLE) at #1, E&P (XOP) at #2 and Midstream (AMLP) also in the top 5 joined by Consumer Staples (XLP) and the defensive Health Care Equity ETF (XLV).
The steep tech selloff later in the year pushed the Tech ETF (XLK) down near the middle of the 2nd quartile with the tech heavy S&P 500 two notches below that and NASDAQ closer to the bottom of the 3rd quartile. The Equal Weight S&P 500 ETF (RSP) was in the top quartile at +9.6%, which is well ahead of the S&P 500 at +1.98% in the 3rd quartile.