

The House of Pain moves from “Jump Around” to plunge.
We detail a week of serious tech suffering with the Friday numbers especially ugly as VIX crossed the 40 line, the Dow and S&P 500 moved into correction range (i.e. crossed the -10% line from the peak), and the NASDAQ index was flagged as hitting bear status intraday (i.e. -20% line).
The poor performance in broader benchmarks reminds us how much is at stake in the AI investment boom from materials to semis to construction and services (notably financial services). NASDAQ at -10.0% for the week, the S&P 500 at -8.6%, the Russell 2000 at -7.5%, and Midcaps at -6.9% drive home the breadth of the market backpedal.
The response of the main players in AI investment and notably the hyperscaler capex leaders will directly influence market perception of AI confidence and support for data center and construction needs. The double-edged sword is that an affirmation of capex levels might lead investors to conclude that Big Tech is “chasing the dragon” at the expense of financial risk even if unchanged capex reaffirms demand for semiconductors and related infrastructure (Dell and servers etc.). On the other hand, if the capex leaders even hint at tapping the brakes, that can fuel the fear factor and hit the assumption excess on valuation and demand forecasts.
Any new fears of capex and/or construction moderation can trigger worries around the sustainability of the multiplier effects into the broader economy. That would call into question the secondary and tertiary effects from services and materials to speculation on shareholder enhancement plans. Credit contraction or a flood of increased hedging lines to mitigate net exposure might also see more use of credit derivatives to go on offense (shorting axes, etc.). That would tend to turn the volume up from the bear crowd (i.e. trash talking).
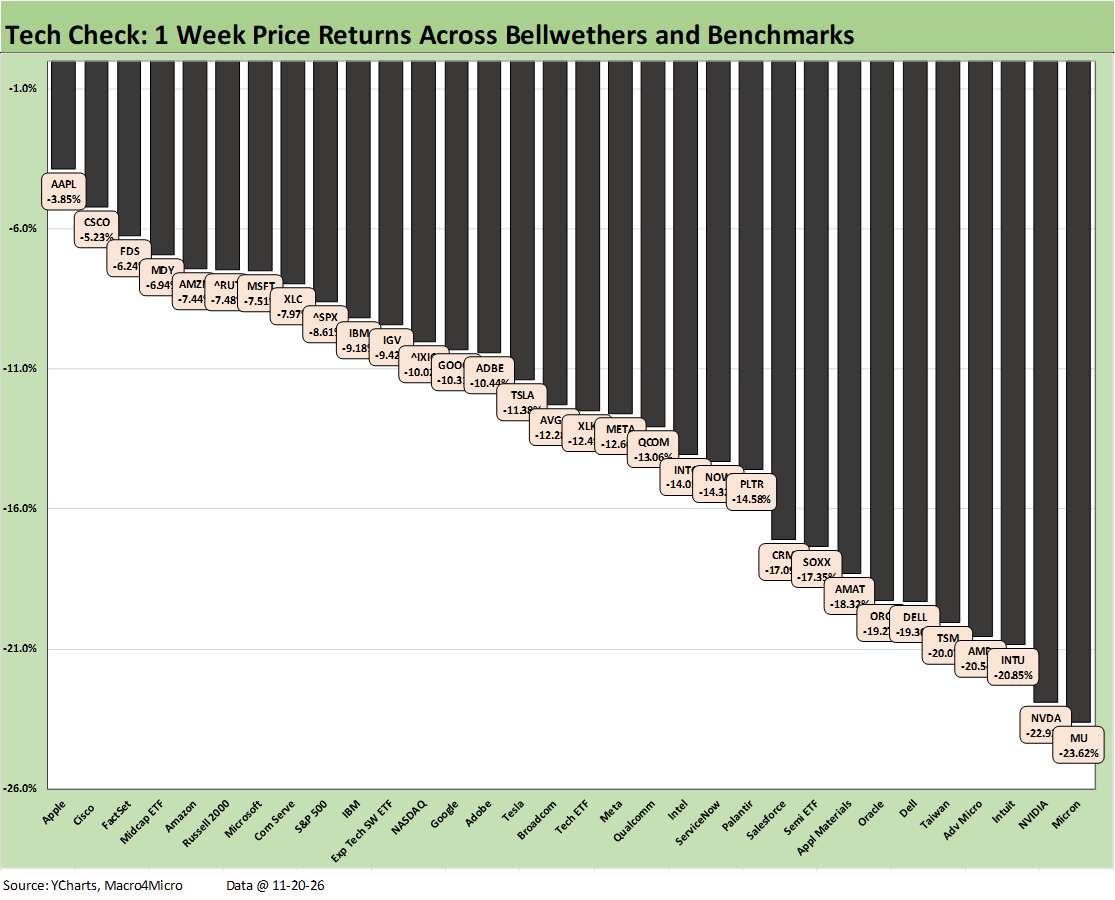
The Tech Check mix this week shows all asset lines in negative return range with relatively “AI lite” Apple (AAPL) #1 at -3.85% and Micron (MU) in dead last at -23.6%. MU was just ahead of NVIDIA (NVDA) with its -22.9% price return.
The bottom quartile runs from Applied Materials (AMAT) at -18.3% down to NVDA and MU. It is worth highlighting the beaten down SaaS names such as Intuit (INTU) at -20.85%. INTU sits on the bottom of this peer group YTD at -59.2%.
The visual tells the grim story, and the fact that the Communications Services ETF (XLC) made the bottom of the top quartile with -7.97% underscores the breadth of the poor returns. We see the small cap Russell 2000 in the top quartile at -7.5% with Midcaps (MDY) at -6.9% in the top 5 asset lines.
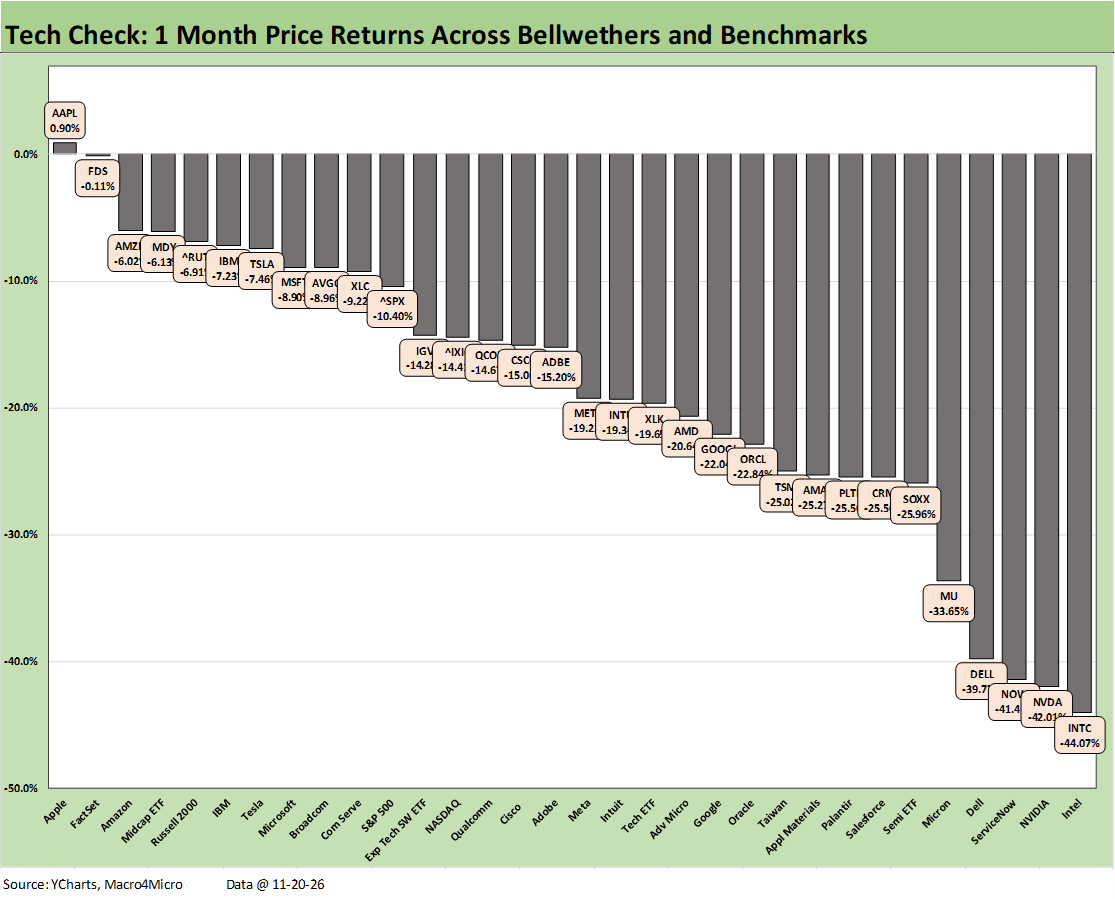
The 1-month timeline only posted one positive return with Apple (AAPL) at #1 with +0.9%. Microsoft (MSFT) is on the bottom of the top quartile with -8.9%. The bottom quartile performances for the month ran from Palantir (PLTR) at -25.5% down to Intel (INTC) at -44.1% with NVDA one off the bottom at -42.0%.
The Semiconductor ETF (SOXX) posted -26% in the bottom tier joined by 4 other AI ecosystem names including Micron (MU) at -33.7%, Dell (DELL) at -39.7% with NVDA and INTC as already noted.
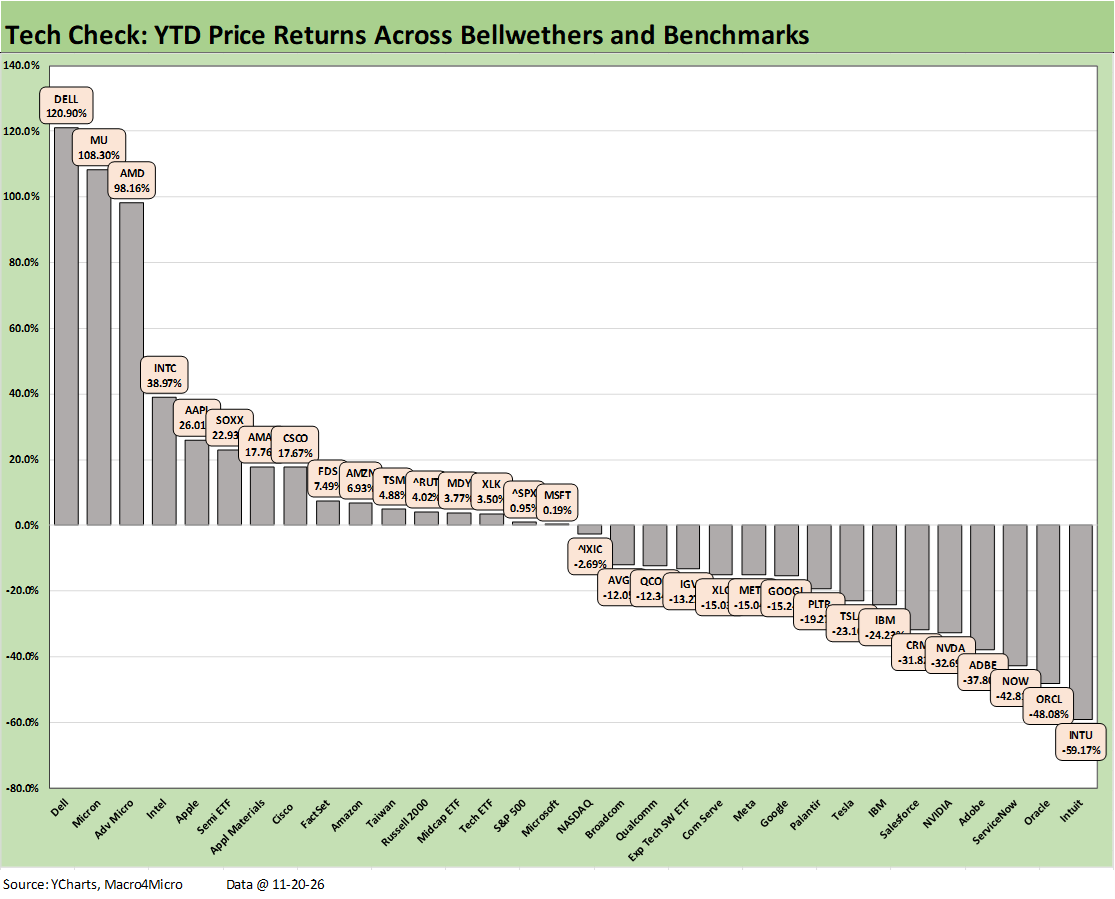
The above chart updates the YTD scoresheet at 16-16 in a balanced positive vs. negative score given the giant head start for the AI ecosystem names. The bottom 4 are still part of the software and SaaS services beatdown with Intuit (INTU) last at -59.2%. In ascending order from INTU, we see Oracle (ORCL) at -48.1%, ServiceNow (NOW) at -42.8%, and Adobe (ADBE) at -37.8%.
It took -23.7% with Tesla (TSLA) to make the bottom quartile while +17.7% for Cisco (CSCO) set the low end of top quartile.
For the leaderboard, DELL is still in triple digits at #1 with +120.9%, Micron (MU) at #2 with +108.3%, and Advanced Micro (AMD) at +98.2% before a sharp drop to #4 with Intel (INTC) at +39%.