


The AI rally test is not a new challenge, but is in the eye of the beholders.
These data points offer a few more angles on tech bellwether returns and the trailing time horizons for bond and equity benchmarks. We add some additional return stats to those we already posted yesterday (see Asset Returns: Benchmarks and ETFs 11-21-26, Asset Returns: Tech Check 11-21-26).
Last week’s tech beatdown and broader equity bloodbath came at a point in the cycle that still offers credit spreads well below long-term medians and in a market that is showing steady GDP growth and stock markets that only recently posted record highs.
This coming week brings more inputs with the PCE inflation data (Income and Outlays release), an updated round of estimates on 3Q26 GDP growth, and a home stretch in retail reporting season after last week’s major retail earnings wave was drowned out by the tech whipsaw and equity headlines. The outlays vs. disposable income trends in the PCE report will be revealing for consumers even if this month’s noise is not in the numbers and spending habits yet.
Another headline item for the market to digest will be gauging what Trump meant by “data centers can only be built in the US” or face a “tremendous tax.” That sort of constraint might add to nerves around AI ecosystem infrastructure capex that could dampen spirits on AI growth prospects. That statement came out of nowhere at a time when investors are debating how NVIDIA, as the “third party credit guarantor at large,” might dial back its blank check support for leases and shrink the scale of vendor financing activities.
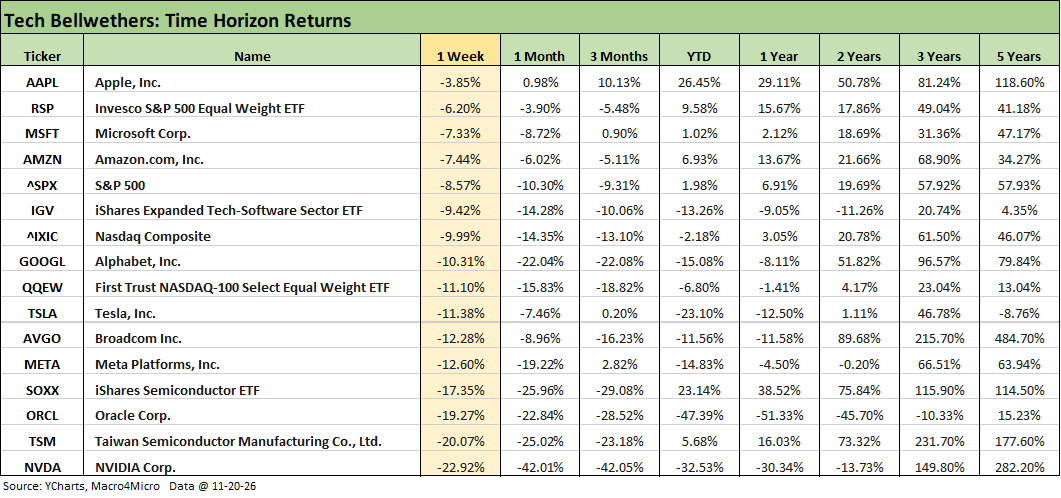
The Tech bellwether list above adds to the return details we already provided in the Tech Check post from yesterday. The above chart shows a shutout this week with all weekly returns posting negative returns with only one minimal positive return from Apple (AAPL) for the trailing month.
Looking back 3 months at the Mag 7, we see 3 of 7 in negative return range while YTD the Mag 7 show 4 of 7 negative. The NASDAQ is now in negative range YTD after last week’s -10% smackdown.
The return differential between the Semiconductor ETF (SOXX) and the Software ETF (IGV) tells a story of the challenge during 2026 in the “semi vs. software/SaaS” allocation decision. SOXX is now at +23.1% YTD after the recent turmoil vs. -13.3% for IGV. That translates into a return gap of over 36 points favoring semis. For the past 3 months, that differential narrowed to +19 points favoring software. We cover more single name activity in the separate commentary.
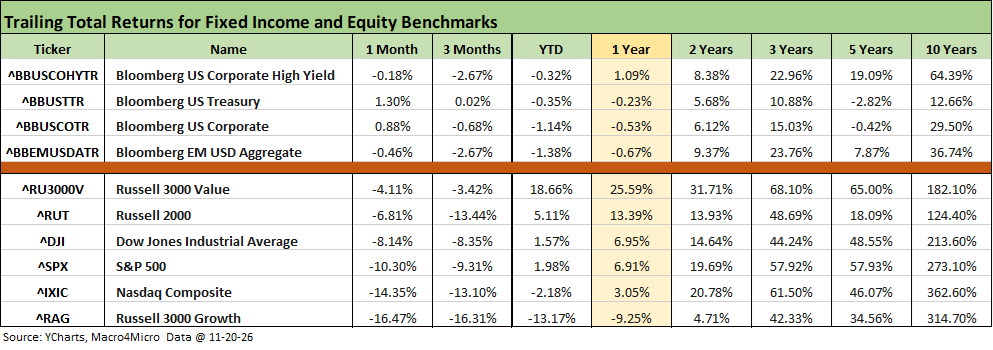
The above table drops in the bond benchmarks we watch along with the main equity indexes for the various timelines. Equities are now all negative for 1 month and 3 months.
The bond returns are mixed over the trailing 1-month period with higher quality duration getting a mild reprieve for the month. Credit markets are feeling some spread widening pressure.
For 3 months, we see the duration and credit setbacks with 3 of 4 bond ETFs in negative range and the UST index barely above zero. We look at the UST deltas in a separate commentary. The post-Iran upward shift in the UST curve still leaves YTD returns for bonds in the red.
Equities obviously felt the broad-based pain last week as we highlight in our coverage of benchmarks and ETFs. We add some single-name return results in our tech check recap. The Russell 3000 Value benchmark had been hanging in despite the pressure in tech, but that benchmark saw the rolling 1-month return drop to -4.11% this week from +3.39% last week. The Value benchmark is still solid YTD at +18.7% as we enter the home stretch.