Footnotes and Flashbacks: Week Ending April 16, 2023
A crucial earnings season ramps up this week with regionals, consumer finance, automotive, freight, and aero & defense.
“I’m the only one I trust with my deposits.”
This Week’s Macro: Asset class and ETF sector returns; yield curve migration trends; 3M-5Y UST slope hits a new inversion high; we look at comparative stock returns for Consumer Finance as that subsector is the undercard in the Regional Banks fight.
This Weeks’s Micro: Delta started the airline reporting season with very strong numbers but with a lot of balance sheet repair to do; We look at Iron Mountain in the context of a major storage REIT and Data Center as IRM expects more benefit of the doubt in the markets.
MACRO
The earnings season is really just beginning with the major banks getting the markets warmed up on Friday ahead of a slew of regional banks and consumer-focused banks teed up for this week (discussed in more detail below). Investors will be hungry to get details on how management teams are thinking about asset risk and the state of deposit flight and how that might translate into the much-discussed topic of tightening financial conditions and concerns around credit contraction.
The next two weeks will be hectic with eyes on guidance. That includes revenue as an indicator of expected economic activity and what demand trends will mean for pricing, volume, and staffing with inflation still focus #1. The more capital-intensive industry groups will be closely watched for signs of cyclical uncertainty in capex plans and whether secular factors such as reshoring will help.
The tailwinds from the infrastructure bill or the IRA incentives will be on the checklist. There are more than a few theories out there that capex will be more resilient even in the face of tighter credit conditions and the potential weakening of some key end markets. The short list includes any signs of slower consumer activity or tighter credit (whether the Fed or the banks).
Asset returns as deposit panic eases and earnings season begins…
Below we break out the main debt and equity benchmarks with the past week a solid one for credit performance on spread tightening but an adverse one for yield curve impact with an upward UST shift since last week. We saw some reversal of the positive duration impacts but with riskier credit assets getting the rewards on the spread side as HY OAS rallied.
The chart above shows the debt and equity broad benchmarks we track, and the news was at least positive after some serious whipsaws since the boom in January. We line up the fixed income benchmarks in descending order of the highest to lowest returns over the trailing 3 months. We then do the same for the equity benchmarks.
For the 1-month horizon, one major factor in returns was that the “Regional Bank Hell Week” (week ending 3-17-23) dropped out of the return measurement period. Some relief seems to be slowly rolling in as regional bank concerns recede (though has not disappeared). The bank management teams will have to deliver some useful information for that to continue. The rally put US HY back on top for the 1-month time horizon on material spread contraction.
In equities, tech and growth subsectors still rule while small caps are getting pummeled. The Hi-Lo total return differential over 3 months for the NASDAQ vs. Russell 2000 is a gap of almost 15 points over 3 months.
Longer tail of equities…
The longer tail of the “1500 and 3000” series shows a similar trend as large caps benchmarks. Growth materially outperformed Value. Energy rebounded dramatically off the OPEC production action with WTI north of the $80 threshold. For the trailing 3 months, we see 5 of the 6 benchmarks above in negative return territory, underscoring the poor breadth of the recent rally. Financials and Real Estate remain in a hole. For the YTD period, 4 of 6 are positive with Growth far ahead.
ETF returns…
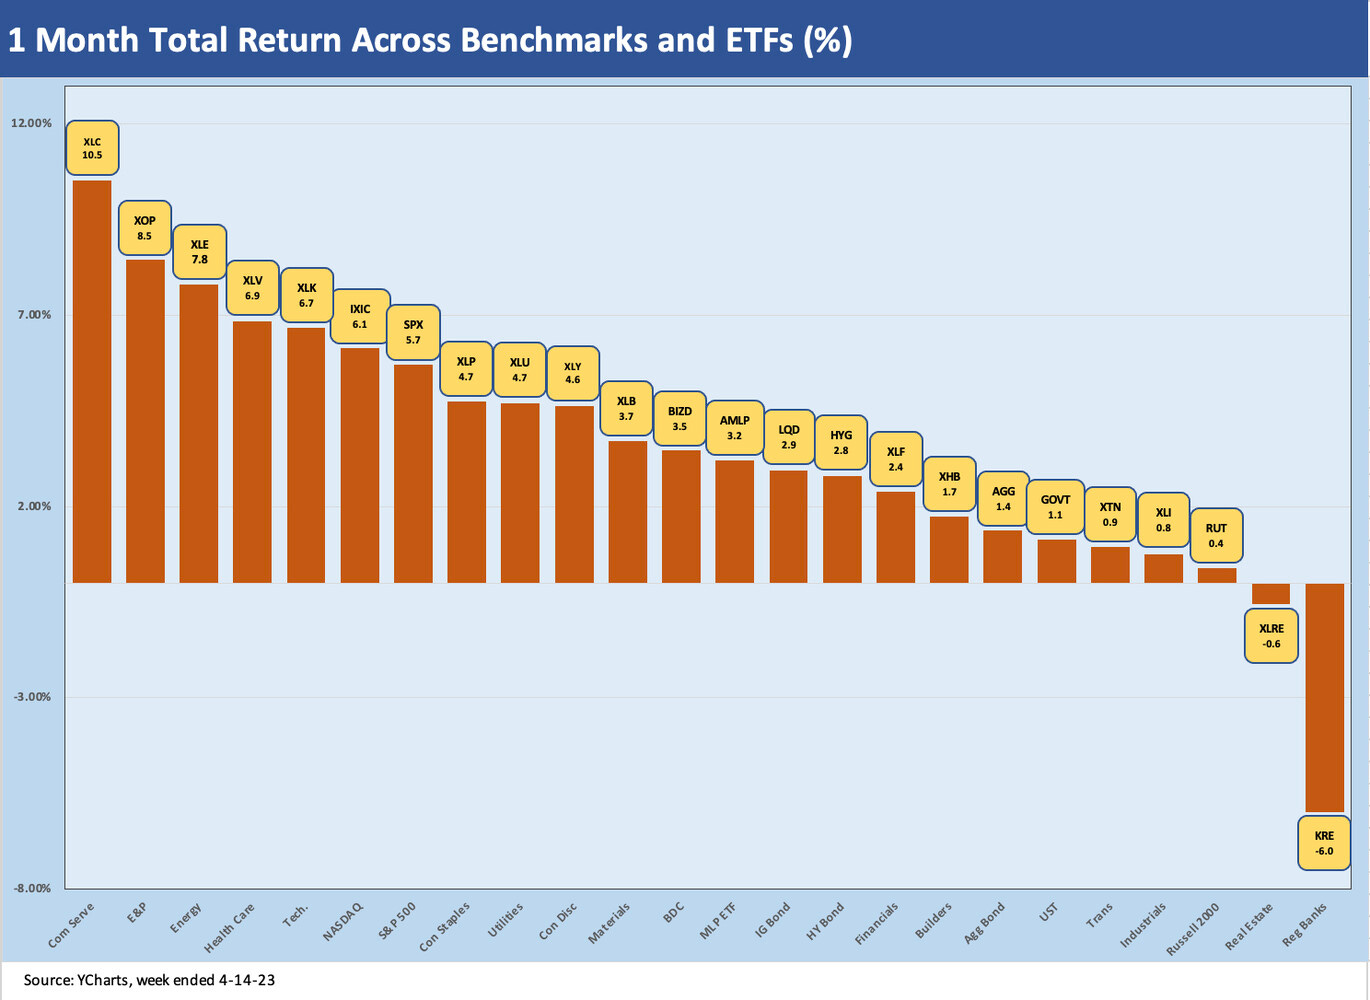
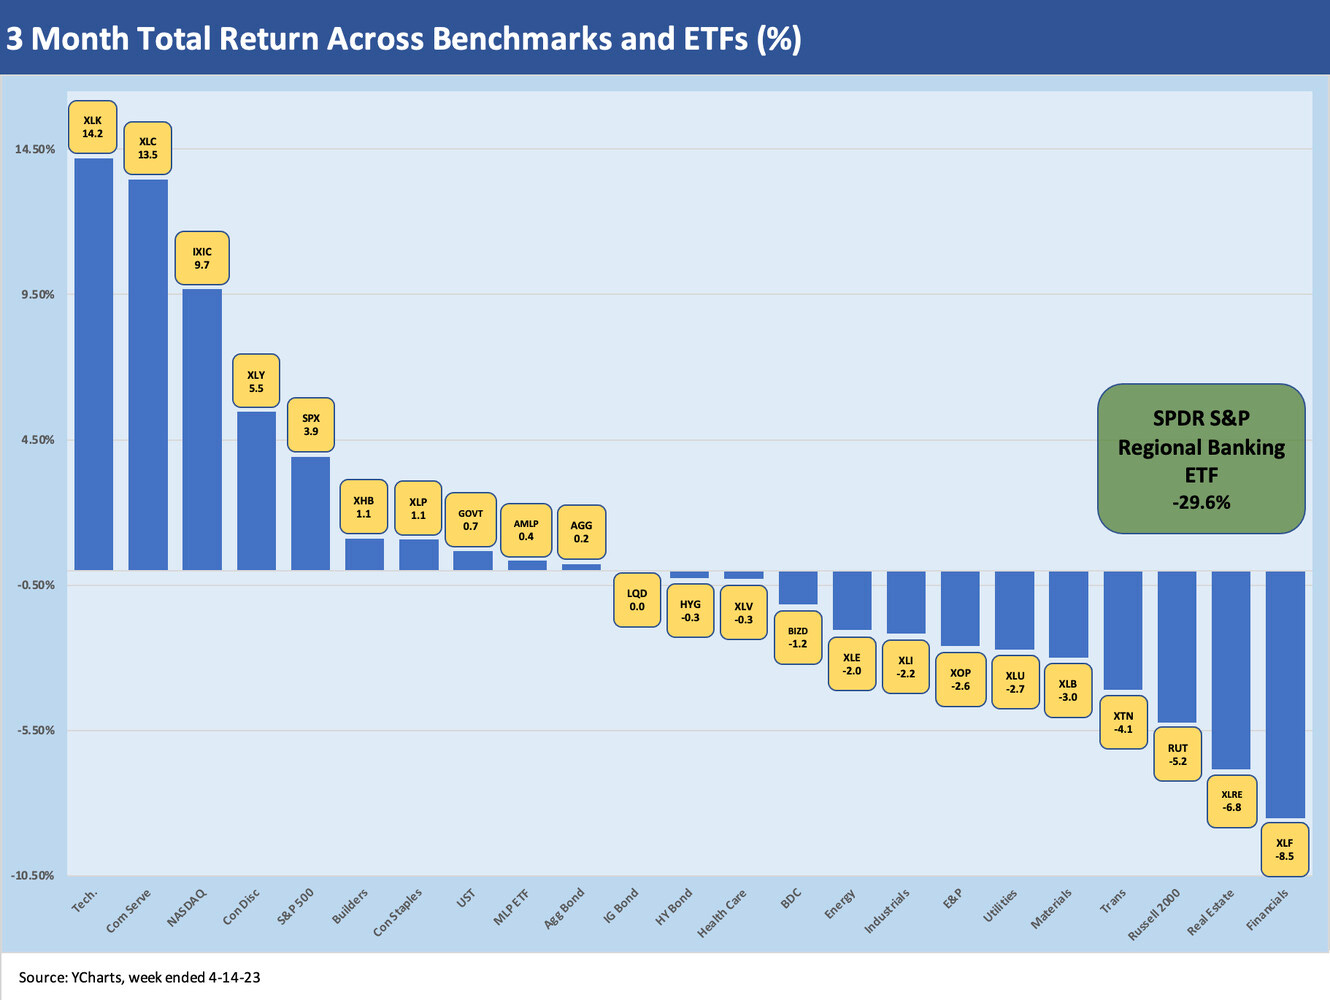
In the following charts, we look at some broad benchmarks and a mix of ETFs that serve as industry proxies and the same for fixed income as an asset class. We added 3 more ETFs to the mix this week with the addition of Homebuilding (XHB), Transportation (XTN) and Regional Banks (KRE) for a total of 24 subsectors vs. 21 in prior weeklies. We included a bar chart position for KRE in the 1-month chart. We left the KRE ETF return for the 3-month in a separate box in the chart since it did so poorly and was messing up chart visuals.
1-month ETF returns
The 1-month period shows the benefit of the March 13-17 week dropping off. That week in mid-March was brutalized by the spiraling regional bank anxiety and sharp risk sell-off. That week dropping out made a big difference. The bar chart above tells its own story with only 2 of 24 in the negative zone in the form of Real Estate (XLRE) and Regional Banks (KRE). Energy came roaring back after OPEC’s action with E&P (XOP) and diversified Energy (XLE) at #2 and #3, respectively. Fixed income ETFs dropped into the lower half with LQD and HYG neck and neck.
3-month ETF returns
The 3-month returns show just over half the 24 ETFs in the red (including the regional bank ETF KRE as noted in the box at -29.6%). The 4 fixed income ETFs saw duration and quality come out ahead of credit (barely) across the 3 months with HYG bringing up the rear but in a relatively clustered group.
Yield curve migration…
Our weekly UST curve migration is updated above. As a reminder, we look at the moves in the UST curve from March 1, 2022 to the current period. Mid-March-2022 saw the end of ZIRP, and this chart updates how far the curve has moved. We also include a box with the differentials across the curve. We have one box for the March 8, 2023 UST peak of the migration ahead of the SVB panic. We also have one box for the most recent week (April 14). Interestingly, this past week saw a new high on the 3M UST maturity.
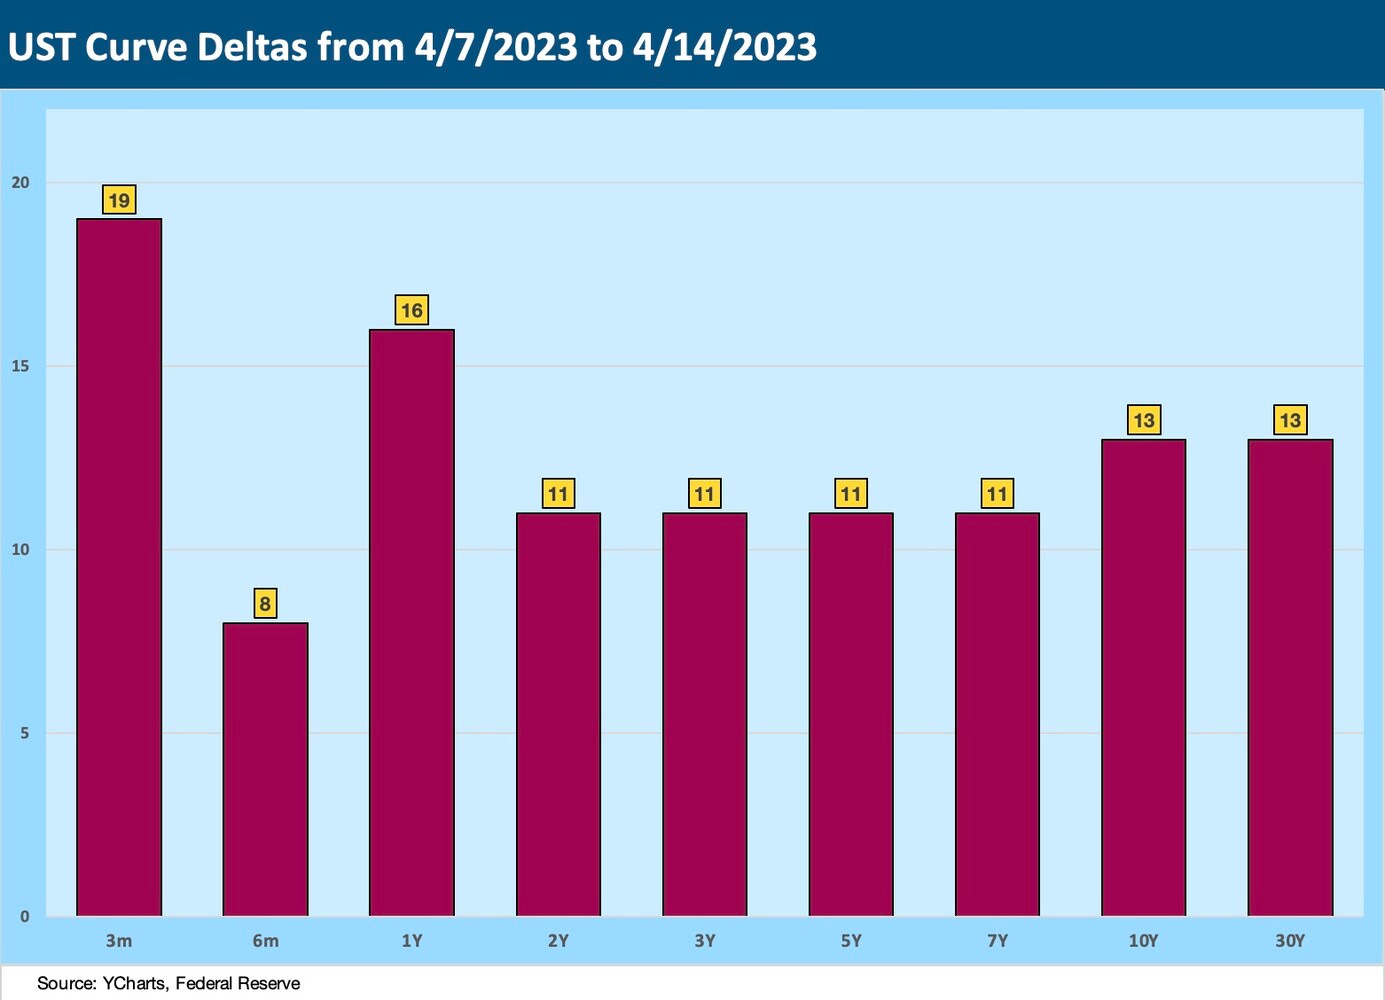
Curve shifts this past week…
This chart breaks out the UST curve deltas of last week. With the past week’s mix of economic releases and start of earnings on Friday, much was in the news with mix ways to interpret the data. We saw some bellwether megabanks report but the week also saw CPI/PPI, the FOMC minutes, Retail Sales, and Industrial Production among others.
The wrestling match continues on “pause vs. hike” and how the mix of factors should reverberate out along the yield curve. The CPI data did not kill worries around services inflation, but the headline CPI and softer PPI data keep the debate going around whether the Fed should stand down. The hope is that earnings will offer some signals since the talking heads spin more tales than Mother Goose.
Yellen was busy this week pitching the theory that financial conditions outside the Fed will be crucial (i.e., regional and community banks, etc.) and there is a chance that such market conditions could handle the tightening for the Fed. That theory is making the rounds, and it certainly has merit. The problem is that services companies may not agree with it in their pricing or hiring. Demand will need to weaken a lot more than what we have seen in order to peel a few million more job postings off the board.
In listening to Delta Air Lines this past week (see MICRO section), one does not get the sense that travelers are skipping the spring and summer. As one of numerous bellwether proxies for the consumer sector, airlines are not on “Team Tepid” so far with their guidance but that was just the first airline to report (and the most successful one of late). More airlines report in the coming days and weeks.
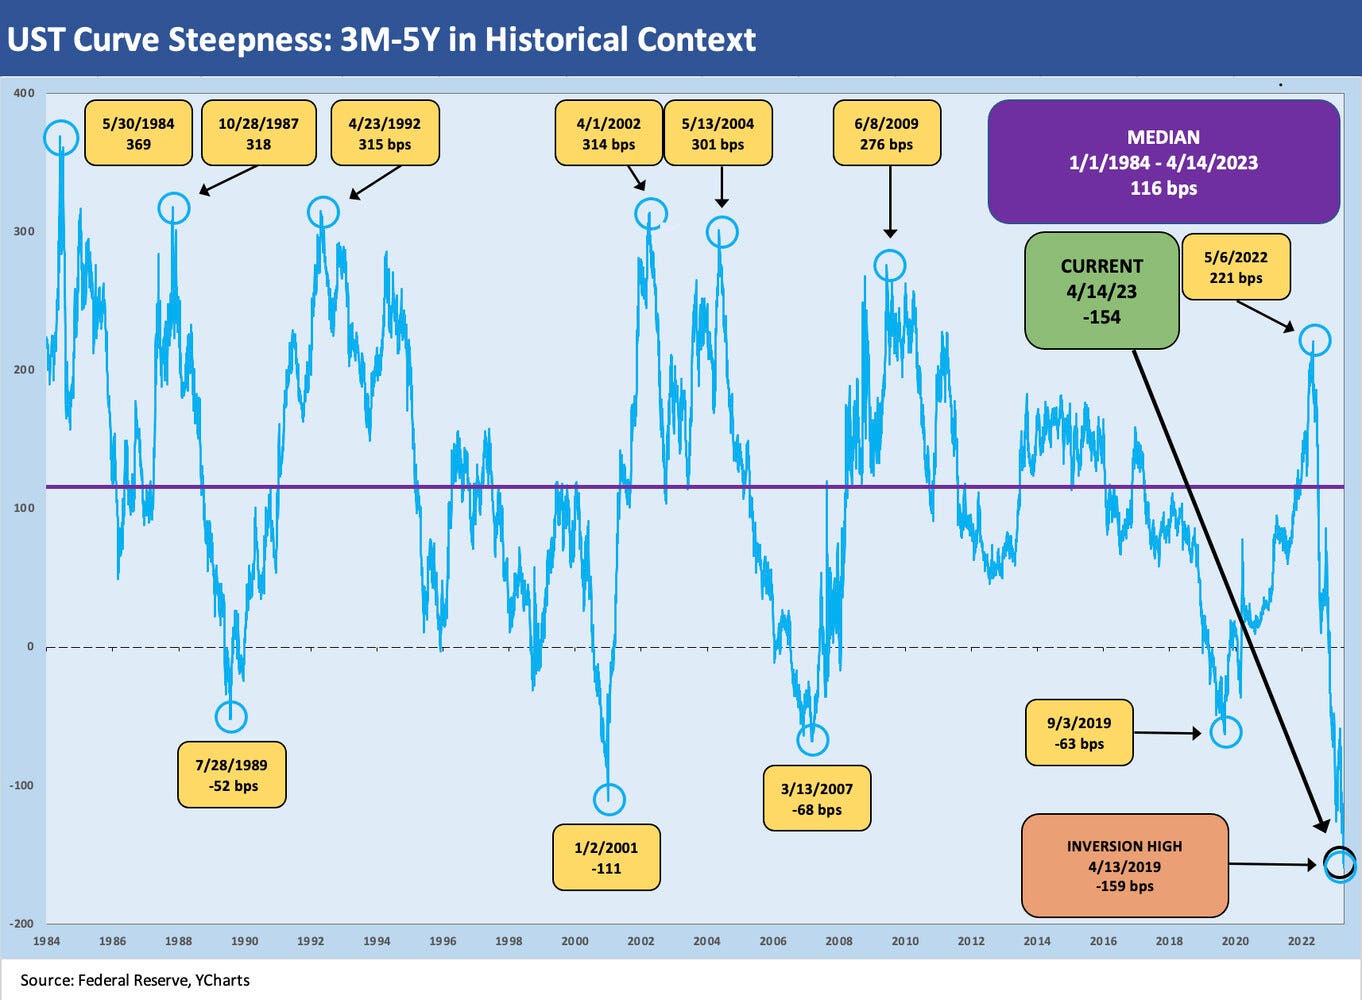
The 3M-5Y slope history…
The inversion stories get old after a while, but the new max inversion data point this past week keeps the streak of superlatives going on the front end. We are back to 5% handles on 3M UST as we go to print. That was after a return to the mid 4% range after the SVB panic. The jury is still out. The UST curve says recession but the jobs and demand side says “not so fast.”
Consumer finance and banks: let the games begin…
With regional banks set to run the Q&A gauntlet this coming week and the banks hopefully upping their disclosure and transparency game this reporting season, the consumer finance banks also will be weighing in with a lot of granular details on how consumer credit quality is shaping up. That will get into the question of how the consumer-centric lenders are seeing their appetites to lend shaping up.
Beyond lending standard shifts or the usual array of delinquencies and charge-off data, there will be color on select segments from cards to autos to student loans. That will offer visibility on trends along the services (e.g., leisure and travel) and goods (e.g., auto, home repair, appliances furniture, etc.) chains.
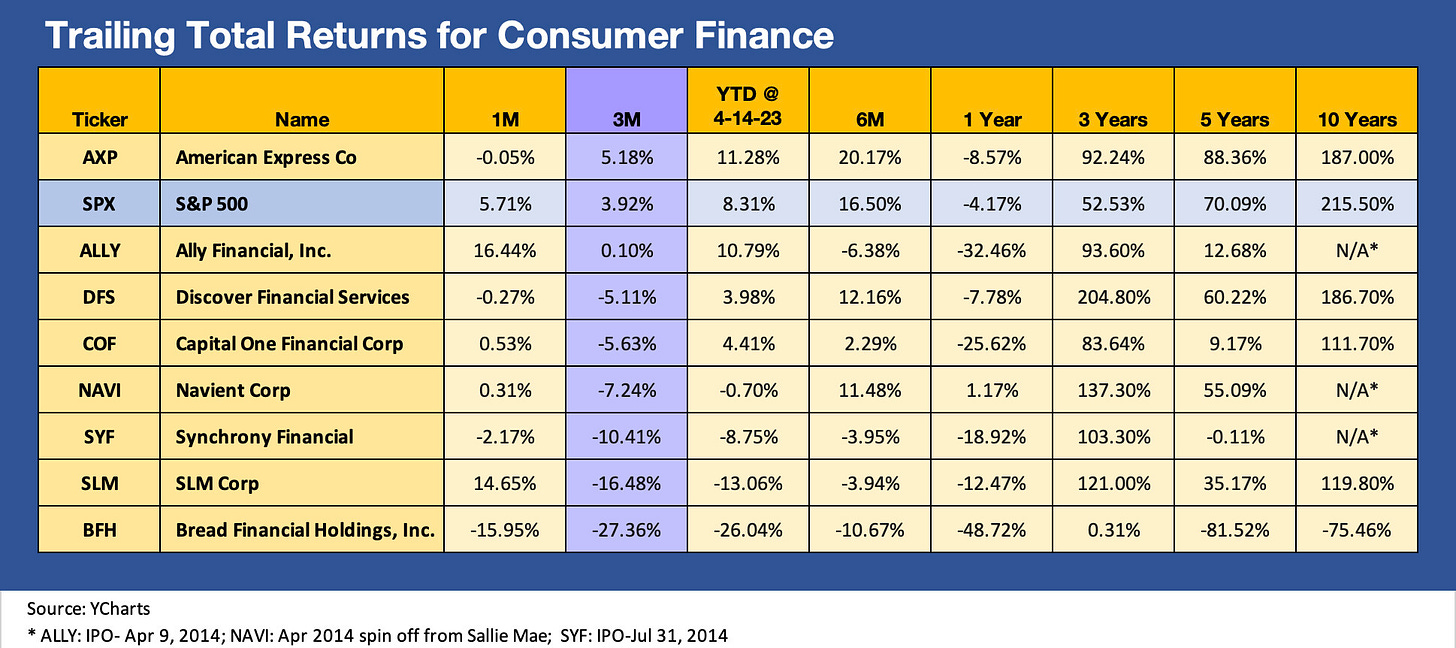
Below we break out the performance of some notable names that get a lot of street scrutiny in the consumer finance space.
The equity markets appear decidedly mixed in how this group’s issuers are trending. The asset categories cut across all aspects of consumer and household finance. Once again, we line them up in descending order of 3-month total returns.
There is a wide range of results in the market but only behemoth American Express is ahead of the S&P 500 over 3 months. Looking back 6 months is similar as cyclical concerns already have been creeping in around asset quality even before the deposit fears set in.
We are not covering these names (Ally is an exception for the auto connection) and we will leave the fine print to the bank gurus, but the theme of household spending (whether via borrowing or from household cash flows) and credit contraction at the consumer level is a critical piece of the puzzle on GDP and industry demand trends. Record high payrolls in the jobs market and a rising population of retirees outside the labor force just don’t suddenly stop spending without more negative catalysts.
MICRO
Delta Air Lines: Tailwinds on the return flight…
Delta reported results for its seasonally slow quarter, but as always the 1Q23 release and conference call is about the outlook for the spring and summer travel periods and how the supply-demand balances are shaping up after so much logistical and infrastructure turmoil in 2022 and into 2023.
The guidance was bullish on demand and revenue growth in 2Q23 with mid-to-upper teens growth (15% to 17%) and revenue guidance for FY 2023 in a range of 15% to 20%. That is impressive guidance and helps drive home the expectation for the full year of free cash flow of over $2 bn.
The priorities of getting back to investment grade by next year were restated, and the target of 3x to 3.5x leverage reiterated. Delta is at the top of the heap now in performance across most industry metrics and certainly among the “Big 3” of DAL, UAL and AAL.
The return to the less troubled days of 2019 is always a topic with airlines, but that is still a long way off by most metrics. Those days are going to be hard to recapture until major reductions can be made in the mountain of debt still on Delta’s balance sheet.
Below we frame how the timeline for the Big 3 airline equities played out since the the 2019 fiscal year through Friday close.
The above chart underscores that DAL has been the top performer across the Big 3 comps (DAL edged out Southwest as well), but in all the excitement of the improving financial strengths across a brutal period after COVID, all of them are still in the negative zone. As strong a performance as Delta has put together in its superior results, the reality of the debt load is still very much a structural problem that makes for a tough trade-off on credit quality vs. shareholder rewards.
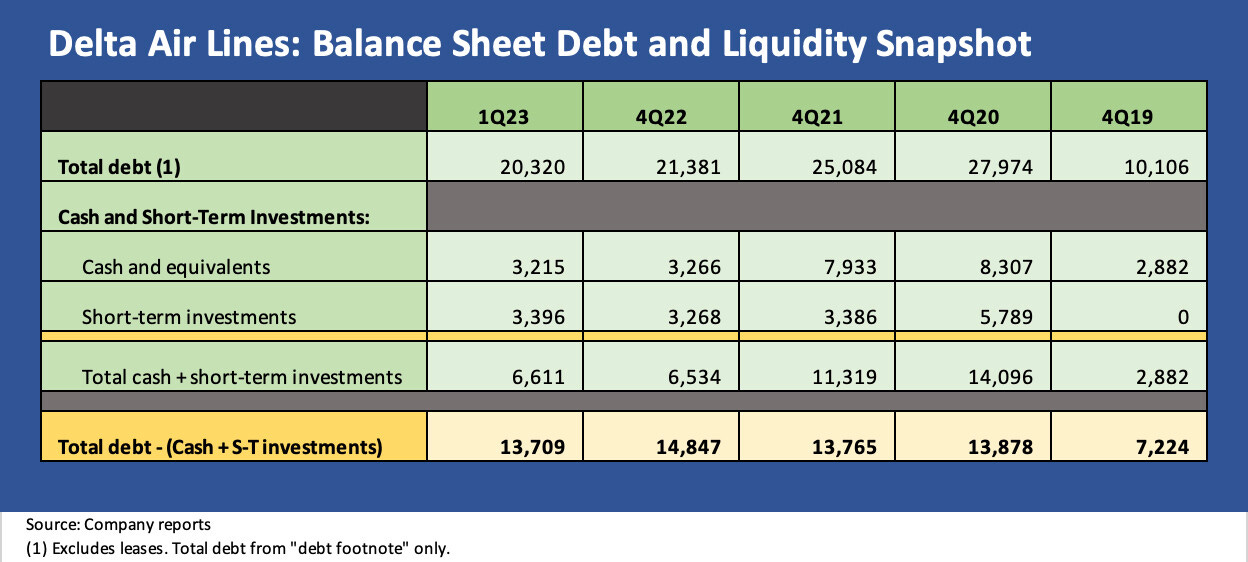
We revisit a very simplified profile of the debt lines below. We recognize that there are a slew of other angles that need to be looked at on the moving parts of balance sheet and liquidity risk for airlines with lease exposure and fleet planning at the top of the list. Pension adjusted leverage is another crowd favorite.
I covered airlines in the late 1980s and early 1990s and then in the early years of CreditSights in the post-9/11 travel crisis as more airlines headed for Chapter 11 and eventually more mergers and consolidation. The volatility of the industry has always been a hallmark. The same is true for the volatility of oil prices and how that drives fares and earnings.
The big moving parts can be hard to predict, but the capacity constraints that can cause travel problems also can protect pricing power for 2023. For now, Delta and peers can keep defending that balance. That is the good news. However, at some point a lot more of that debt needs to be paid down. The RASMs and CASMs can move around dramatically, but a loan has a number that needs to get paid back.
The chart is just a stark reminder of how different the debt burden is now vs. the end of 2019 with the total “footnote debt” (vs. lease adjusted risk metrics) still double the level of 12-31-19. Airline analysis always falls into a chowder of lease adjustments and RASM-CASM-TRASM-PRASM spasms, but it still gets back to balance sheet profiles and how free cash flow is deployed.
Iron Mountain: The Quiet Man
We published an in-depth Credit Profile on Iron Mountain over the weekend that should be of use to owners of IRM stocks and/or bonds (see Iron Mountain: Credit Profile 4/15/23). The company is a large cap BB tier member of the S&P 500 that ranks among the Top 100 HY bond issuers along with a range of multicurrency bank loan and lease exposures out there in the broader world.
The company has gone through an extraordinary decade as it started planning a REIT conversion in 2012, converted in FY 2014, and then set about driving a multiyear expansion plan in data centers with a major global acquisition in Storage along the way.
The chart above plots the IRM stock performance since the start of 2019 vs. two companies that have relevance in considering IRM’s valuation. One is a data center (Digital Realty ticker DLR) and one is a self-storage REIT (Extra Space Storage, ticker EXR). Both have larger market caps than IRM and both are also in the S&P 500. The exercise is more for illustration.
I picked DLR for a stock comp since the data center business is the clear driver of IRM’s growth plan and a cornerstone of its post-conversion REIT strategy. EXR is a major self-storage REIT, and thus not a direct competitor, but it is a storage REIT and trades at a premium.
In picking EXR, I looked at the three largest market caps in self-storage and picked the best trailing 3Y and 5Y time horizon total return performer. EXR was the name (I do not follow EXR or DLR). Both EXR and DLR have shown higher EV/EBITDA multiples than IRM and their peer group subsectors (Self-Storage REITs, Data Centers) also have higher EV multiples.
This is not investment advice on IRM vs. either of these two names, but the historical performance is food for thought on a name – Iron Mountain – that does not seem to get a mountain of respect vs. some other benchmark names from the rating agencies or street coverage in equities. The transition of the IRM business mix and the redeployment of free cash flow from its high margin (as in 70+% gross margins) legacy storage business makes for a very interesting story. We cover that in the report.
The street’s data center equity coverage has been dialed back in recent years as a number of the major names were taken private or were rolled into strategic acquisitions. During 2021, American Tower acquired CoreSite and QTS Realty was acquired by Blackstone. During 2022, CyrusOne was acquired by KKR and Global Infrastructure Partners (GIP).
The data center business has its own distinctive set of fundamentals, but the color over time has been that the intermediate term growth trajectory is favorable and pricing power has been in evidence. IRM’s strategy on data centers is in good company with KKR, Blackstone, GIP, and AMT. There are some interesting angles on IRM that are worth thinking through.


