
Footnotes & Flashbacks: Asset Returns 11-26-23
We look at asset returns and equity breadth as a great month helps some industries and benchmarks salvage the year.


With investors getting ready to hunker down over year end, time horizon returns have clawed their way back into respectable YTD for HY while IG needs a good home stretch to get a coupon return for 2023.
Duration has lost the year but has so far filled in most of the hole it left along the way with UST still at slightly negative YTD and for the rolling 3 months.
We see the large cap equity benchmarks set to easily beat the long-term nominal returns of just under 10% while the Russell 2000 small caps at +7.8% for the trailing month and equal weighted S&P 500 ETF (RSP) just put together a rolling +7.2% to get back in the hunt for a median type year.
In our industry ETF and benchmark review, the mix of major winners over the past 1-month time horizon is salvaging the year for a healthy number of those that had been struggling.
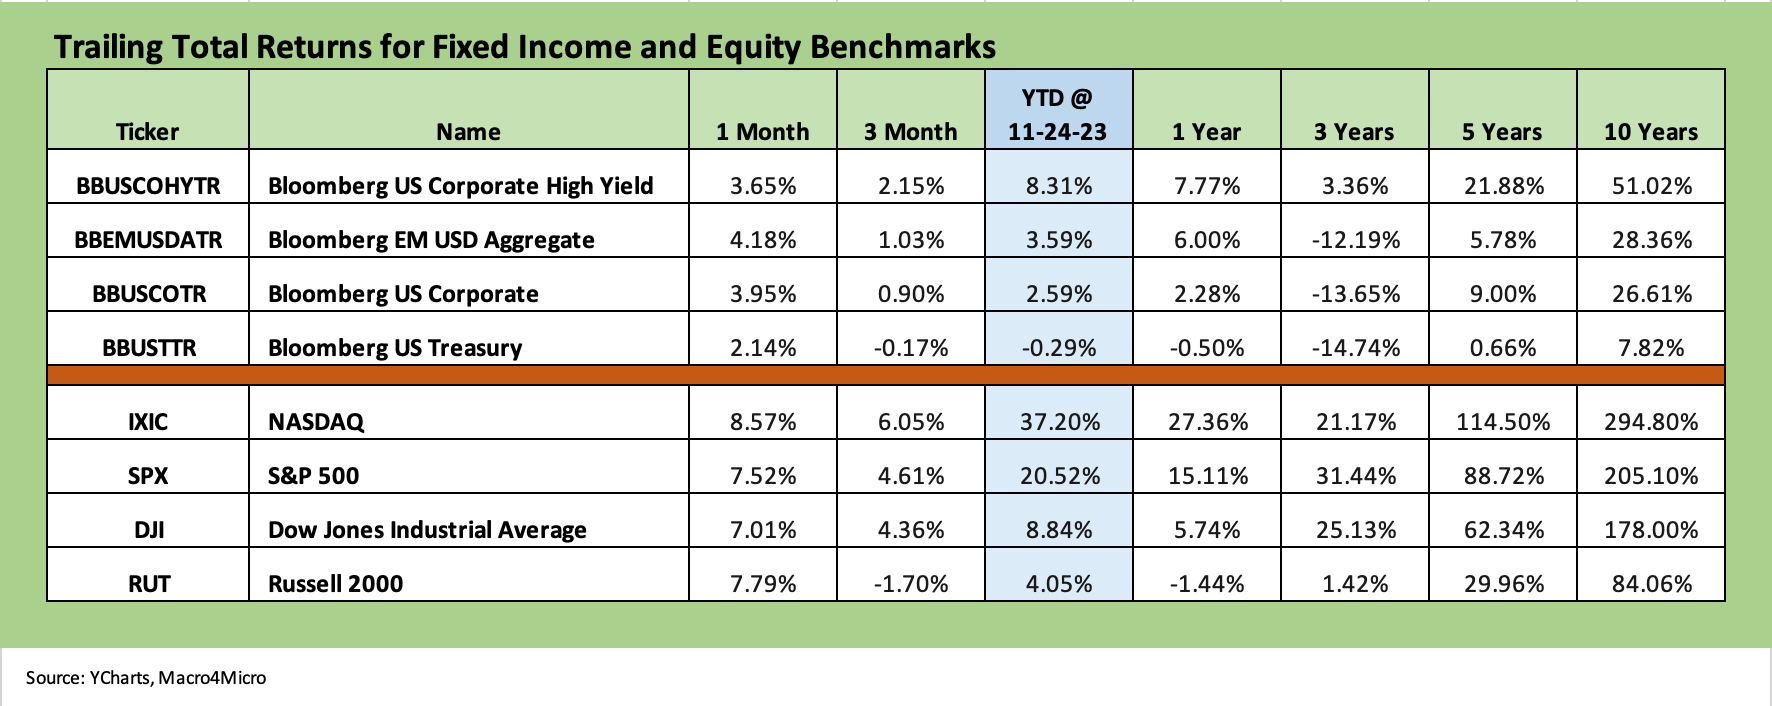
The above chart details debt and equity benchmarks we like to watch from UST to HY in debt and along the major broad market equity benchmarks. The rolling 1-month time horizon and 3-months in credit is helping get HY back into a strong YTD position on both UST shift and spread compression with IG corporate trying to get back to a coupon total return year on the back of duration support.
We look at the angles on credit spreads and all-in yields for IG and HY in more detail the separate Footnotes commentary on yields (see Footnotes & Flashbacks: State of Yields 11-26-23).
The equity story is riding an exceptional month of 7% to 8% handles from large caps to small caps while the breadth of the rally has been meaningfully improved beyond tech and the Magnificent 7. We see some resilient sectors in equities such as Builders, Midstream Energy, and BDCs that have held in quite well across 2023.
The next two weeks bring the home stretch indicators of PCE and employment with a 3Q23 GDP second round thrown in. Whether a healthy CPI reading for November shows up to wrap the inflation momentum will make for a few interesting weeks ahead. Geopolitics remains tenuous, but progress on hostages makes for user friendly headlines while government shutdown drama will have to wait for the new year.
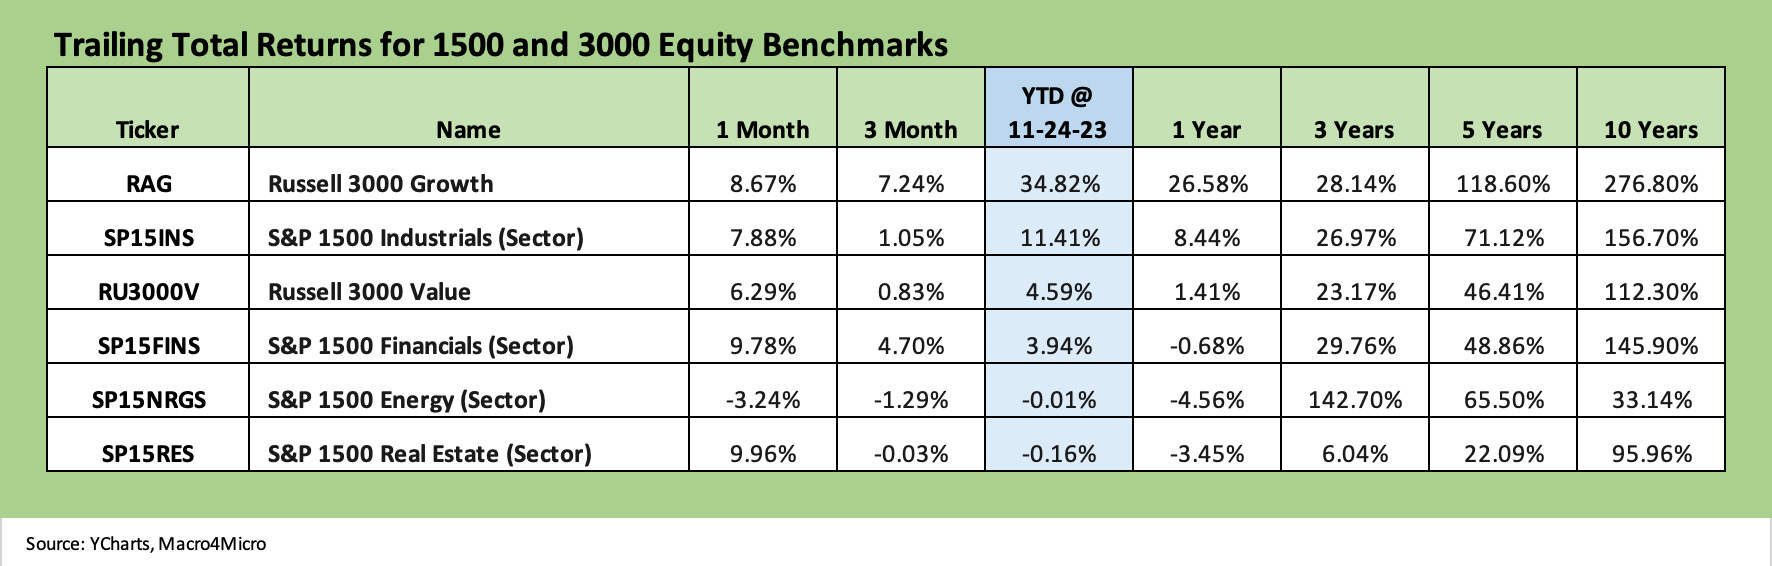
The above chart updates the 1500 and 3000 series, and only energy has tanked in the home stretch to this point. Despite Russia-Ukraine, Energy was negative for the 1-year period but posts 3 years that were very strong bouncing off the horrors of COVID.
The recent UST curve moves have done wonders for Financials and Real Estate over the past month. Financials are positive again YTD but negative for 1 year. Real Estate is still running in the negative zone for 3 months, YTD, and 1 year.
The return snapshot with a quick visual…
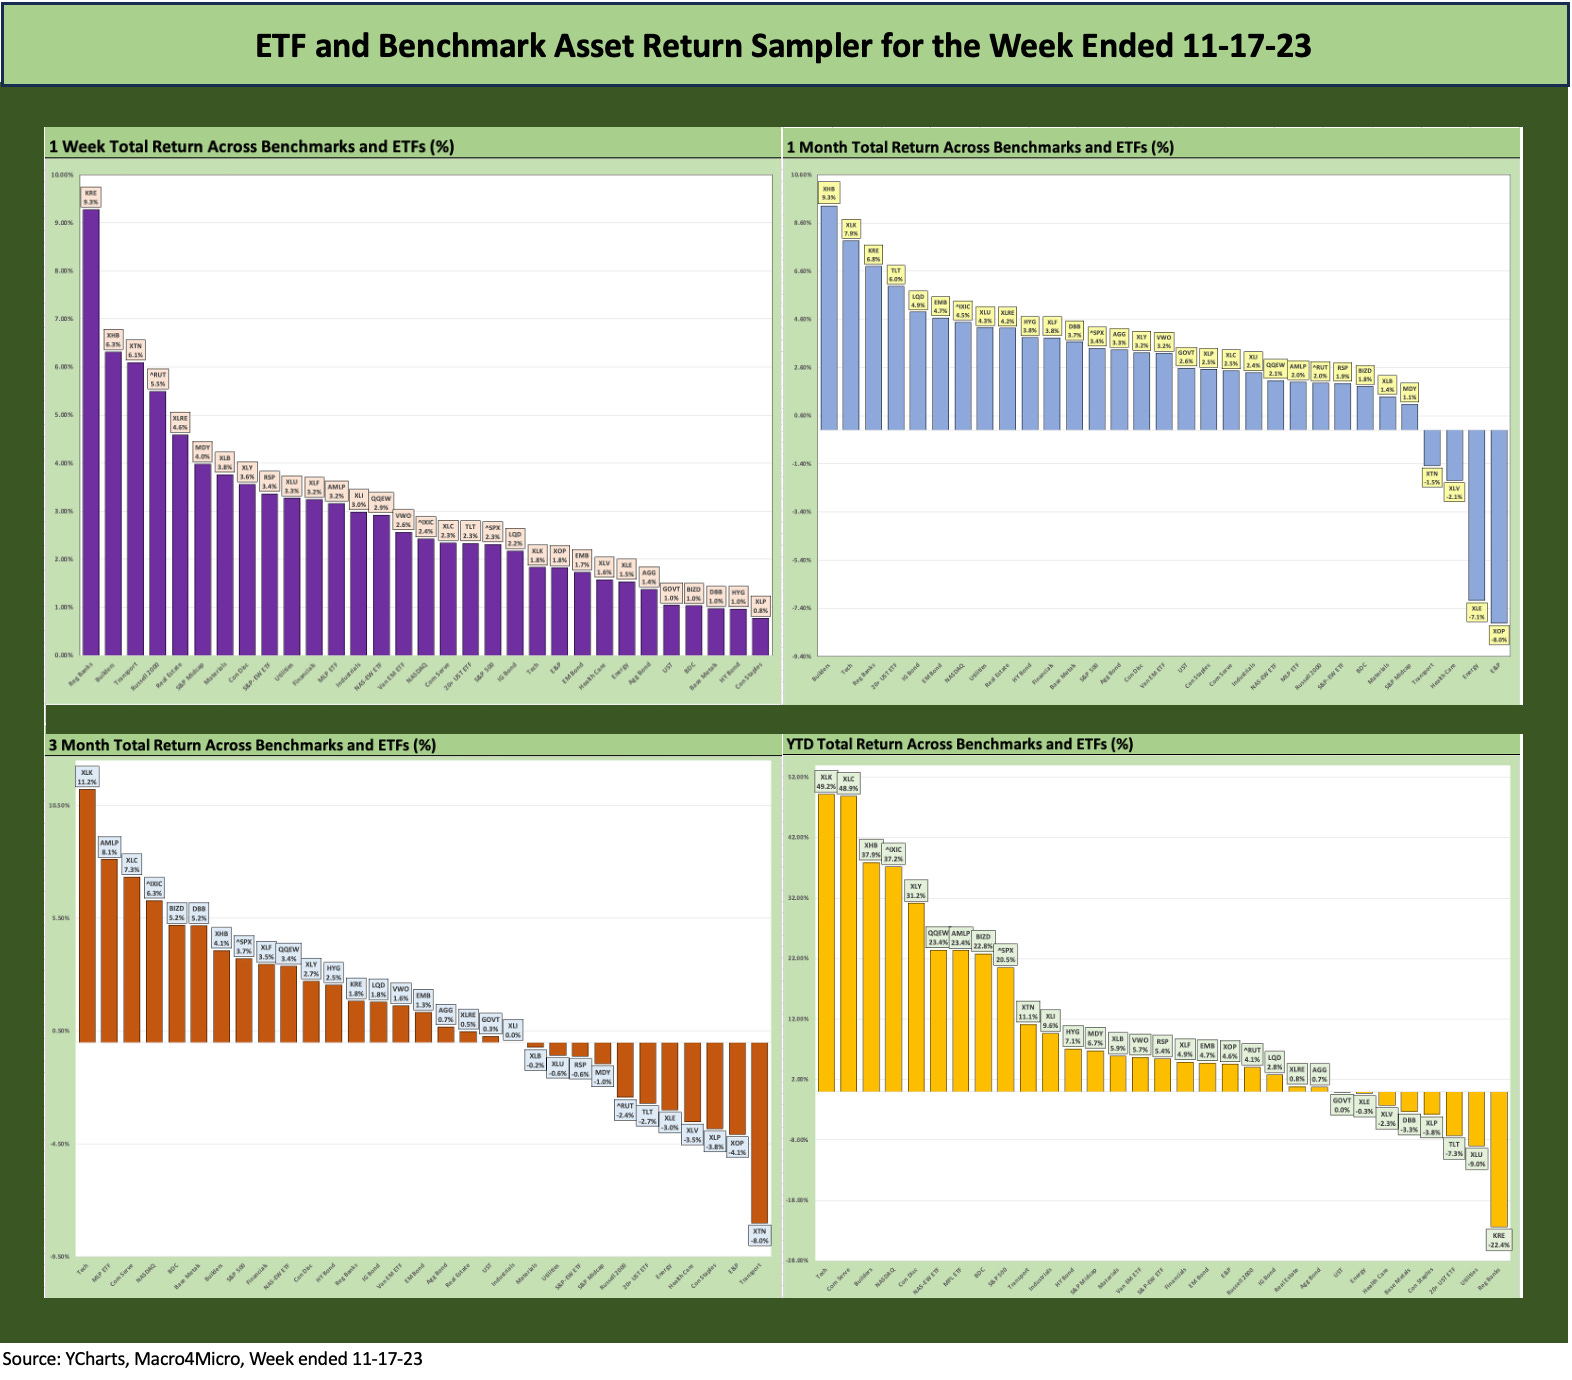
We started dropping in the following box of four time horizons that allow for an easy view of the shape of returns for each period (1-week, 1 month, 3 months, and YTD). We occasionally see all negative or all positive, but we found it to be an easy way to look at the current configuration and how it may have reshaped in just a week.
First, we show the box of 4 for this week and then we show one for last week. The good news for diversified portfolios of stocks and bonds is that the YTD period shows 23 positive and 8 negatives (with GOVT ETF on the negative side of zero).
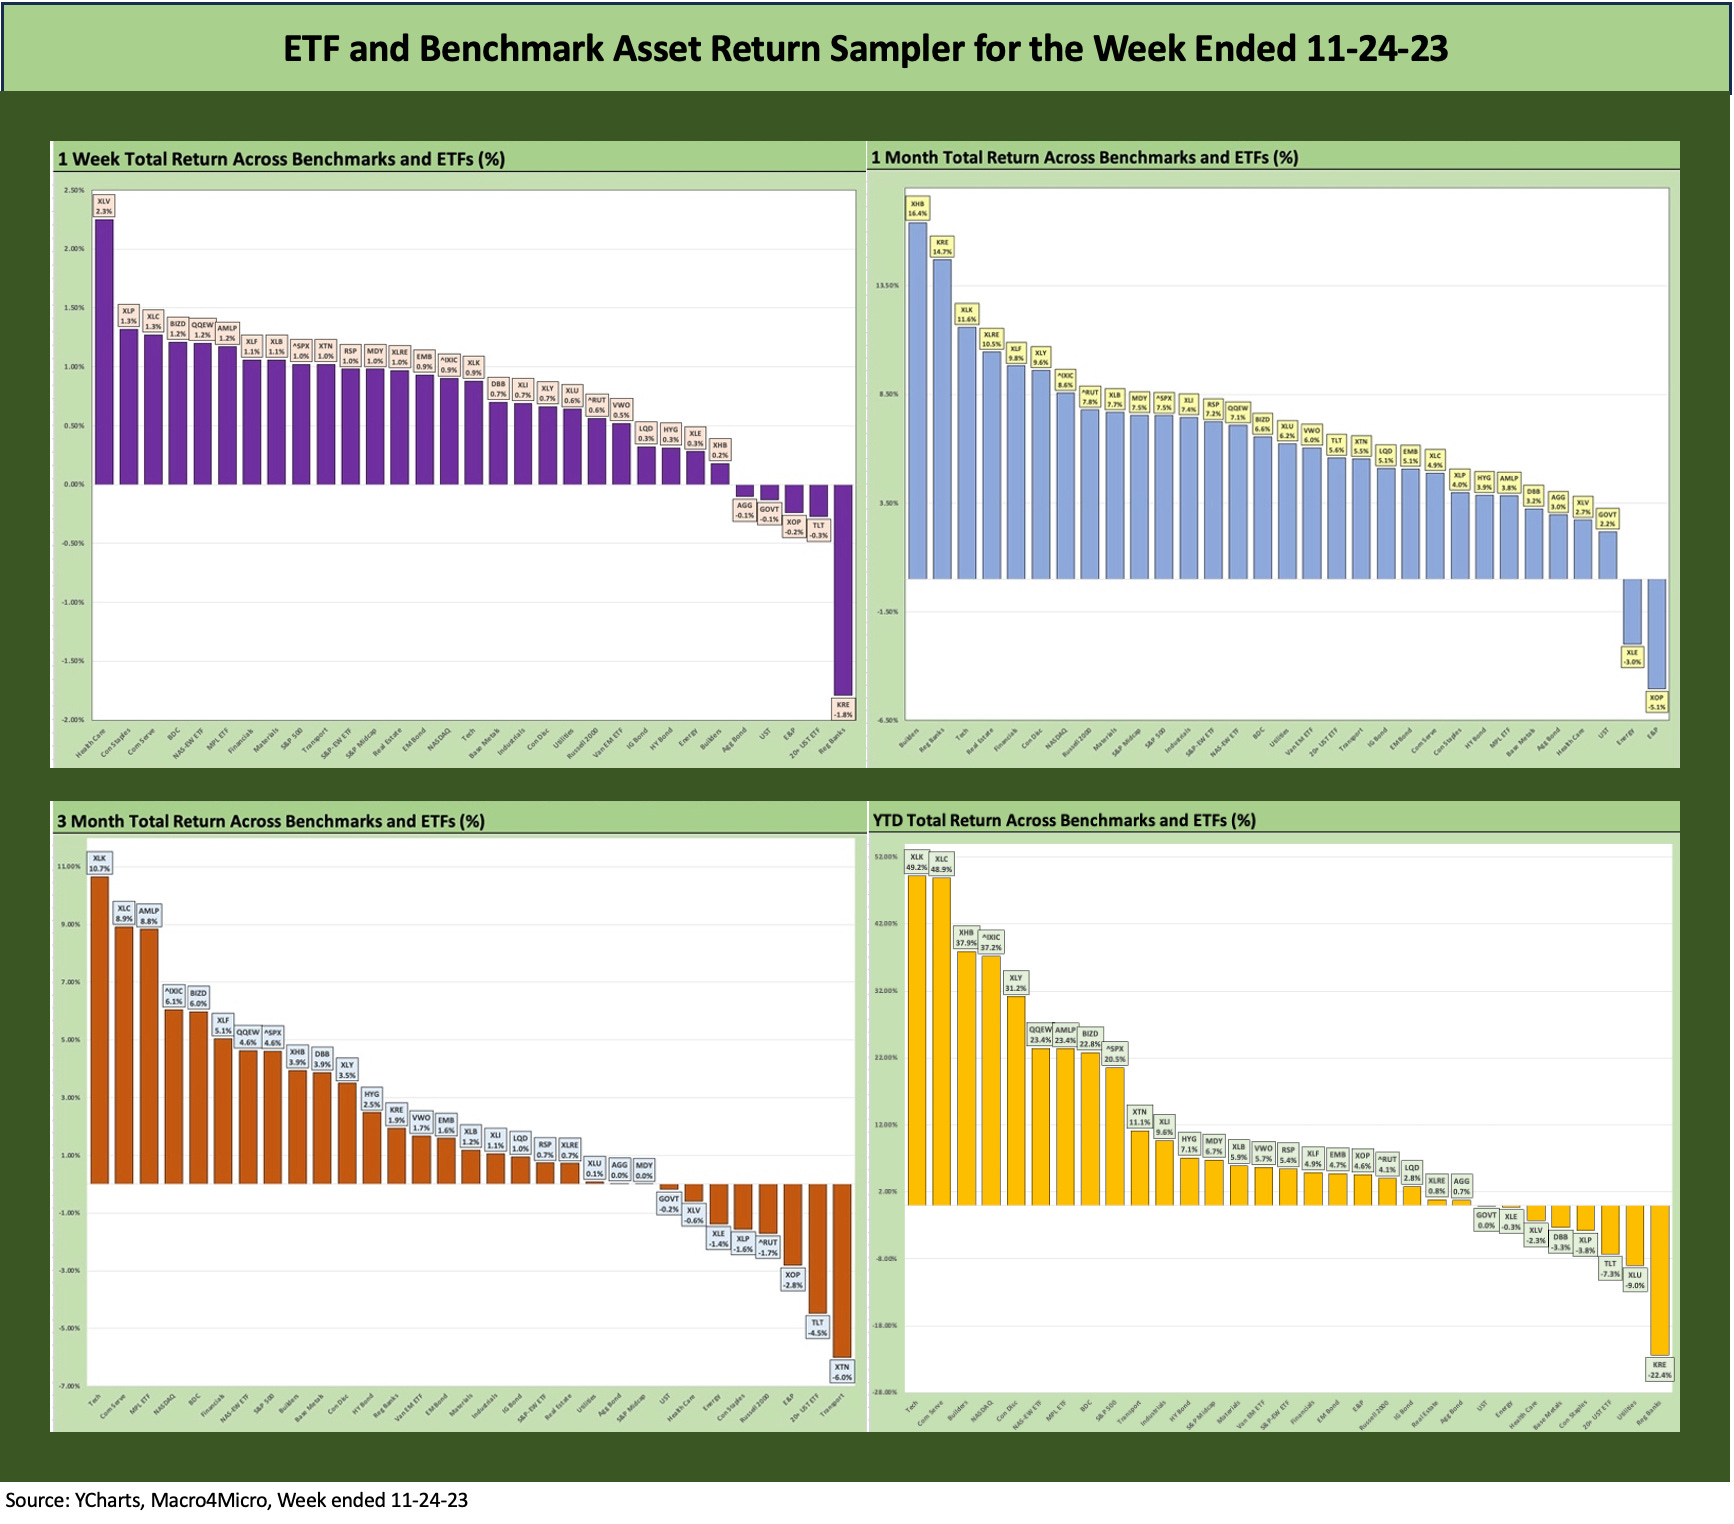
The above chart shows another strong week and very strong month keeping the “shift left” going for the rolling 3 months and YTD performance. The 1-month scoresheet of 29 positive and 2 negative is impressive with both equity risk and fixed income winning. The only 2 ETFs in negative range were the E&P ETF (XOP) and Energy (XLE) as oil prices have been under pressure and OPEC supply confusion has been a theme to wrap last week. For YTD, the 31 ETFs and benchmarks ring up a score of 23-8 favoring positive and with only one double digit negative in Regional Banks ETF (KRE).
Time horizon asset returns…
In our next four asset return charts, we cover 1-week, 1-month, 3-month, and YTD time horizons for a range of ETF and benchmark returns. We look at 31 different benchmarks and ETFs that cut across a wide expanse of the economy.
In this week’s Footnotes & Flashbacks for asset returns, we add 3 more ETFs to the mix, including one for midcaps (SPDR S&P Midcap 400, ticker MDY), one for emerging markets equities (Vanguard FTSE Emerging Markets ETF, ticker VWO), and one for EM USD bonds (iShares JPM Emerging Market USD Bonds, ticker EMB). We needed some EM representation in EM equities and bonds as well as some benchmark to connect the large and small caps.
Midcaps have a wide variety of valuations with growth companies to go with diverse industry groups. Midcaps also have a fair amount of overlap with the HY issuer base and credit intensive sectors generally with less of the narrow issuer distortion that we see in the broad market large caps.
The Magnificent 7 heavy ETFs…
Some benchmarks have a few issuer concentration elements that leave them wagged by a few names. When looking across some of the bellwether industry/subsector ETFs, it is good to keep in mind which narrow ETFs (vs. broad market benchmarks) get wagged more by the “Magnificent 7,” including Consumer Discretionary (XLY) with Amazon and Tesla, Tech (XLK) with Microsoft, Apple, and NVIDIA, and Communications Services (XLC) with Alphabet and Meta.
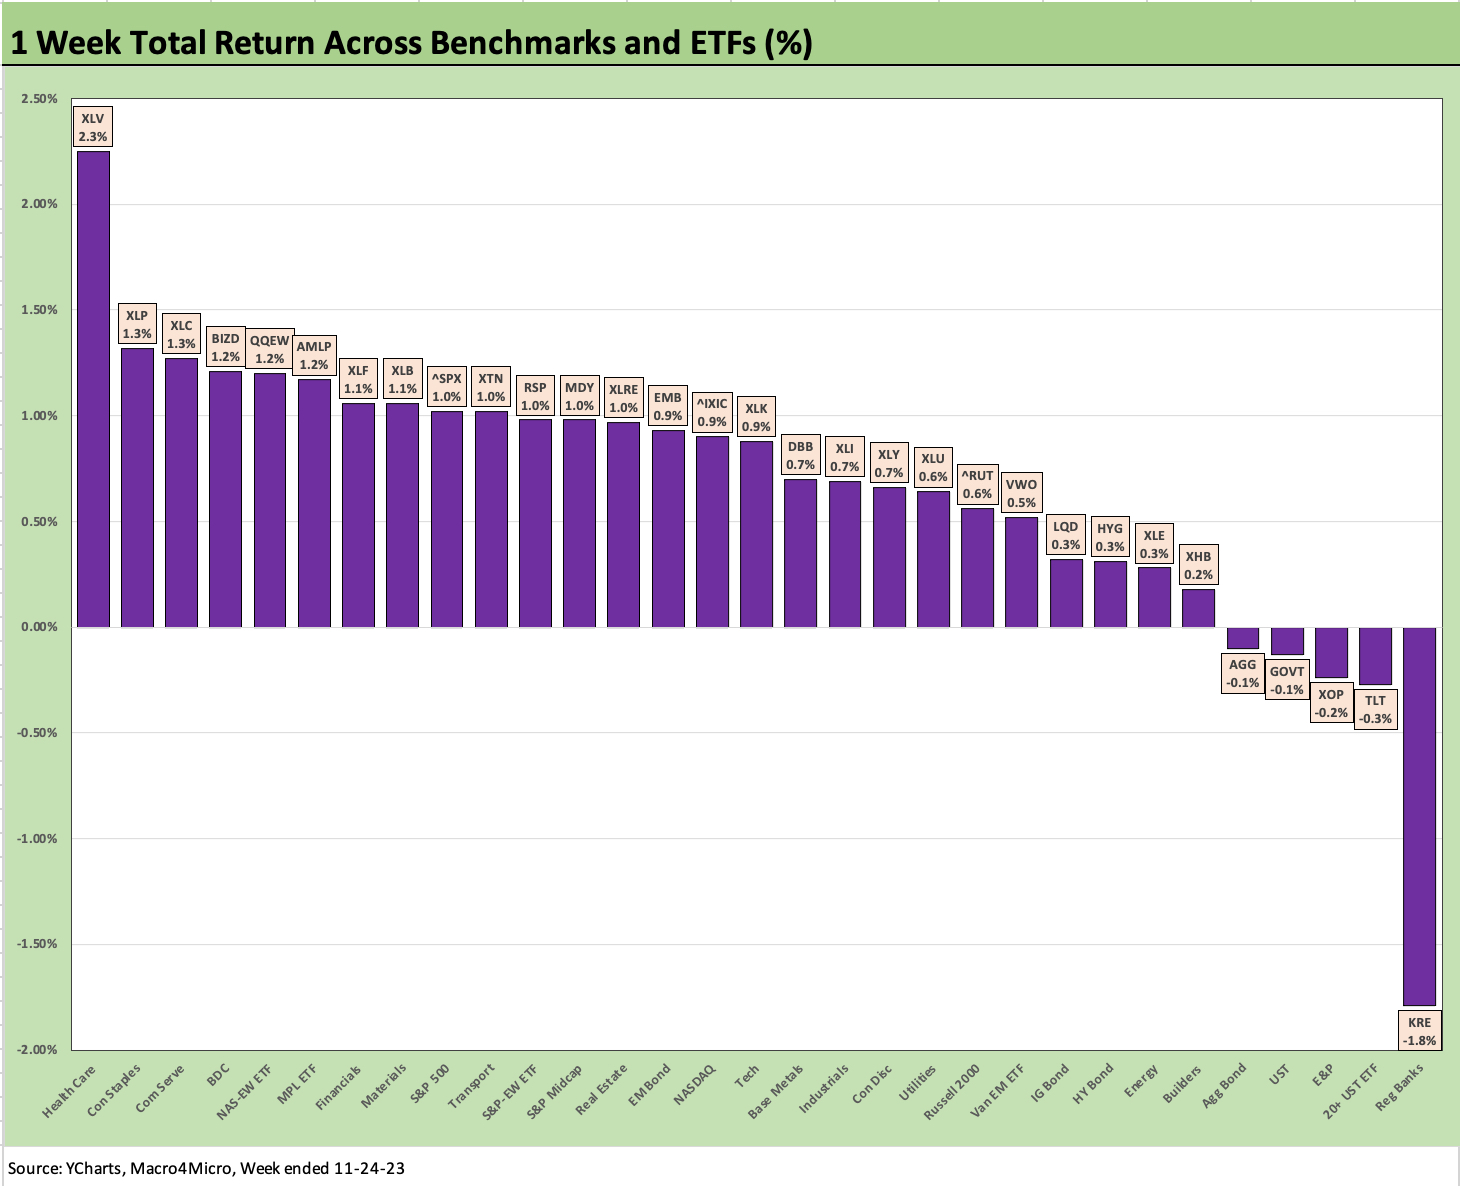
The 1-week time horizon weighs in at 26-5 with 3 fixed income ETFs, Regional Banks (KRE), and the E&P ETF (XOP) in the red. We can explain the very low negative returns on fixed income ETFs on a modestly adverse UST curve shift as detailed in our separate Footnotes publication on the State of Yields (see Footnotes & Flashbacks: State of Yields 11-26-23).
The most impressive trend this past stretch has been a breadth of the equity rally across large cap sectors and from large cap to small cap. You get a flavor of that in the past week’s stock buckets. We see 13 of the ETFs and Benchmarks above 1% for the week with only one above 2% in the form of the defensive Health Care ETF (XLV). We see only one worse than -1.0% with KRE.
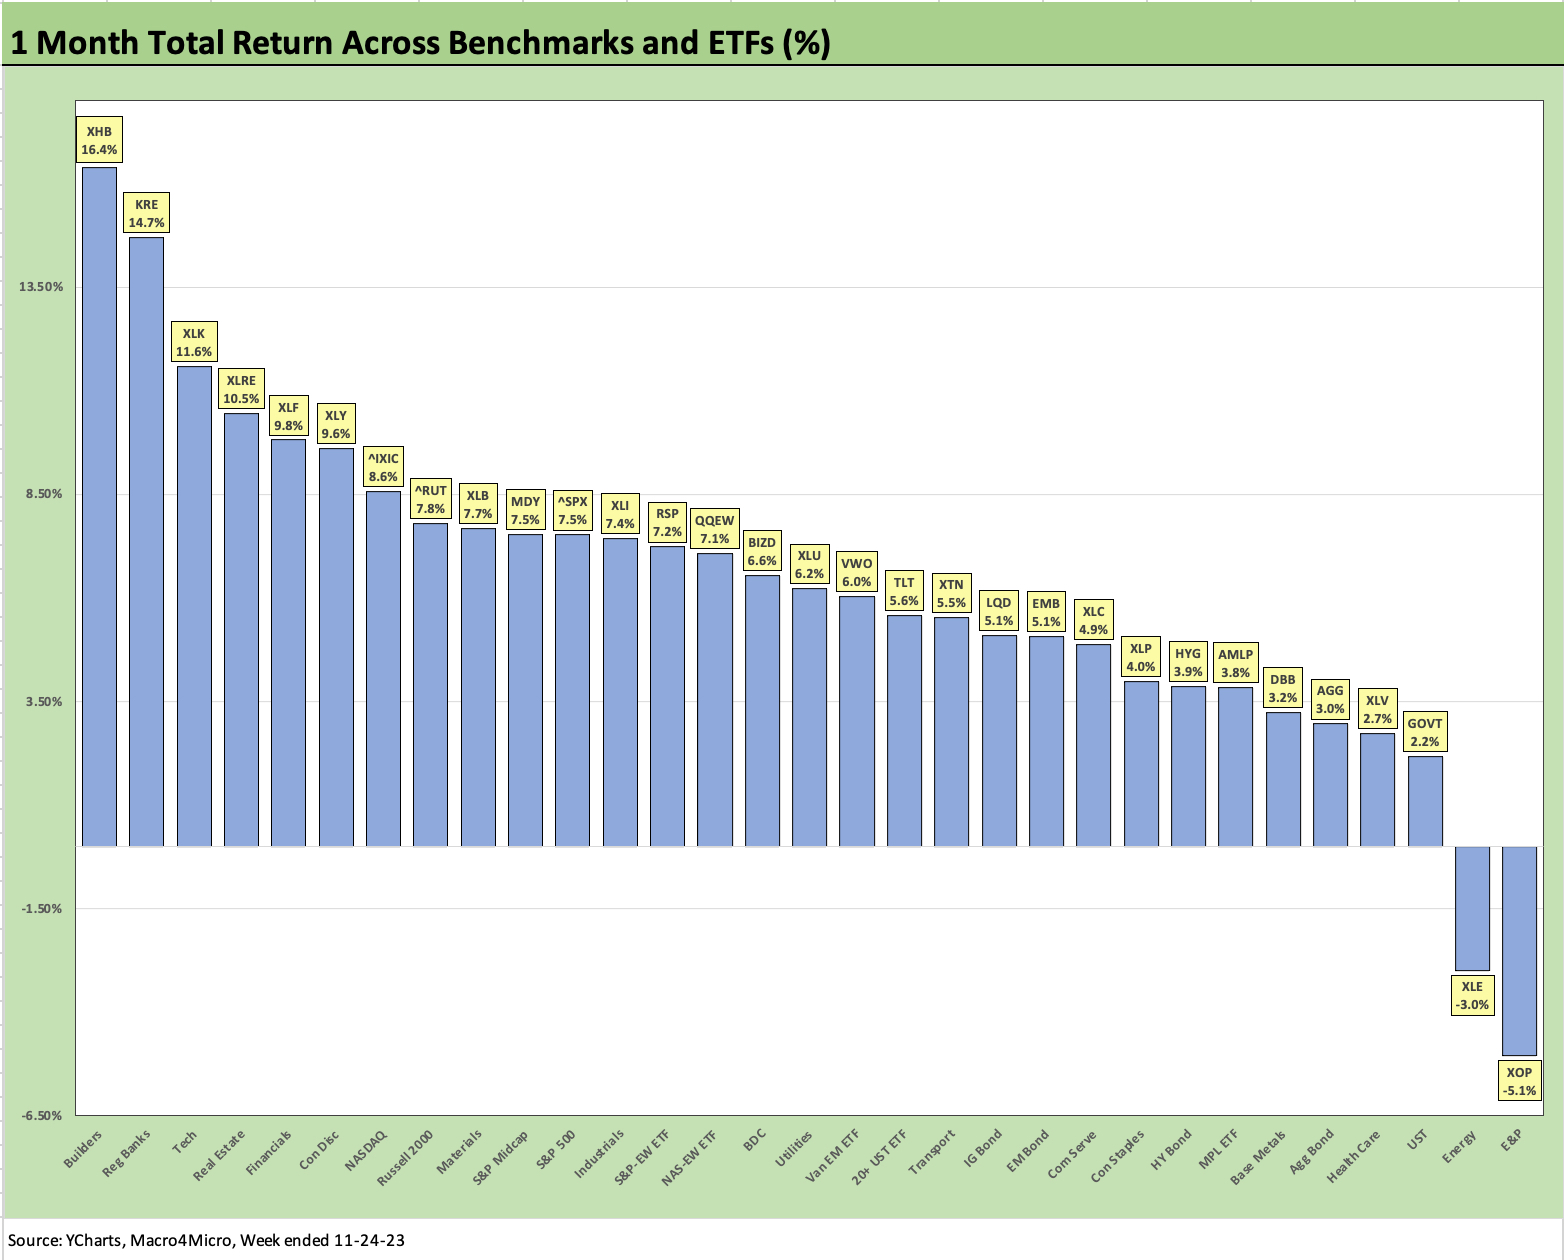
The 1-month time horizon results detailed above is the bellringer for the return comeback for a wide range of assets across a wider range of equity groupings by industry and also in fixed income. We see 29 positive and 2 negative with 21 of 31 putting up 1-month returns above 5%.
We see homebuilders (XHB) on top at +16.4% after they faced some headwinds when the UST curve was steepening and generating some headlines after a very solid YTD overall. XHB is still #3 of the 31 on a YTD basis and ahead of a few tech and Magnificent 7 heavy ETFs.
Regional Banks and Financials had a very strong month in what was a very bad year overall for the most interest rate sensitive sectors with Regional Banks (KRE) serving as the posterchild for grim. Real Estate had a good month that pulled it up into a slightly positive return (less than 1%) for the year.
The tech-heavy benchmarks, growth names and Magnificent 7 heavy ETFs had a solid month also with 3 in the Top 10 in Tech (XLK), Consumer Discretionary (XLY), and NASDAQ (IXIC). We also see small caps (RUT) at #8 in the Top 10, Midcaps (MDY) at #10, and the S&P 500 just missing at #11. Materials (XLP) at #9 added some diversity to the mix.
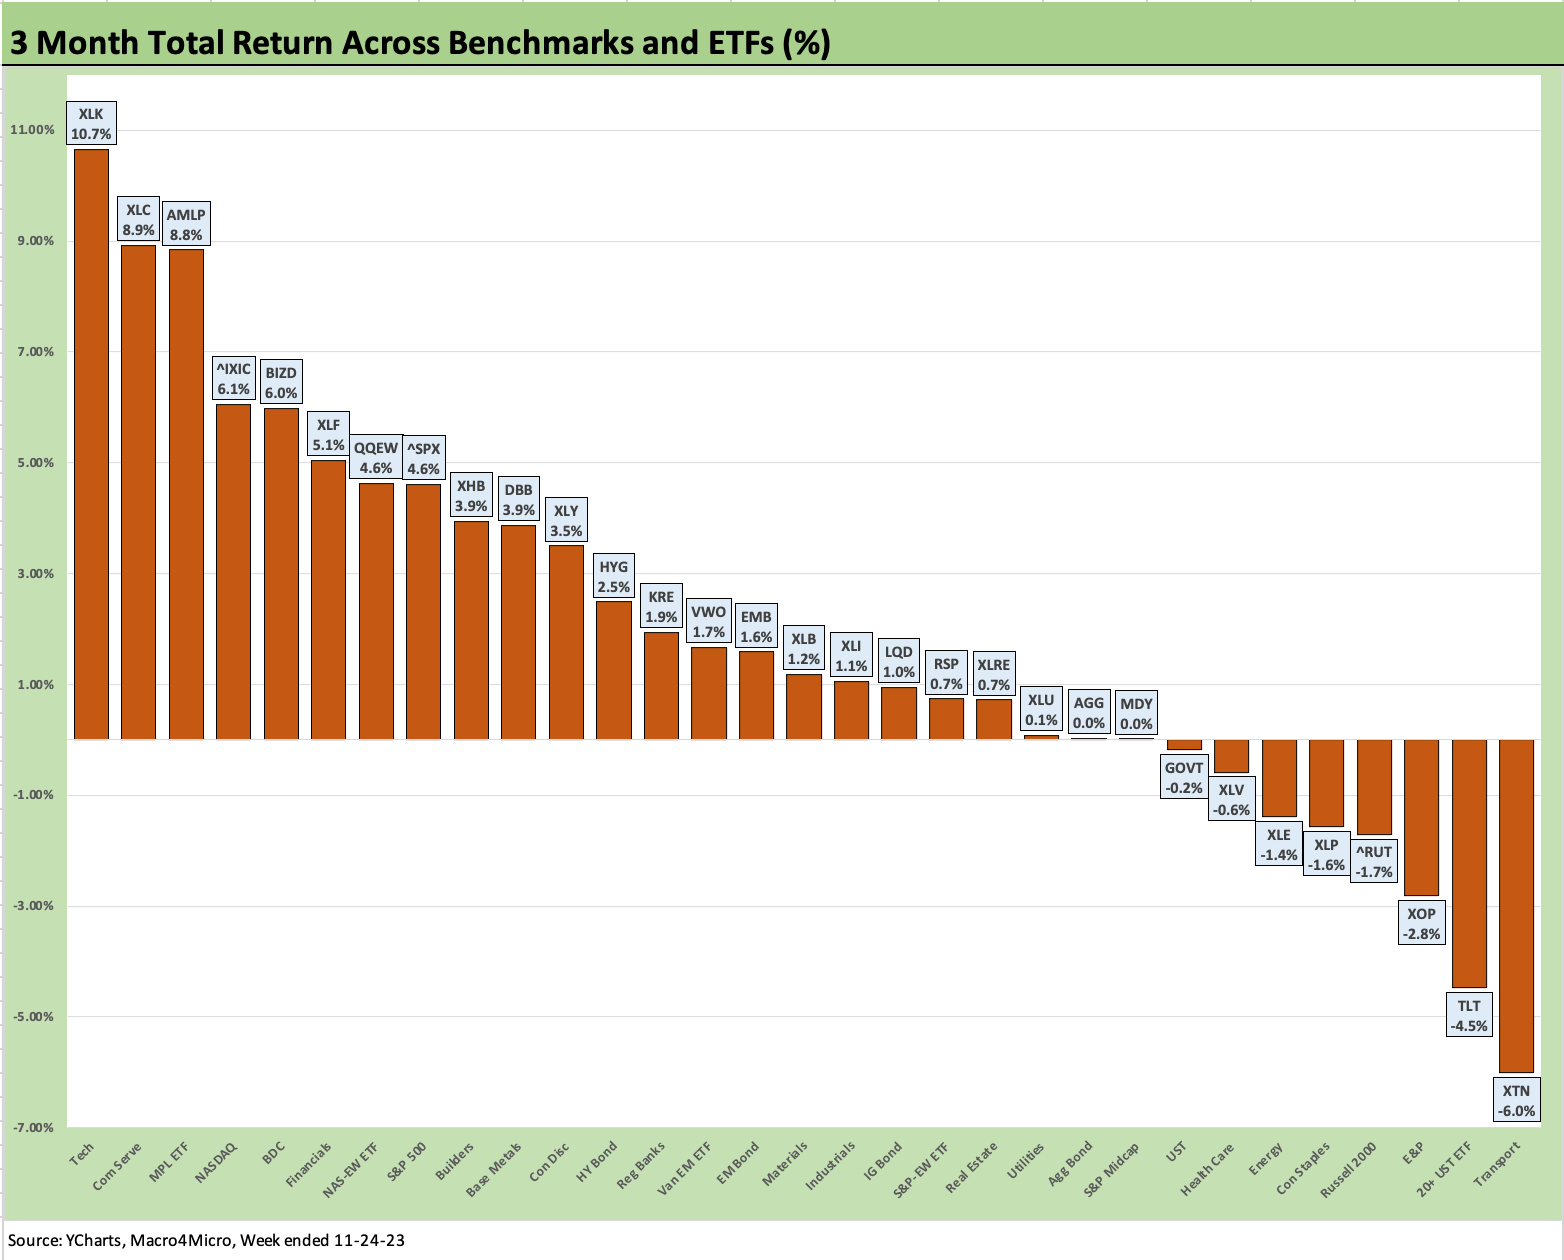
The 3-month came in at 23-8 although with Utilities (XLU), Aggregate Bonds (AGG), and S&P Midcaps (MDY) in positive range but rounding down to zero. Similarly, the equal weighed S&P 500 (RSP) and Real Estate (XLRE) are under +1%. So, some of the ETFs remain on the cusp of negative with the timeline in 4Q23 winding down for the year.
Fixed income is very much a mixed picture over the 3 months with HYG in the 2nd quartile but the duration-heavy 20+ Year UST ETF (TLT) is second to last only ahead of Transports (XTN). The IG Corporate ETF (LQD) is down in the 3rd quartile with AGG while GOVT sits in slightly negative territory.
The winners in the top quartile include 4 in the tech-centric bucket with Tech (XLK) at #1, Communications Services (XLC) #2, NASDAQ at #4, and the equal weighted NASDAQ 100 (QQEW) at #7.
Among two ETFs that have been consistently strong across 2023, we see the Midstream Energy ETF (AMLP) and BDC ETF (BIZD) in the top quartile for the rolling 3 months. They are right there in the bottom of the top tier in YTD performance also (next chart) at #7 (AMLP) and #8 (BIZD).
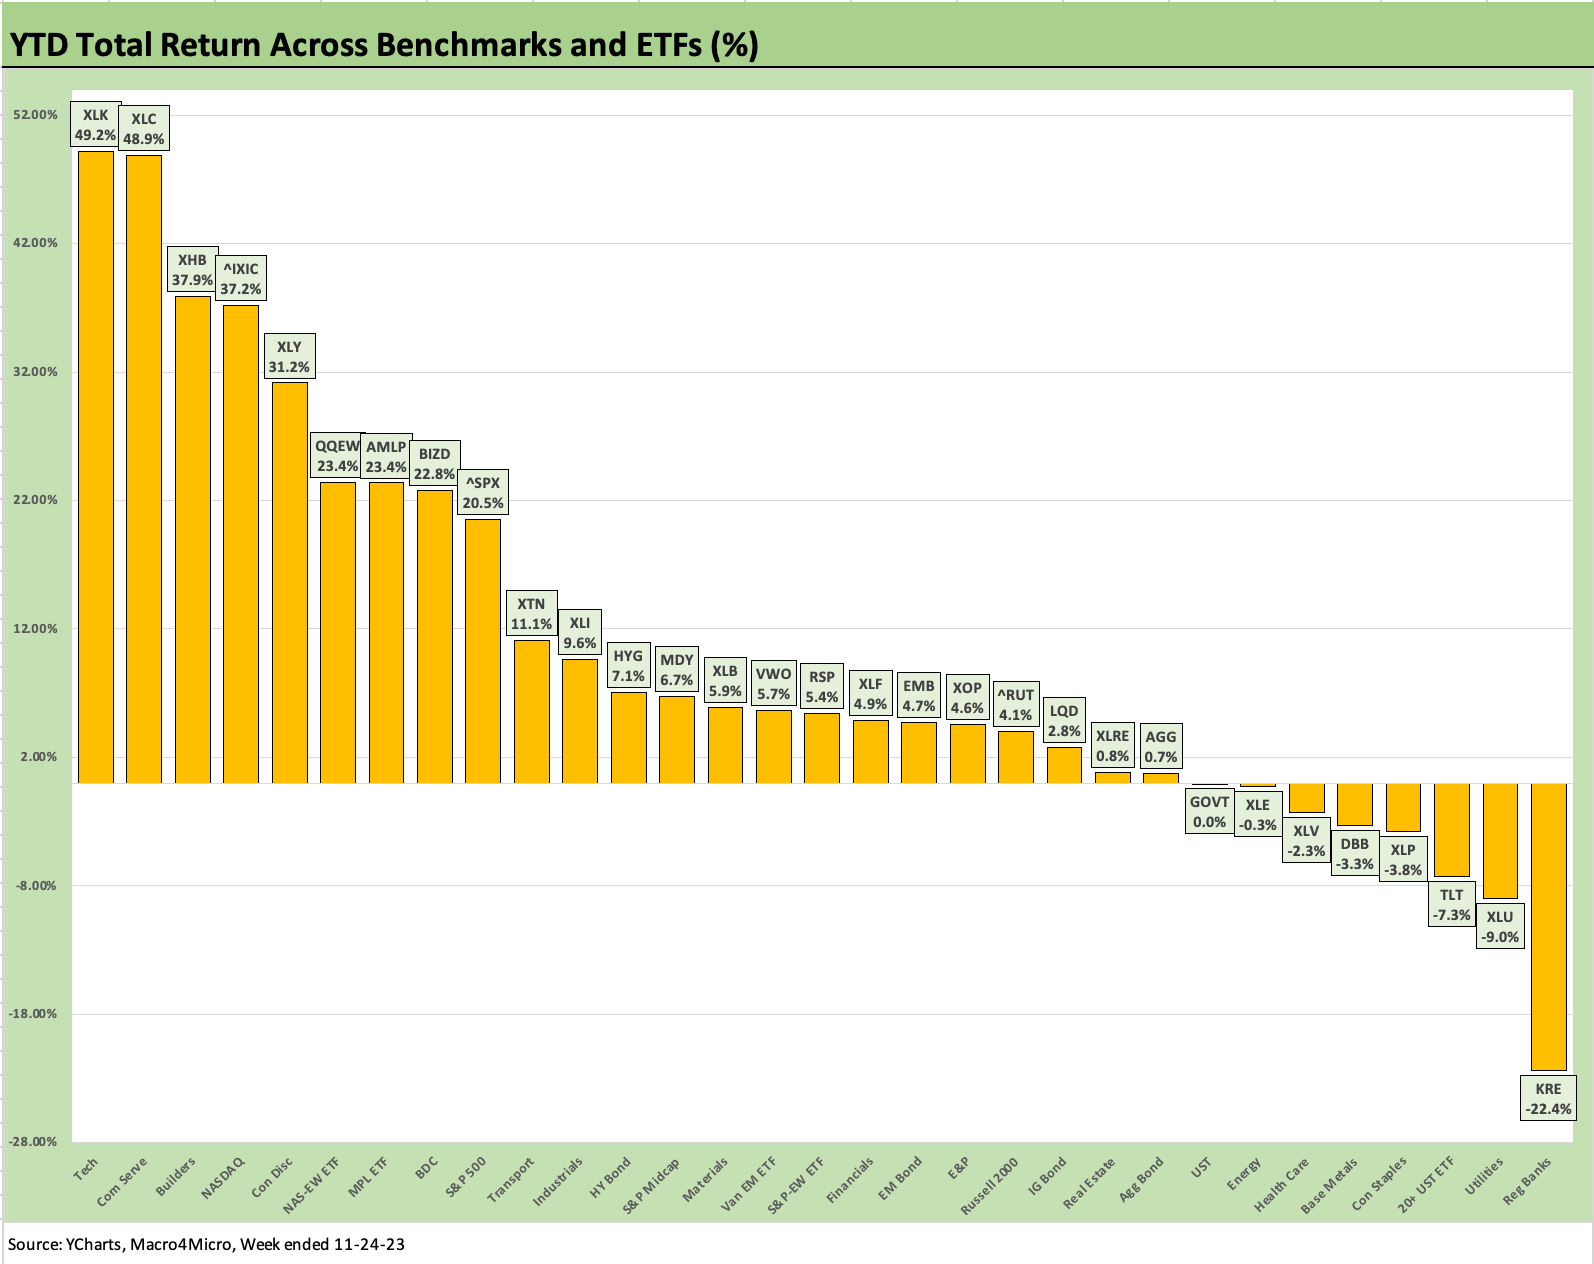
The above chart shows the YTD ranking at 23-8 with 9 of the benchmarks and ETF above a 20% return handle with only one ETF negative double digits (KRE at -22.4% in last place). GOVT is on the negative side of zero.
We see 5 of the top quartile (we include the Top 8) in Tech or Magnificent 7 Heavy ETFs with the Tech ETF (XLK) at #1, the Communications Services ETF (XLC) #2, NASDAQ at #4, Consumer Discretionary (XLC) at #5, and equal weighted NASDAQ 100 (QQEW) at #6.
Builders (XHB) break up the tech mafia and Mag 7 with XHB at #3 while Midstream Energy (AMLP) was at #7 and BDCs (BIZD) at #8.
Duration plays such as the 20+ year UST ETF (TLT) and interest sensitive or defensive equities (Utilities, Staples, Health Care) ranked in the bottom tier. Regional Banks (KRE) lost the year in March. Base Metals (DBB) was part cycle and part China story.
If the next few weeks play out to the upside, there are a few benchmarks that will have pulled some positive return rabbits out of their hat with small caps near the top of that list with Russell 2000 currently standing at +4.1% YTD after a +7.8% month. Midcaps (MDY) at +6.7% is also important comeback story at this point after a +7.5% month.