
Footnotes & Flashbacks: Asset Returns 10-8-23
We look at another bad week for asset returns with the UST curve tagged as the culprit.


The events in the Mideast make you forget a mediocre market week with UST volatility, but the realization that Congress needs to go operational again is a challenge for budgets and the ability of so many different government functions to operate (defense, intelligence, domestic law enforcement, etc.).
On the more routine topics, the UST market and the challenging upward migration of the UST curve has been the cloud over equities even without the budget crisis ahead.
The CPI release is always important, but it might be even more critical after the strong job numbers last week.
The Israel-Hamas clash we woke up to early on Saturday morning creates a whole new set of challenges as the GOP scrambles for a Speaker of the House. Budget decisions just got much more critical in the context of what will be an even more unstable world.
In our yield curve Footnotes yesterday (Footnotes & Flashbacks: State of Yields 10-7-23), we recounted some of the history of how crazy the situation was in the US and the world 50 years ago when the last sneak attack on Israel took place. The Yom Kippur War set off a far more threatening sequence of events on a global scale than many recall.
We will see how the Speaker vote process plays out, but the stakes are higher now. There is a need for the US to show some unity, but “Trump and the Primary Pips” (think Gladys Knight backup singers) have already been blaming Biden for the Hamas attacks. A bipartisan budget on Defense overall and Ukraine and Israel aid would be on a stability wish list.
For now, it is clear that we are off to a slow start on the foreign policy unity thing in the new world where everything is the other guy’s fault. George W. Bush hit a 90% rating in the Gallup Poll (9/11) and George HW Bush hit 89% (Feb 1991 post-Desert Storm) in the midst of global tension. The patriotism bump is not what it used to be. That said, unity is critical now, especially in light of the risk that the US gets entangled with reports of dead and captured Americans and a carrier group headed that way.
There have been some eloquent commentators on the nonstop cable and online news coverage, and the one that stood out (an Israeli Minister) was that on a population-adjusted basis, what transpired this weekend in Israel was the equivalent of 10 x the 9/11 death toll (with higher numbers still rolling in). The question from him was “If there were ten 9/11s and someone said, ‘the US should show restraint’, what would the US say?” That makes a statement on what lies ahead.
Asset Returns still more wagged by UST but earnings season is dead ahead…
Asset returns and expectations will have the Mideast crisis as a backdrop as we shift into our weekly review looking at the past week.
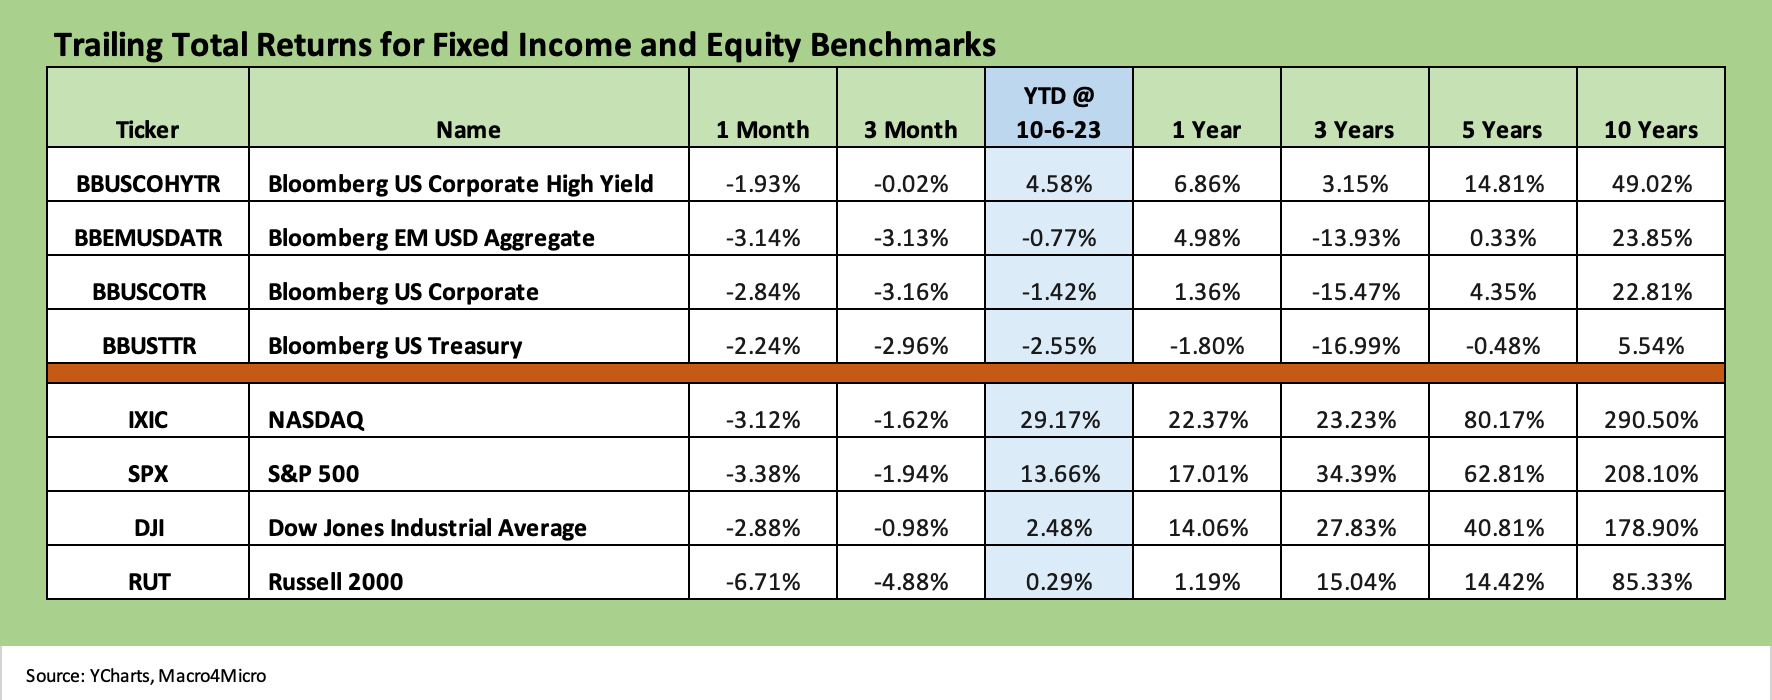
The above chart updates the returns on the debt and equity benchmarks we track. We line them up in descending order of YTD total returns. This week saw the S&P 500 and NASDAQ pull out a small positive week on the big Friday rally.
For the past month, we see the debt benchmarks all in the negative zone and the same for 3 months. HY even dipped just below the line as spreads widened and the curve headed higher. We detail HY OAS action in the separate State of Yields update. Only HY is positive YTD in the debt mix in the chart above.
We look at equities below and again in the ETF time horizon section lower in this piece. The chart above shows negative numbers for 1 month and 3 months with YTD showing NASDAQ still living off the big rally earlier in 2023.
The S&P 500 broad market benchmark is in double digits. As we cover in the ETF section, an equal weighted S&P 500 ETF (RSP) shows the YTD return positive but falling short of 1% YTD as the Magnificent 7 ruled the market cap based index. For this past week, the market saw 6 of the Magnificent 7 positive with AMZN very slightly negative.
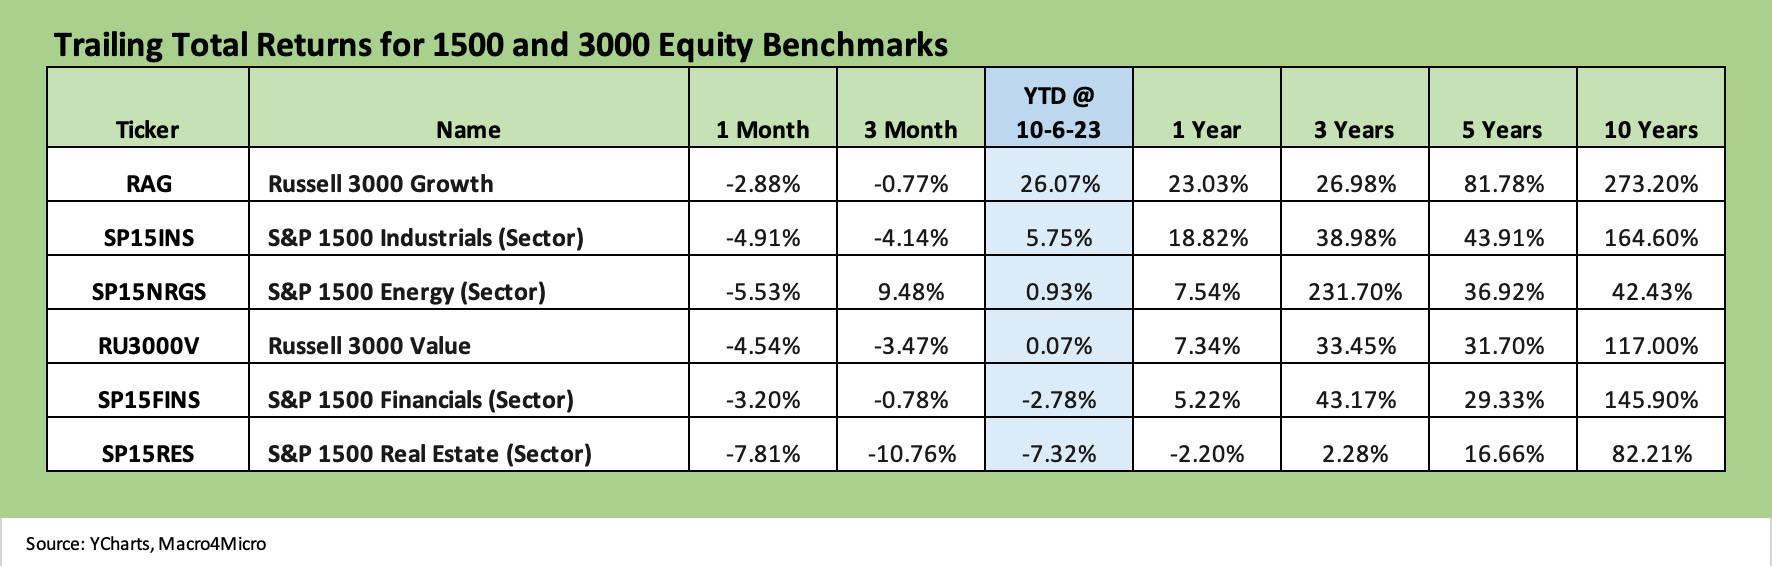
The above chart updates the 1500 and 3000 series and shows the trailing month posting a shutout in terms of positive returns with everything in the red – even Energy. Looking back across 3 months, we see 5 out of 6 in the negative range with only Energy riding the oil price rebound to a solid +9.5%.
YTD, we see 2 negative (Financials and Real Estate) and 4 of the 6 not clearing the 1% level YTD with Value and Energy under 1%. That left Growth way out in front at +26% and Industrials at least making it to mid-single digits at +5.8% after the recent fade.
ETF and benchmark returns…
In our next four asset return charts, we cover 1-week, 1-month, 3-month, and YTD time horizons for a range of ETF returns. We look at 26 different benchmarks and ETFs that cut across a wide expanse of the economy. We recently added the YTD version as we are now in the 4Q23 period. The usual question of “What kind of year was 2023?” is starting to look for a general description.
As detailed further below, at least there are a lot of subsectors and industry ETFs well in the black YTD. We have seen materially worse years than this even during cyclical expansions. For a year where cash came in at #1 in returns vs. debt and equities, the year 2018 immediately leaps to mind. It is no coincidence that 2018 was the end of tightening ahead of some 2019 easing.
We recently added equal-weighed ETFs for the S&P 500 (RSP) and NASDAQ 100 (QQEW) given the market cap weighted distortions in the total returns for those benchmarks that had been driven for much of the year by the mega-names. The YTD return profile for market cap weighted ETFs vs. Equal Weighted ETFs offer a clear reminder of what an unusually imbalanced year it was to this point. The SPX returned +13.7% YTD while the S&P 500 equal weighted ETF (RSP) weighed in at 0.5%.
When looking across some of the bellwether industry/subsector ETFs, it is good to keep in mind which narrow ETFs (vs. broad market benchmarks) get wagged more by the “Magnificent 7” including Consumer Discretionary (XLY) with Amazon and Tesla, Tech (XLK) with Microsoft, Apple, and NVIDIA, and Communications Services (XLC) with Alphabet and Meta.
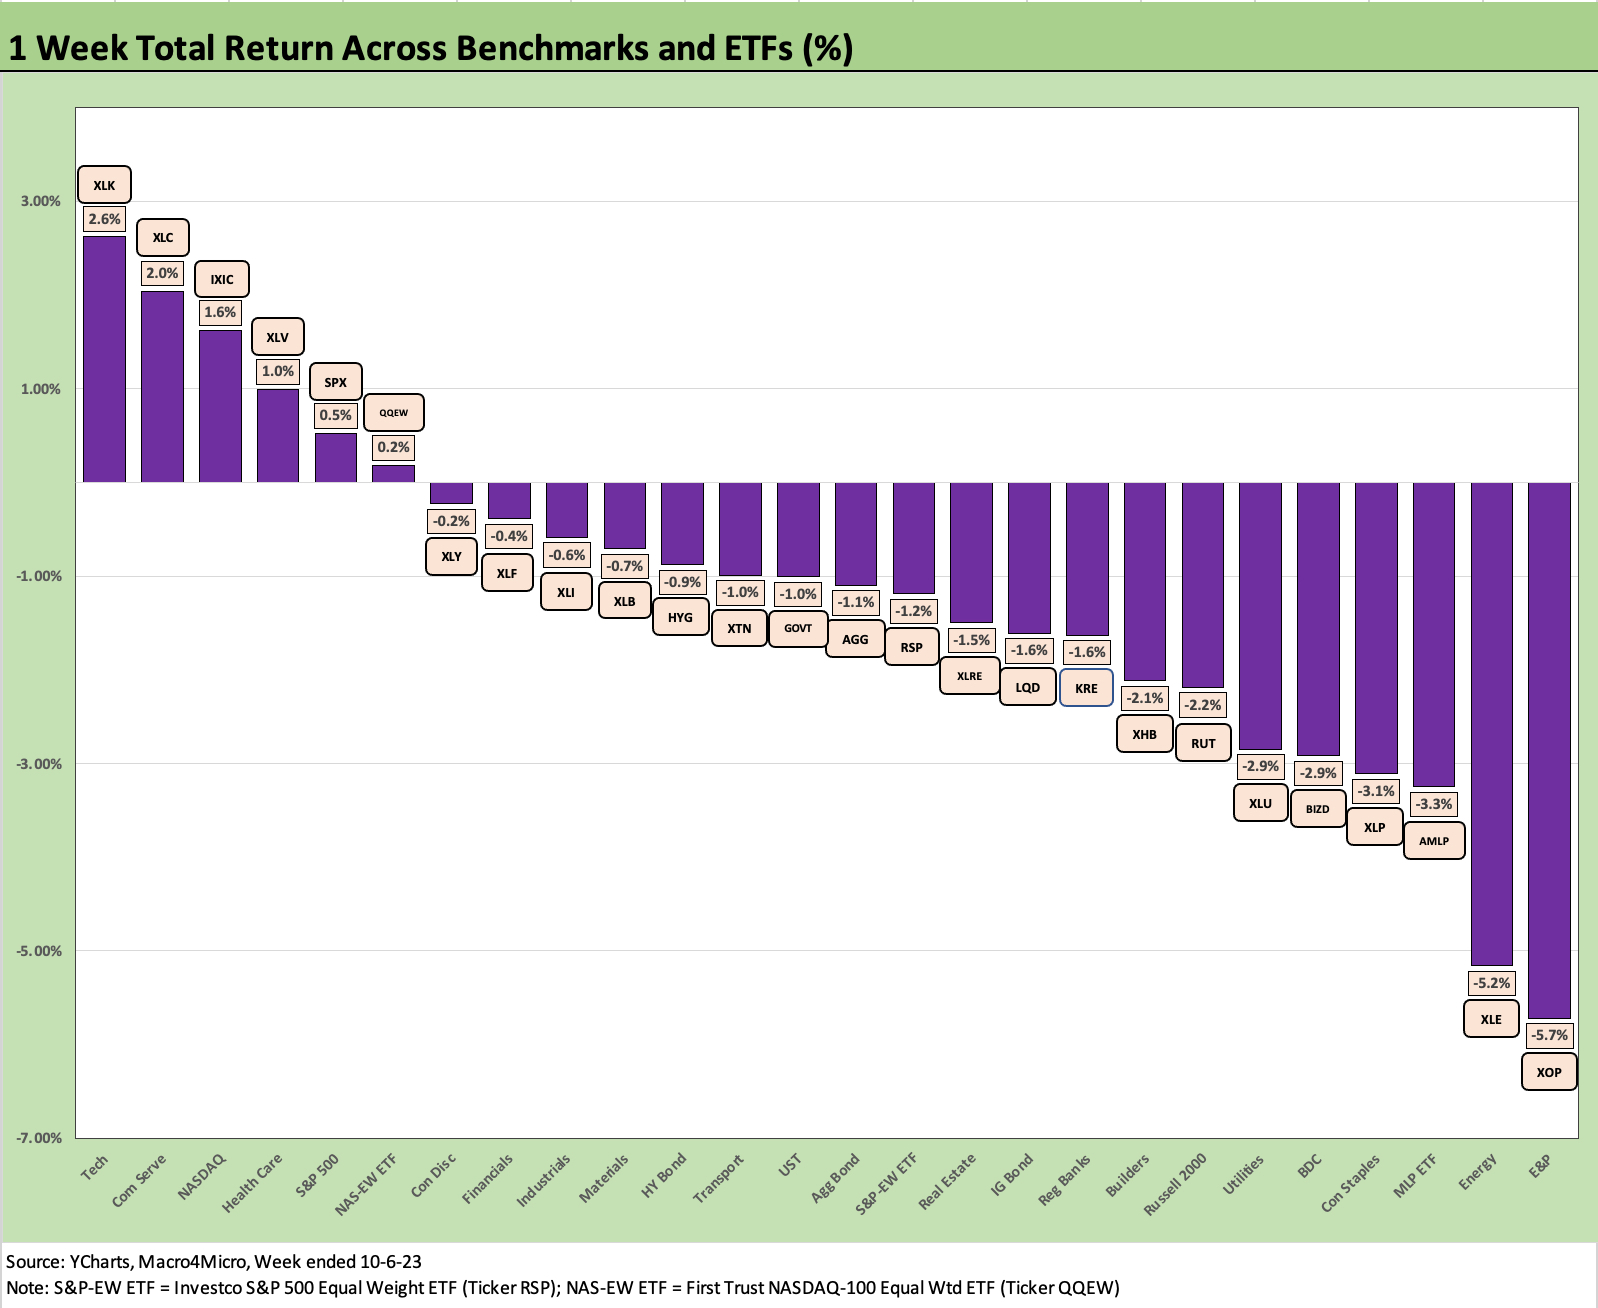
The past week posted 6 ETFs/Benchmarks in positive range and 20 negative. Of the 6 positive, 4 were tech-centric or Magnificent 7 heavy with the tech stock recovery to end the week. The Healthcare ETF (XLV) and S&P 500 also made it into positive range.
Sitting on the bottom was the E&P ETF (XOP) as oil posted a sharp decline from a $90 handle (WTI) last Friday to an $82 handle to end this past week. The bottom 3 include the recent Energy winners with the large, diversified Energy ETF (XLE) and Midstream ETF (AMLP) rounding out the bottom.
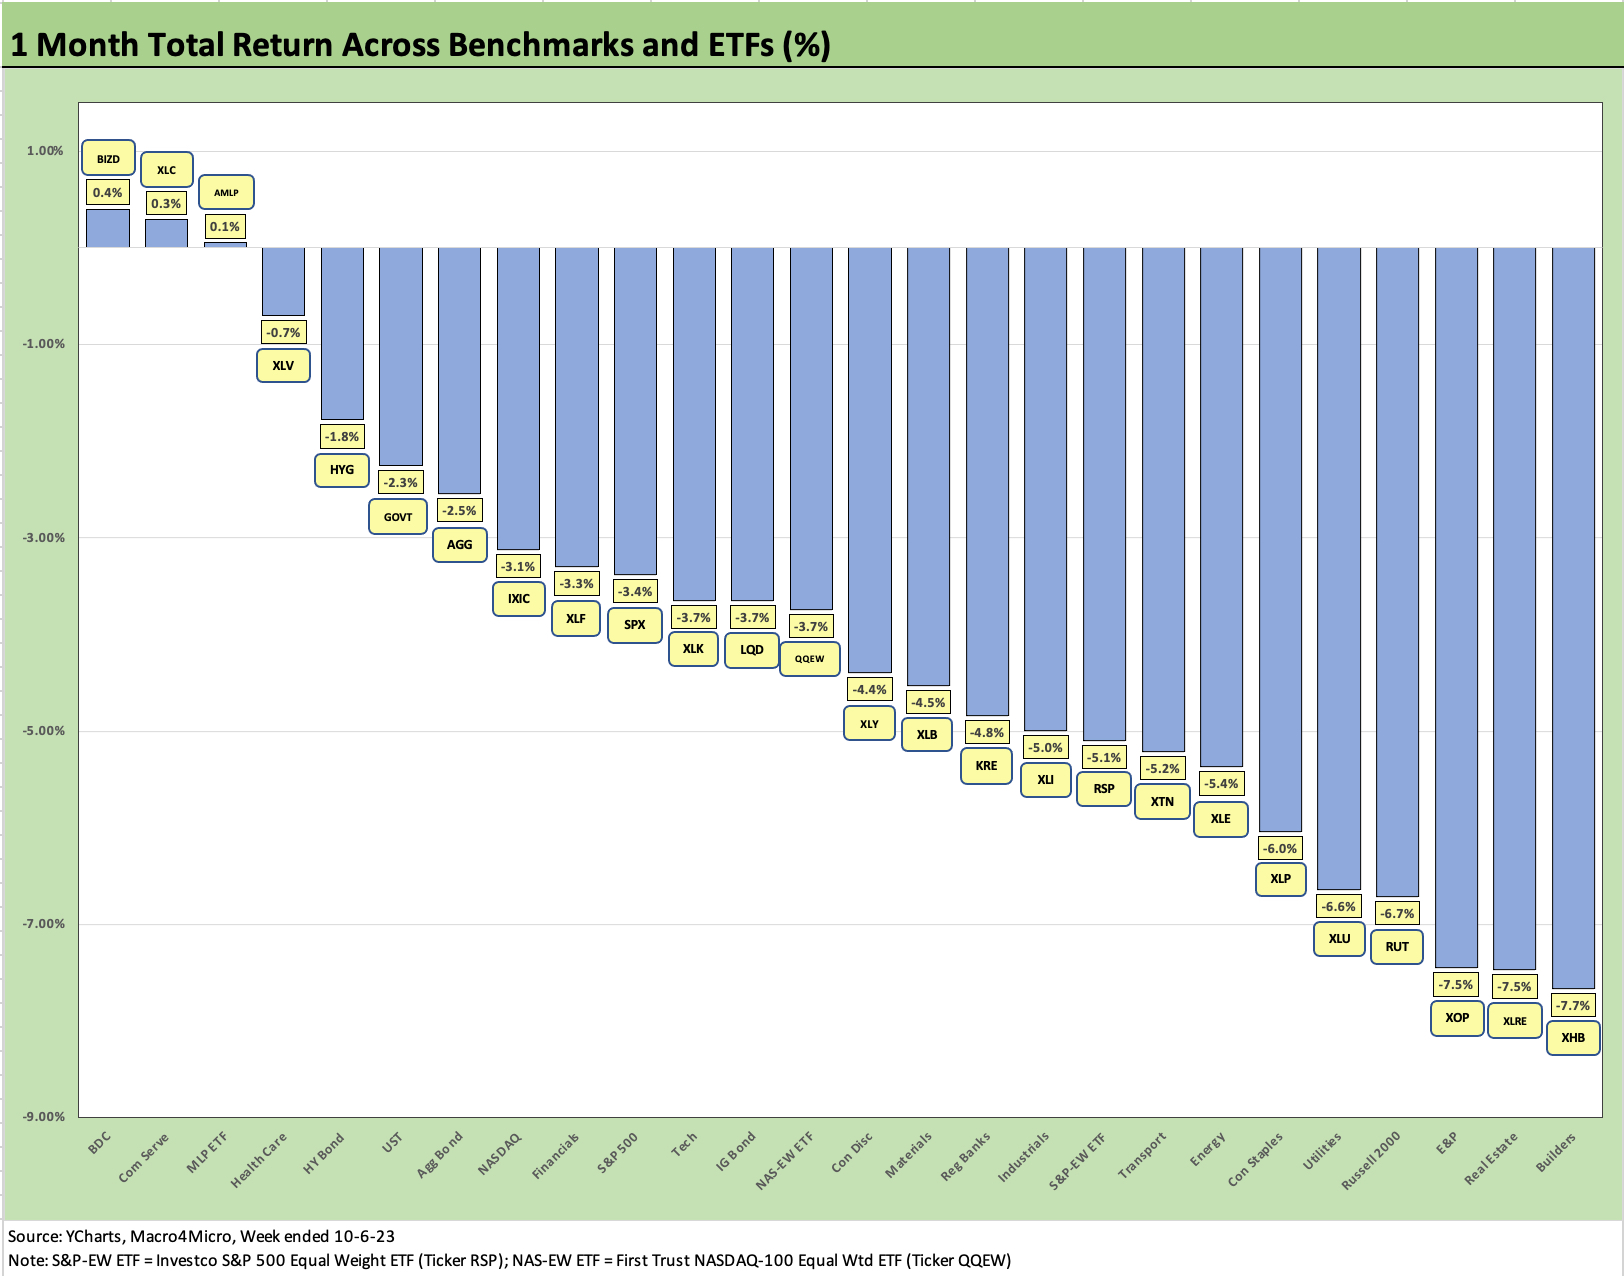
The trailing month stayed ugly with only 3 ETFs in the black with the BDC ETF (BIZD) on top at only +0.4% followed by the TMT-heavy Communication Services ETF (XLC, with Alphabet and Meta) and the high dividend Midstream ETF (AMLP) at #3.
After a dazzling YTD run, the Builders (XHB) are taking some heat with mortgages creeping up into the mid 7% handle range for the Freddie Mac 30Y benchmark but with many quoted 30Y rates even higher and closer to 8%. Regular bottom dwellers such as Real Estate (XLRE) and Utilities (XLU) are in the Bottom 5 along with small caps (RUT). The E&P ETF (XOP) remains volatile with oil and is 3 off the bottom.
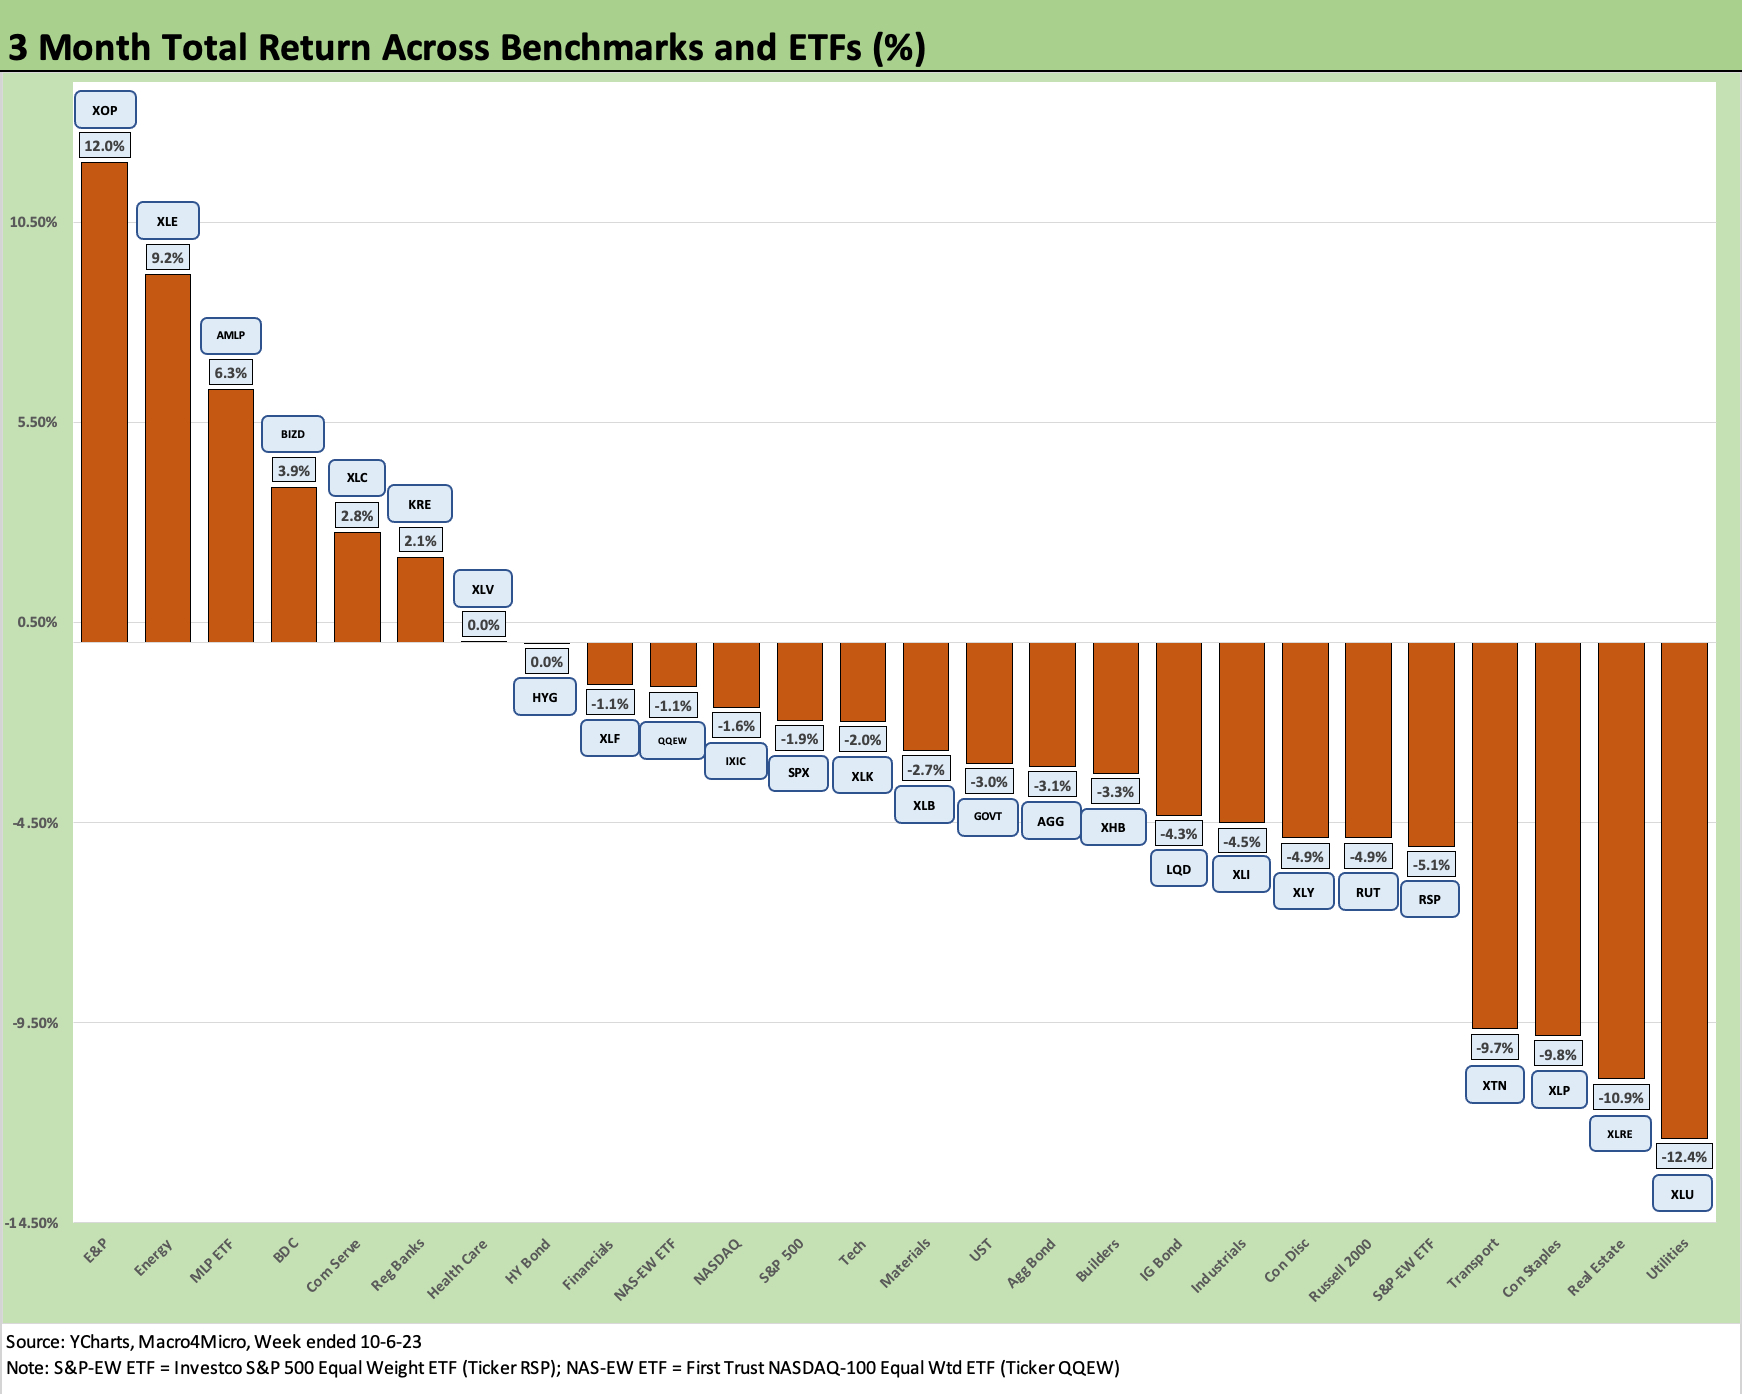
The 3-month chart is 7 positive vs. 19 negative. The energy ETFs ruled the top ranks with E&P (XOP) at #1, Diversified Energy (XLE) at #2, and Midstream (AMLP) at #3. BIZD is #4 on the back of solid earnings, high dividend payouts, and some sustained belief in the credit cycle and the health of secured floating rate loans.
Many of the major BDCs had locked in low coupon fixed rate debt and are showing favorable earnings growth on the floating rate assets and steady overall credit quality indicators and loss performance in the asset base.
The bottom ranks include some of the usual suspects with Utilities (XLU), Real Estate (XLRE), Staples (XLP), and Transports (XTN). The fixed income collection of ETFs are all in the red with HYG barely on the negative side of zero, but UST ETF (GOVT), the Aggregate Bond ETF (AGG) and IG Corporate ETF (LQD) all showed the wear and tear of duration. The bond ETFs did manage to beat the equal-weighted S&P 500 ETF over 3 months.
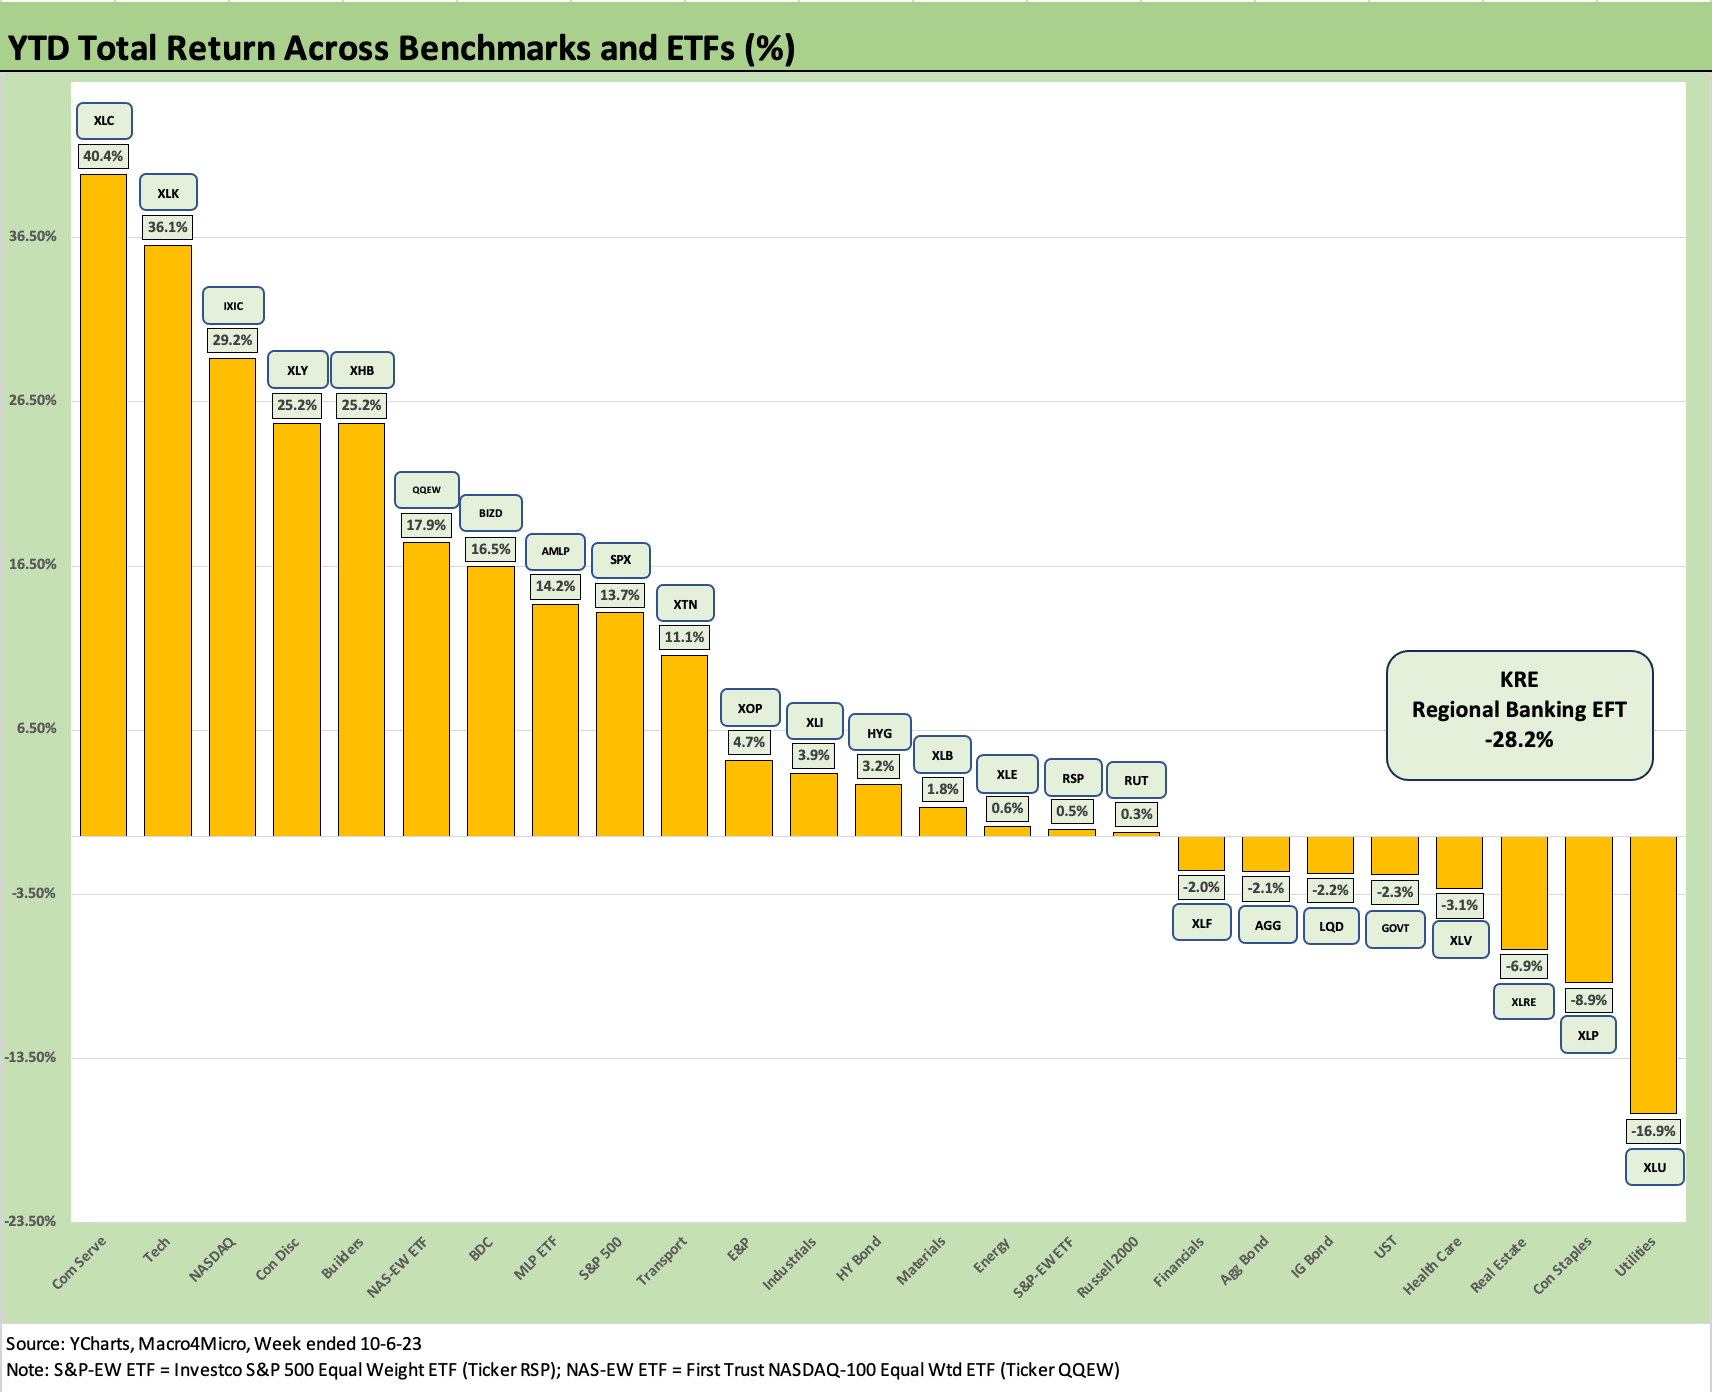
The YTD returns show a major divergence between winners and losers with a Hi-Lo range of almost 69 total return points. That is what keeps active managers in the hunt and day traders in very good and very bad moods. If we throw out the Hi and the Lo, the range is 53 points if we take out the abysmal returns on the Regional Bank ETF (KRE) at -28.2%.
The KRE return was so bad it got its own box (also to help chart optics). With a fresh round of data on the way during regional bank 3Q23 reporting season on the scale of unrealized losses and deposit trends, the bank markets could be vulnerable to March flashbacks. We imagine there will be some probing Q&A on regional bank calls.
The Top 5 YTD include tech-centric growth stories in the Top 4 with the Builders (XHB) at #5. Just below the top tier we see BDCs (BIZD) and Midstream (AMLP). The S&P 500 (SPX) is in the Top 10 at +13.7% but comes with a Magnificent 7 and tech asterisk as the Equal Weighted S&P 500 (RSP) was only +0.5%.
This week will have some major moving parts to absorb on how to frame the Mideast crisis unfolding and a carrier strike force moving into the Eastern Mediterranean with a license to be on guard for any unexpected misbehavior. That comes ahead of normal activities such as digesting CPI on Thursday. We also get FOMC minutes.