
Footnotes & Flashbacks: Asset Returns 11-19-23
We look at another week where duration and risk both won.


The mix of a very busy macro release week cutting across inflation, the consumer, and industrial production has the market celebrating an optimal balance of inflation signals plus fundamental macro indicators that were in the “not too hot” camp.
Trying to find pockets of material weakness in consumer spending, fixed investment, homebuilding, autos, aerospace, capital goods, and energy is a challenge even where modest declines and plateaus can be derived.
With earnings season essentially wrapped and retailers and January fiscal reporting companies weighing in, the overall flavor of the fall earnings season reports were constructive and pushed back on recession scenarios.
In this commentary, we look across the asset class returns in a period where the UST curve has posted an impressive rally while fundamentals are doing a good balancing act on the “no recession” scenario without undermining the lower inflation story. We looked at the yield curve dynamics of the week in a separate “Footnotes” report (see Footnotes & Flashbacks: State of Yields 11-19-23).
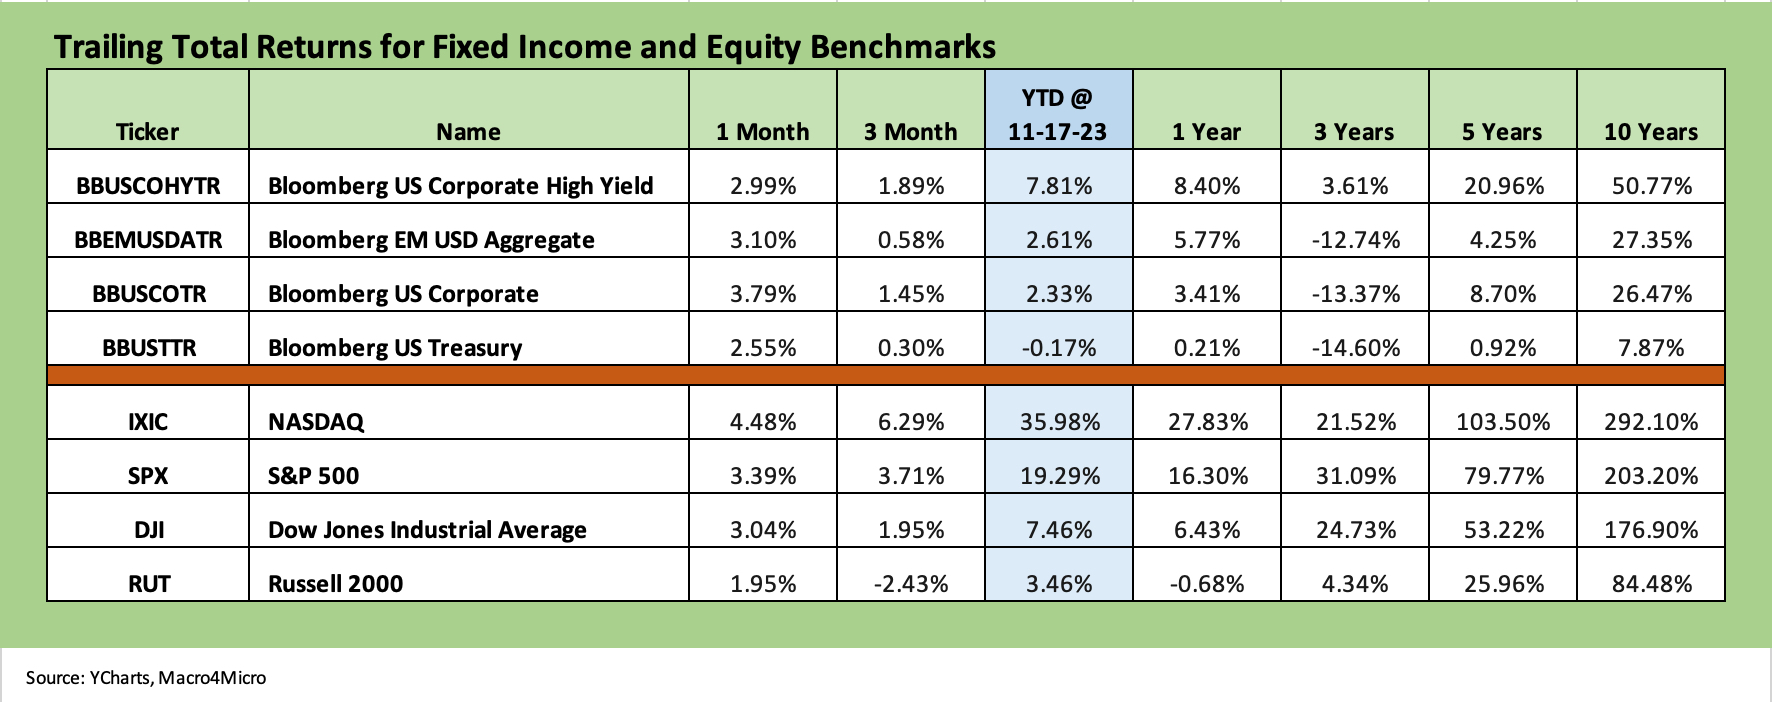
The above chart frames the returns for the debt and equity asset classes we routinely update. We see the trailing 1-month and 3-month returns continuing the progress of the last two weeks. As recently as the week ending 10-27-23, we saw all 1-month and 3-month returns in the negative range for both debt and equities that week. We saw 3 of the 4 YTD run rates in debt negative and 2 of the 4 YTD lines in equities in the red. With the above results, we have obviously come a long way in a hurry.
In bonds, the good news for YTD HY returns is that the asset class has already pulled ahead of a coupon year and graduated to coupon plus barring a setback like that seen in Dec 2018, when HY tanked after reaching a cyclical low in HY OAS in early Oct 2018. We see the IG index making a UST-driven push in total return but still has not clawed its way back to a coupon return yet YTD.
The next big bang number we have for inflation is in the last week of November with the PCE release right after the next set of updated GDP numbers. We also could hear more noise from the Middle East if OPEC frustration boils over from the Israel-Hamas conflict into tougher policies on oil production. The budget extension at least puts off the government shutdown, but that is much less important from an immediate macro standpoint than the inflation numbers.
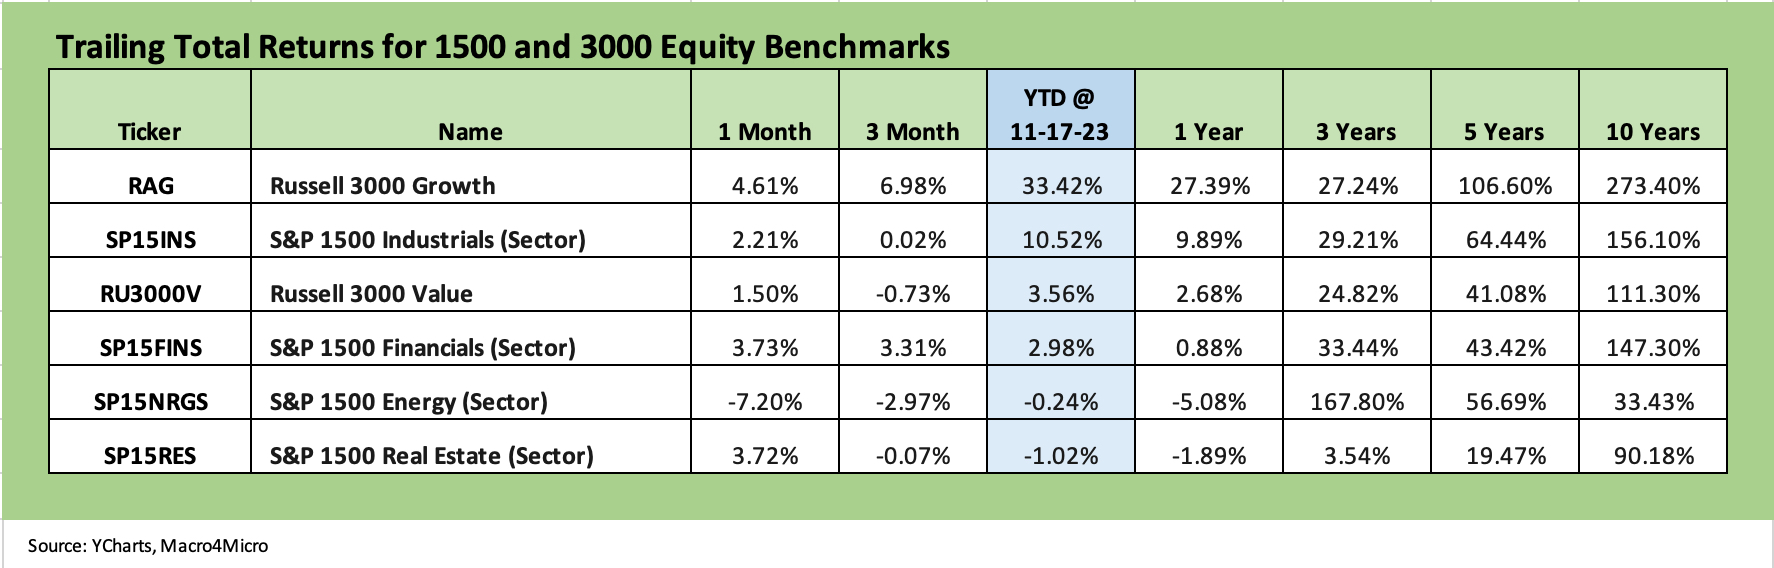
The above chart updates the 1500 and 3000 equity benchmark series we watch. Those lines have almost all rebounded since the end of October although Energy has been getting beaten up on weak oil prices. The small caps had a banner week as we discuss in the ETF section below. Real Estate and Financials are getting a bump from the UST curve action of the past few weeks. Growth performance remains stellar YTD and Industrials have edged back with lower rates and mixed cyclical data.
The performance visual…
The next two charts show the shape of the returns for the positive vs. negative returns across 1-week, 1-month, 3-month, and YTD time horizons. We post it for the past week’s trend and then below that for the prior week. Sometime the magnitude of the shapeshifting is just easy to see from how these bar charts change visually.
For this week’s numbers, the all-positive 1-week speeds up the “shift left” for the 1-month. The positive wrap to the year is also getting more visible in the 3-month chart as small negative numbers shift across into the positive range.
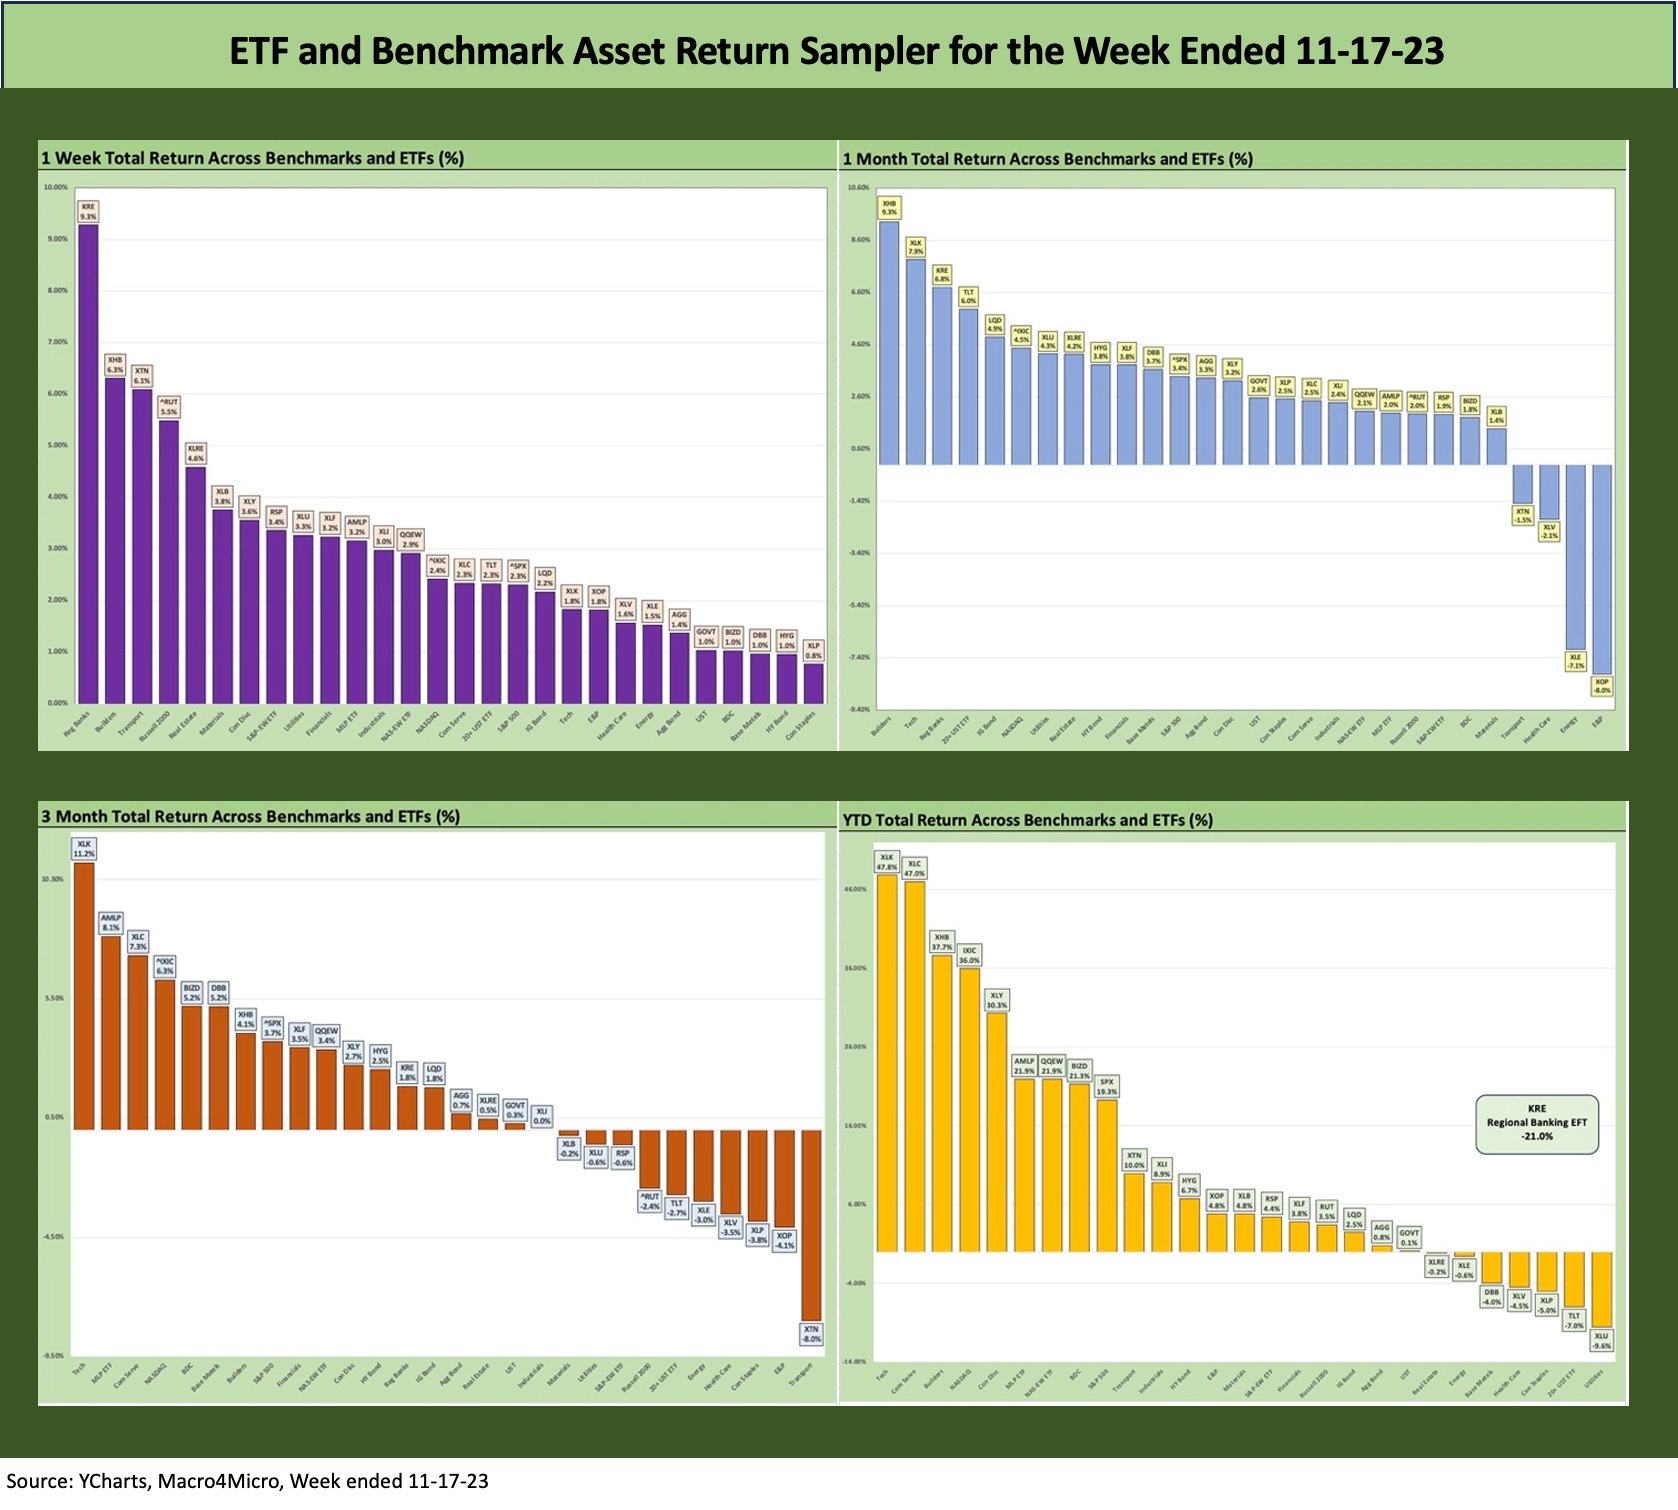
As we look at the week ended Friday 11-17-23, the main event is the shutout victory for debt, equity, and broad market benchmarks for the week: all positive and zero negative. We see all 5 fixed income proxies in bond ETFs in positive range with the 20Y UST ETF (TLT) winning among fixed income followed by the longer duration IG Corporate ETF (LQD) as those two came in ahead of AGG, GOVT and HYG for the week. We get into the details further below, but we see the shift over 3 months and YTD with this week’s solid performance.
ETF and benchmark returns…
Time Horizon Returns
In our next four asset return charts, we cover 1-week, 1-month, 3-month, and YTD time horizons for a range of ETF and benchmark returns. We look at 28 different benchmarks and ETFs that cut across a wide expanse of the economy.
The Magnificent 7 has carried the S&P 500 well into the positive zone at +19.3% YTD, but that market cap weighted benchmark is not a real portfolio with prudent diversification. We see the equal weighted S&P 500 ETF (RSP) edging a bit further into positive range YTD at +4.4% after being negative only a few weeks ago. NASDAQ has been a winner in market cap weighted or using equal weighted ETFs (e.g., QQEW), so that has been a consistent strong point in equity market performance in 2023.
The small cap Russell 2000 had been in negative range as of last week at -1.9% YTD, but the Russell 2000 broke into positive YTD range (+3.5%) on a banner week as we look at below. This weekend Barrons was flagging the small caps as a risky zone: “Some 40% of Russell 2000 companies are unprofitable, Torsten Sløk, the chief economist at Apollo Global Management, pointed out in a note on Friday.” That mix of unprofitable companies puts a few asterisks on that group.
Our admittedly simplistic shorthand for the small caps is that the Russell 2000 offers another read on a wider range of more US-centric companies and the markets they serve. One theme lately is that small caps are just getting pulled along as a laggard as investors seek some lower P/E multiples to chase.
For the credit market investors, another angle is that the Russell 2000 is viewed as having more in common with the HY issuer base and the performance in small caps is another source of reassurance for US HY from a high level. HY also gets back to issuer level work (“know what you own”), but small cap performance is one more indicator to toss on the pile.
The Magnificent 7 heavy ETFs…
Some benchmarks have a few issuer concentration elements that leave them wagged by a few names. When looking across some of the bellwether industry/subsector ETFs, it is good to keep in mind which narrow ETFs (vs. broad market benchmarks) get wagged more by the “Magnificent 7” including Consumer Discretionary (XLY) with Amazon and Tesla, Tech (XLK) with Microsoft, Apple, and NVIDIA, and Communications Services (XLC) with Alphabet and Meta.
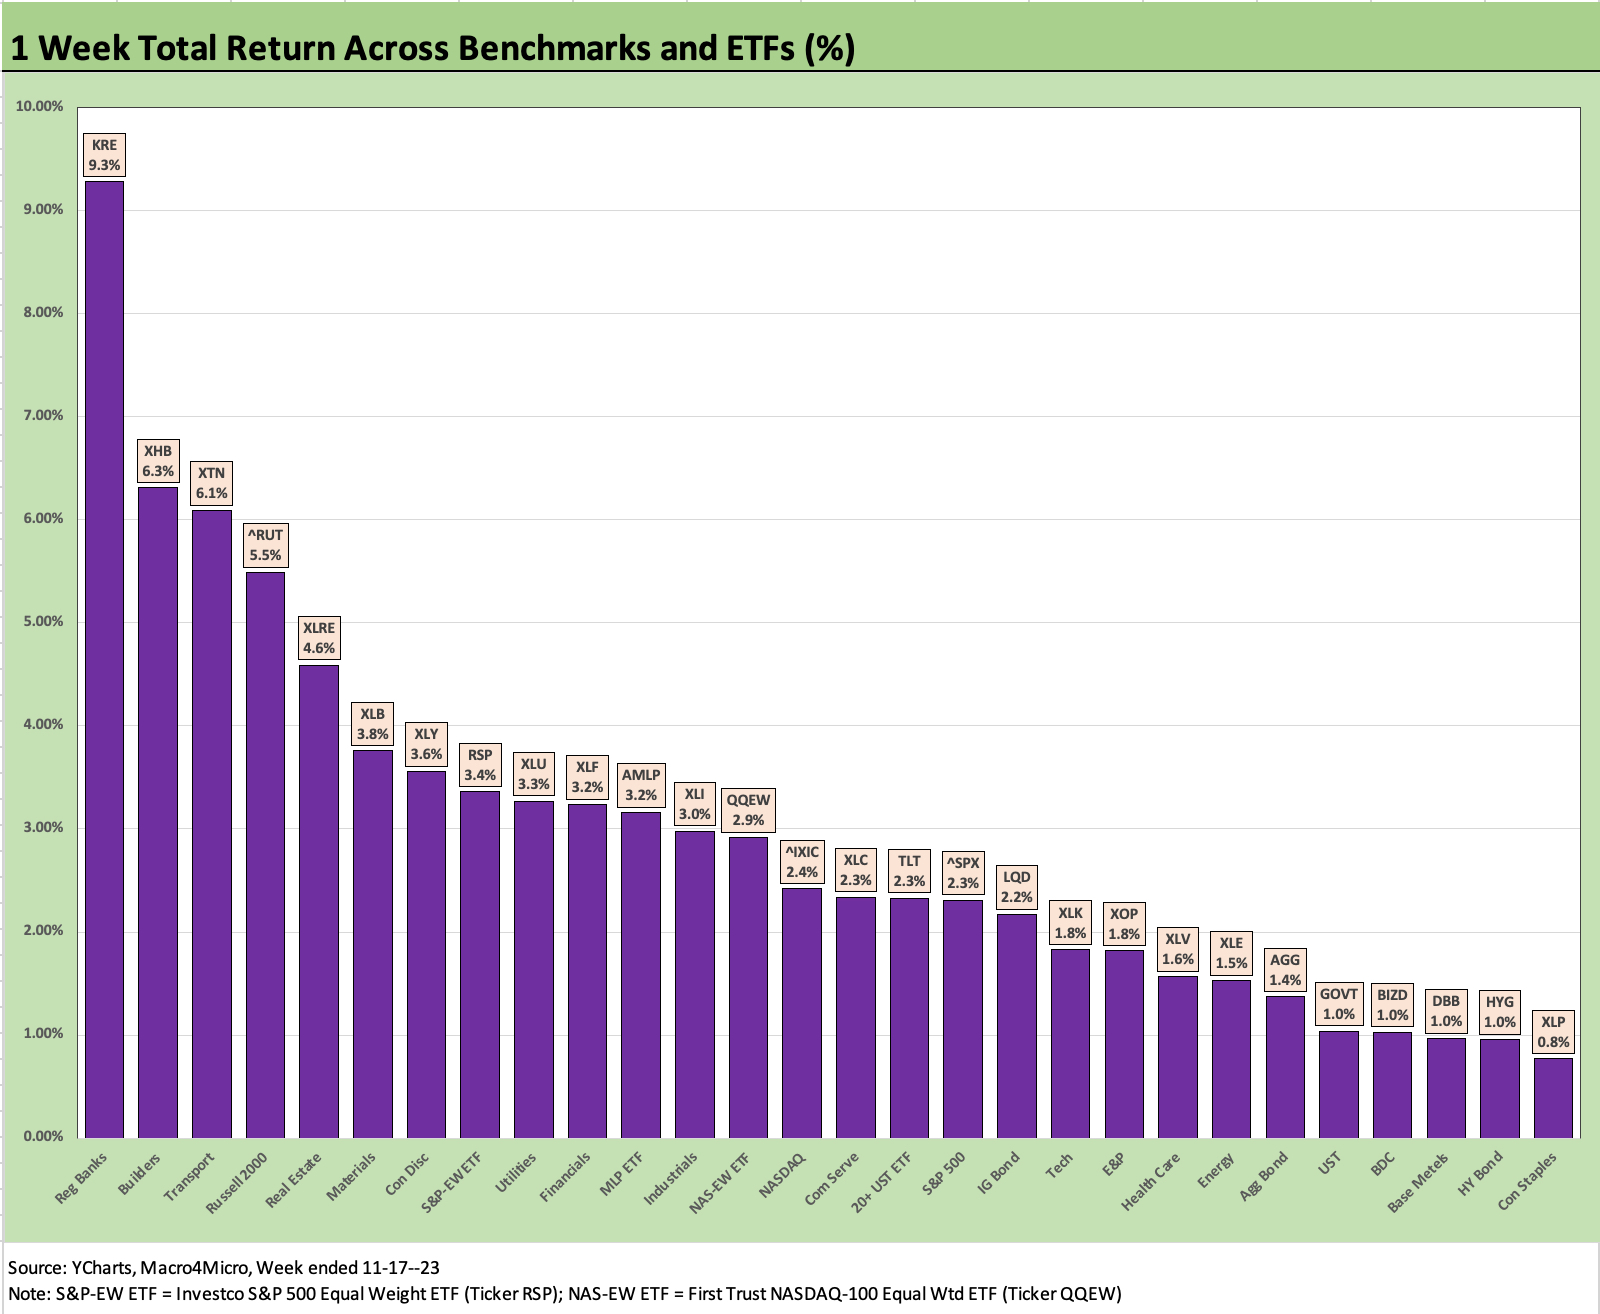
The 1-week ETF and benchmark returns came up all roses the past week with the Regional Bank ETF a clear winner at +9.3% among the most curve sensitive sectors with the Builders ETF (XHB) coming in at #2 with +6.3% return. The Transport ETF (XTN) at #3 this week at +6.1% has been a material laggard over the trailing 3-month period in last place at -8.0%. XTN was also in the bottom 5 for 1-month, so that is a contrast with the Builders and their place at #3 YTD just behind two Magnificent 7 heavy ETFs in Tech (XLK) and Communications Services (XLC).
As noted earlier, the small caps (RUT) came in strong this past week at #4 with +5.5% behind Transports (XTN) and ahead of Real Estate (XLRE) at +4.6%, which is interest rate sensitive but managed to break into the positive return range this week in the trailing 3-month rankings while remaining negative YTD. Rounding out the top quartile for the week was the Materials ETF (XLB) at +3.8% and Consumer Discretionary (XLY) at +3.6%.
The week shows all 5 fixed income ETFs in the positive range, but they ranked in the 3rd quartile and 4th quartile. The winner of the fixed income ETF battle was the duration-heavy TLT followed by LQD. In credit-heavy assets, the BDC ETF (BIZD) had an off week at +1.0% behind the UST ETF (GOVT) but ahead of the HY ETF (HYG) that we track. AGG just edges out GOVT, but they were bottom quartile.
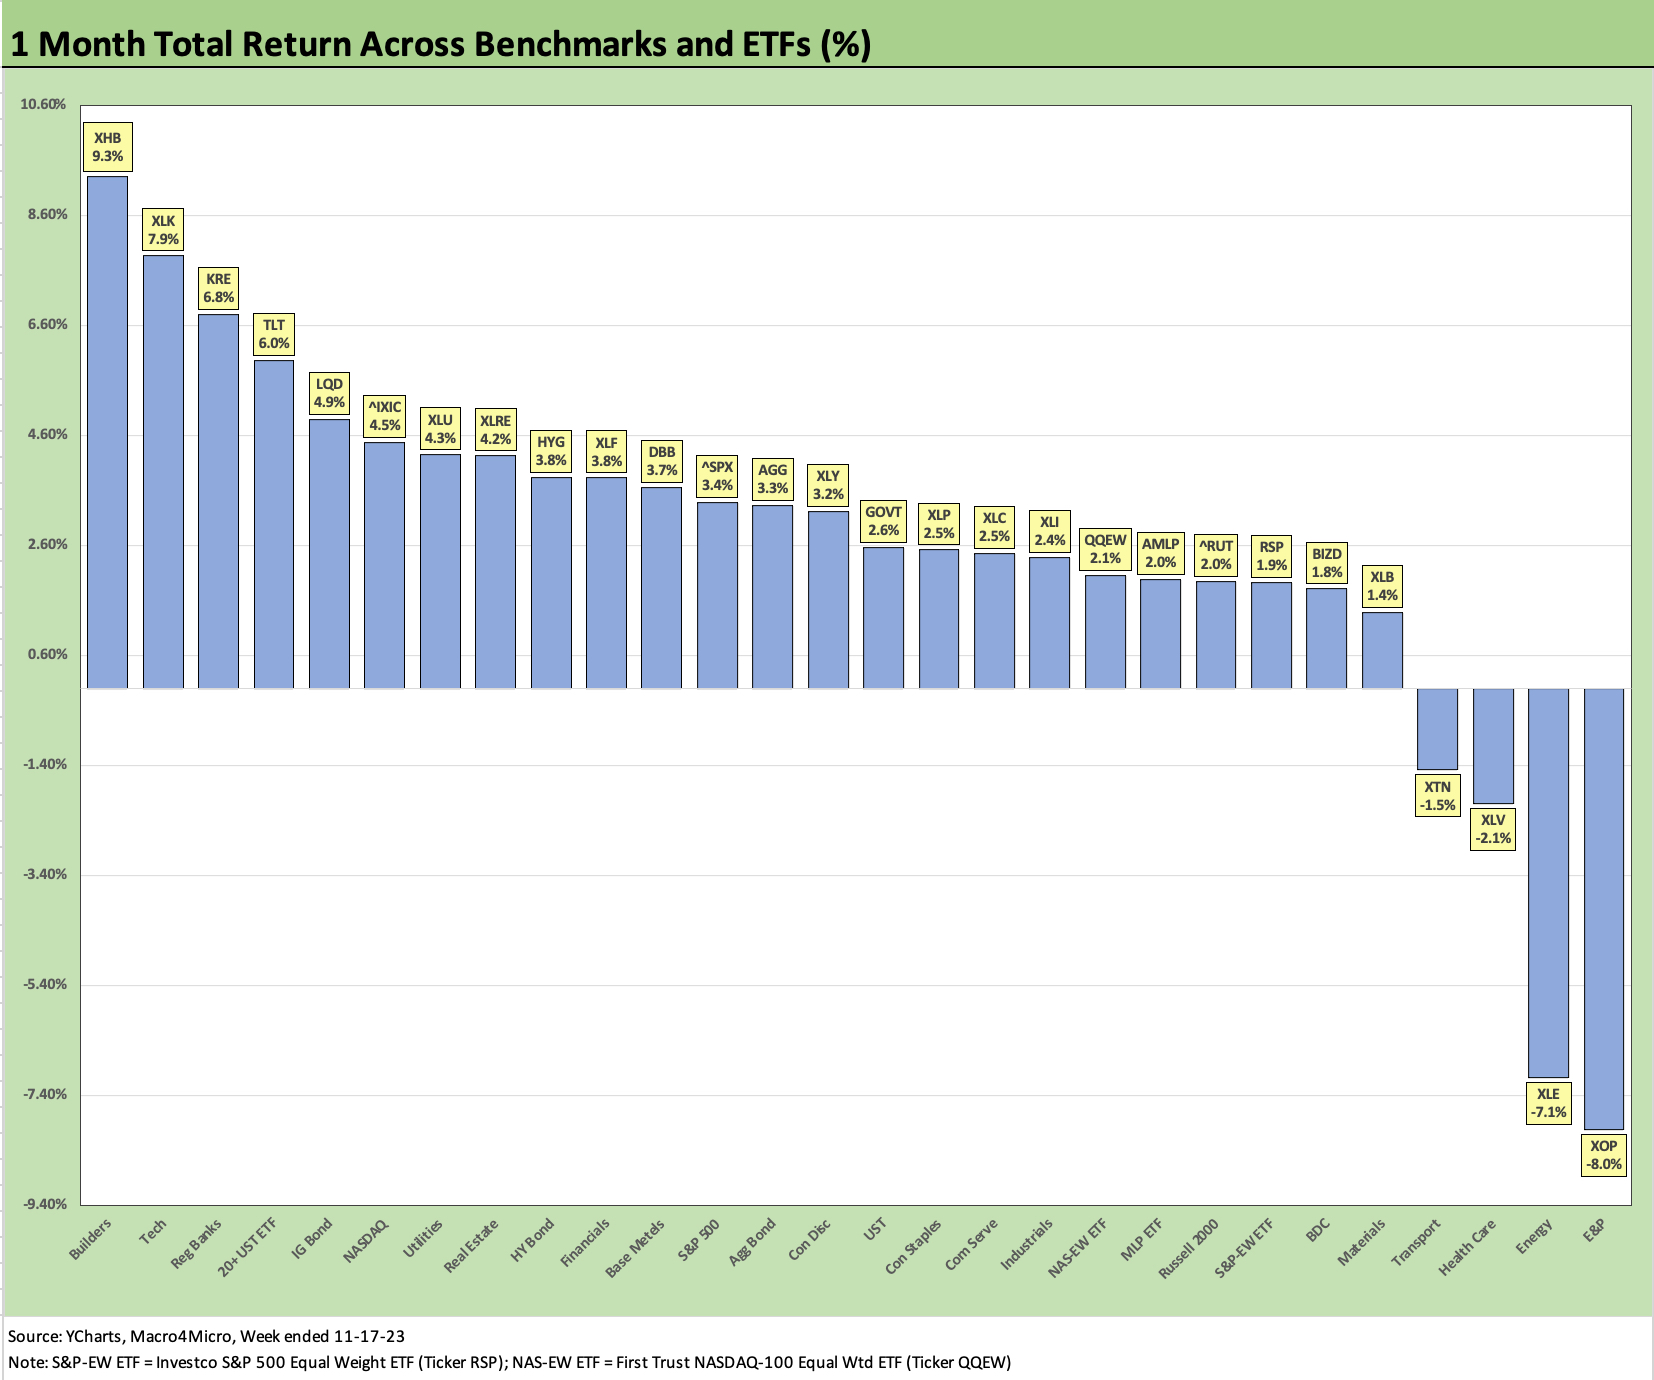
The 1-month returns are overwhelmingly positive at 24-4 with the E&P ETF (XOP) and Energy (XLE) sitting on the bottom of the rankings with the sharp decline in oil prices. Health Care (XLV) at -2.1% and Transport (XTN) at -1.4% round out the negative returns.
UST curve support and a sustained tech rebound are the main themes across the leaders. The KRE performance is heavily tied to the curve but also can be framed in the context of asset risk appearing less threatening if lower recession risk scenarios factor into pricing near term. Less recession risk means less loss provisioning risk (in theory).
Fixed income came in all positive for the 1-month period with 20+ Year UST ETF (TLT) a solid #4 at +6.0% behind Regional Banks (KRE) at +6.8%. The 1-month winners are a mixed group, but the Builders (XHB) came in at #1 at +9.3% after some recent on-off struggles around rates. The brief selloffs along the way for XHB on the UST curve did not change the fact that the Builders have been a home run in 2023 holding down the #3 spot YTD at +37.7%.
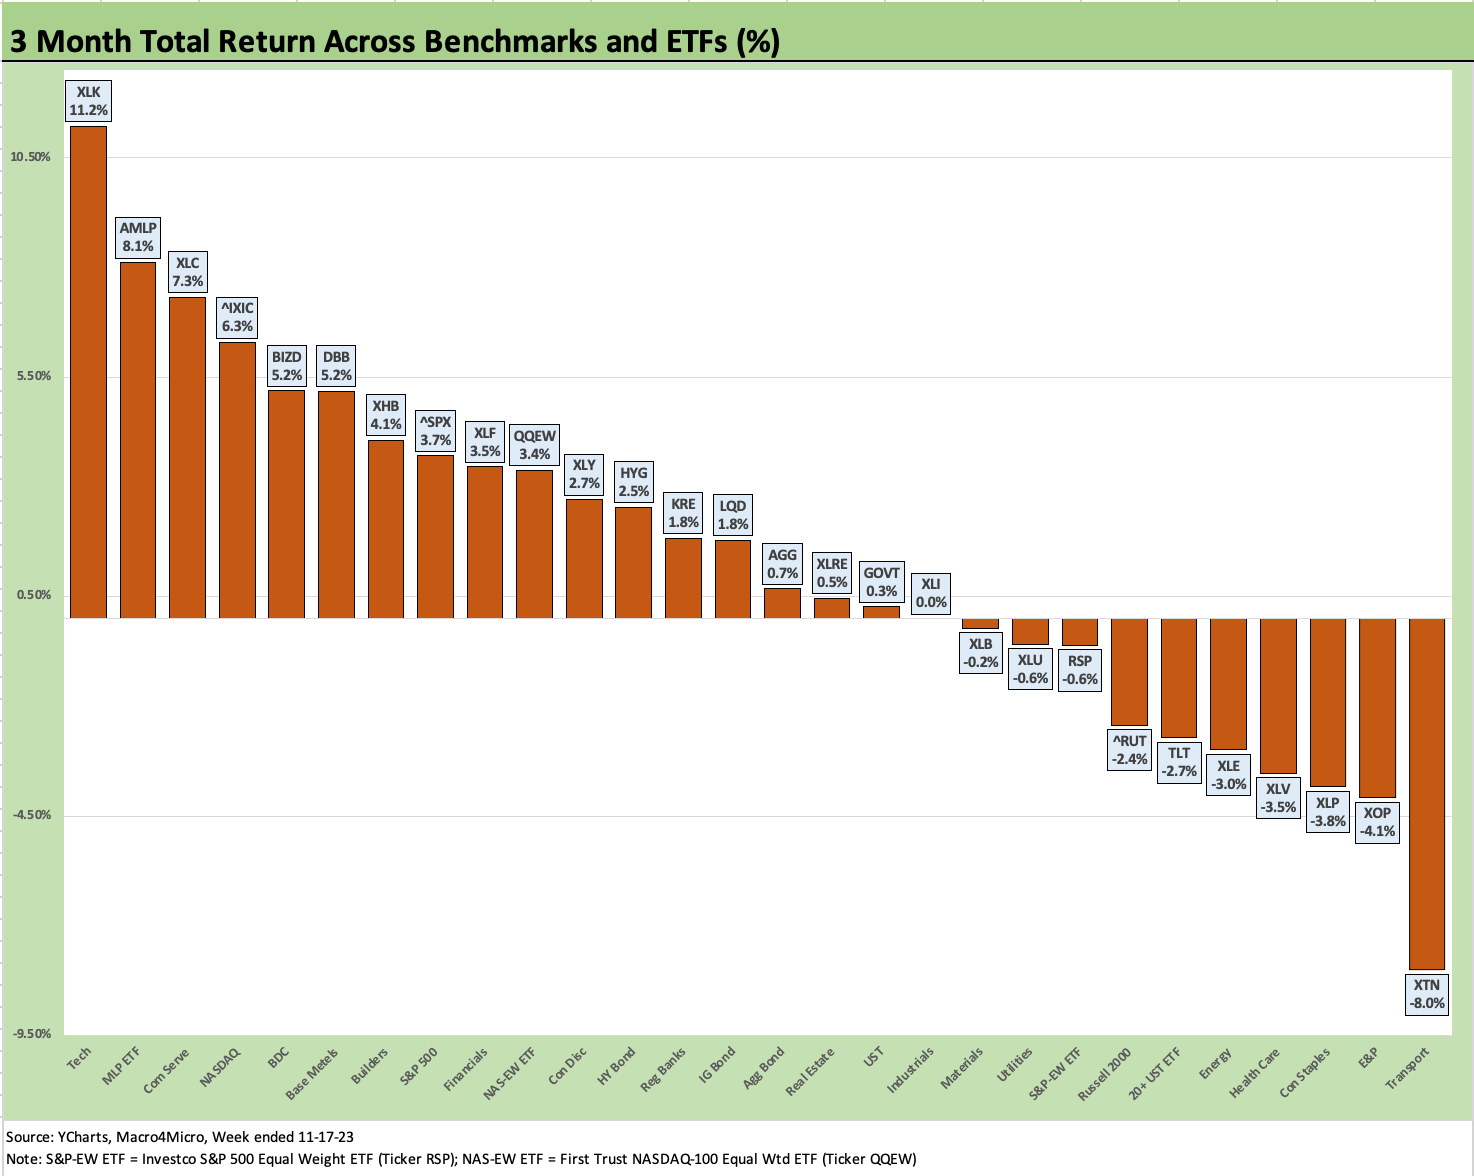
The 3-month winners show a mixed Top 10. In the Top 5, we see Tech (XLK), Midstream (AMLP), Communications Services (XLC), NASDAQ (IXIC), and BDCs (BIZD). The next tier has Base Metals (DBB), Builders (XHB), the S&P 500 (SPX), Financials (XLF), and equal weighted NASDAQ 100 (QQEW). That list obviously is heavily influenced by Tech and the UST curve with hints of cyclical relief in the mix as well (Base Metals). The BDC strength has been a consistent theme across the months on a combination of floating rate debt exposure and high dividend payouts in the total return math.
On cyclical exposure issues, the message is sometimes harder to discern such as in the case of Transports (XTN), which is sitting on the bottom. Industrials are sitting on the positive side of zero with Consumer Discretionary (XLY) a bit further up the positive return rankings.
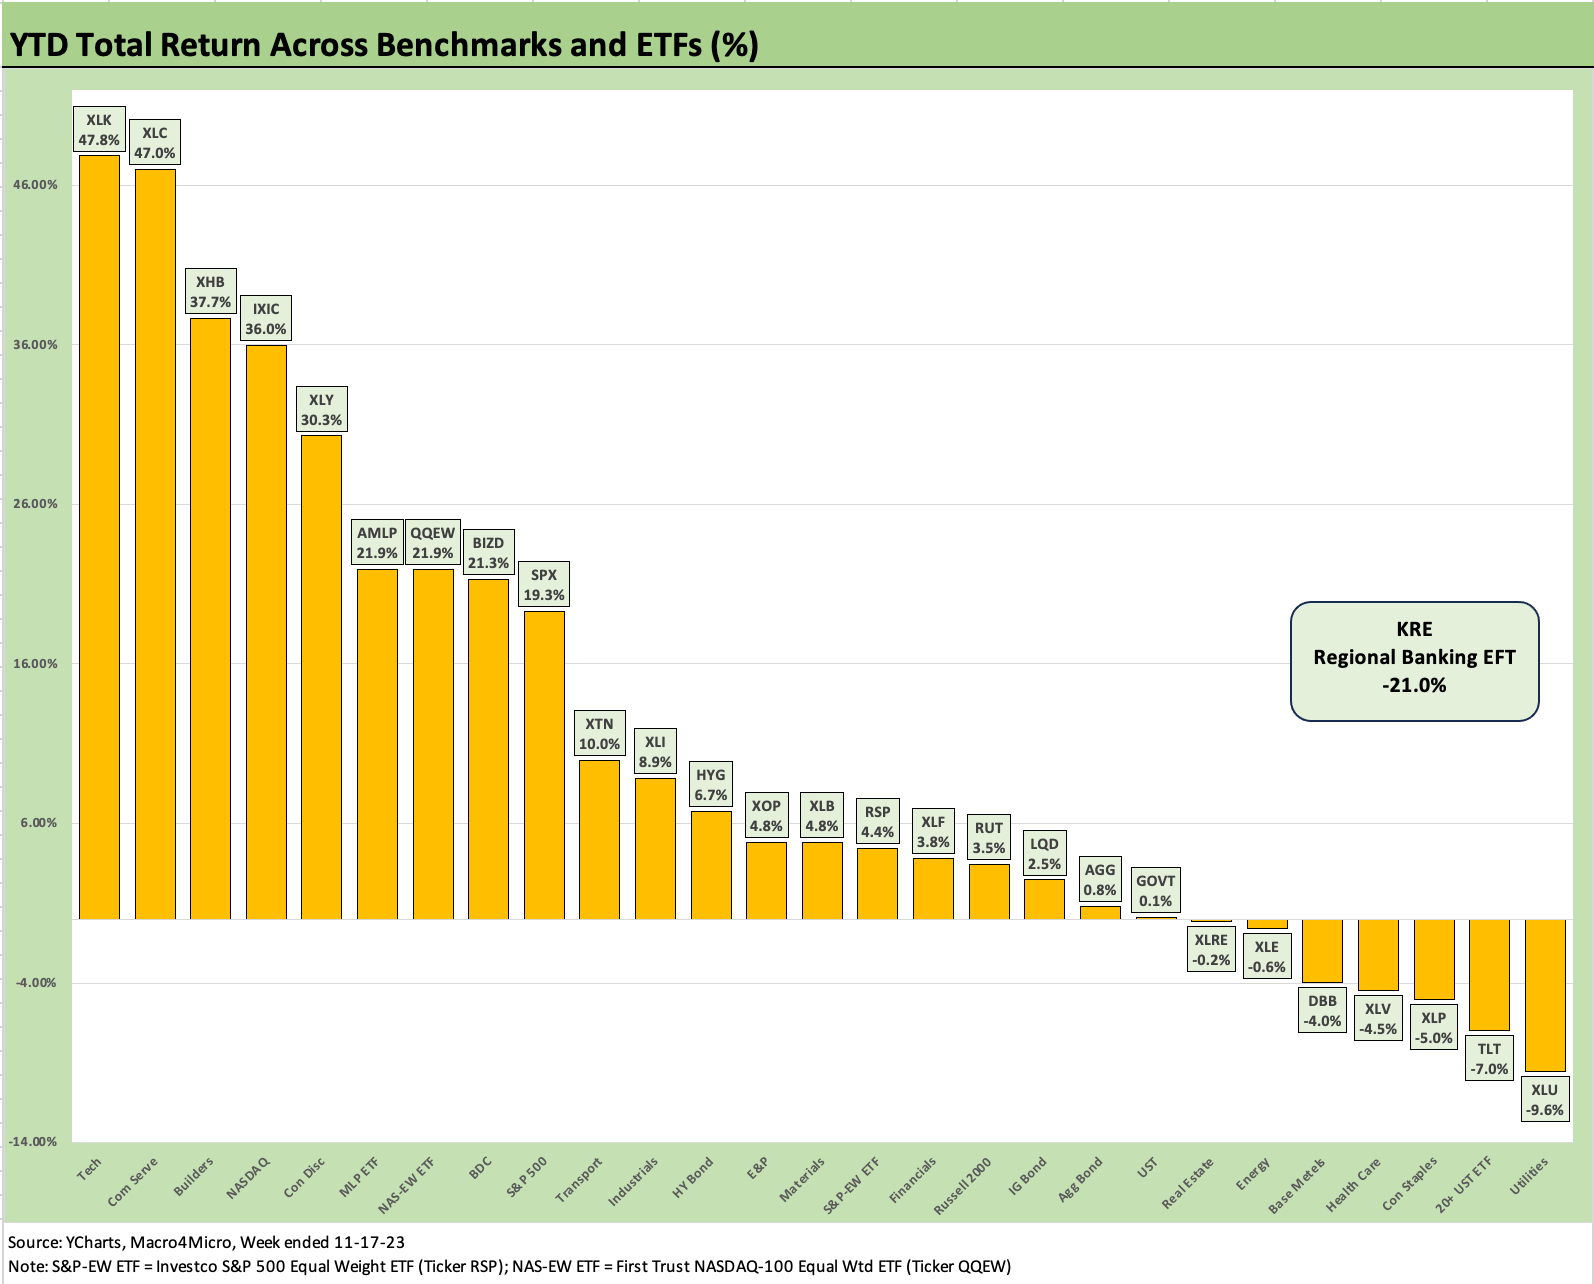
The YTD numbers weigh in at 20 positive and 8 negative. Of the 8 negatives, only one sector was in double digit negative with Regional Banks (KRE) at -21.0%. In contrast, the list shows 10 of the 28 in positive range at double digit returns from 10% to 47%. We see 8 above the 20% line (9 if we include the 19% handle on the S&P 500).
Tech and the Magnificent 7 dominated the Top 5 as shown in the chart. The Builders (XHB) shook off high mortgage rates YTD and came in behind two Magnificent 7 ETFs in XLK (Tech) at +47.8% and XLC (Communications Services) at +47.0%. XHB is in impressive YTD company ahead of IXIC (NASDAQ) and XLY (Consumer Discretionary). NASDAQ at #4 and Consumer discretionary (XLY) at #5 make the Builders the only industry group to crack the top tier of the leader board YTD against Tech and Magnificent 7 heavy names.
Joining Regional Banks (KRE) in the negative zone are some interest rate sensitive sectors such as Utilities (XLU) at -9.6% and the 20+ Year UST ETF (TLT) at -7.0%. We see Energy (XLE) and Real Estate (XLRE) close to the zero line in the negative zone with the defensive Staples (XLP) and Health Care (XLV) as usual mired near the bottom.