CPI: The Big 5 Buckets and the Add-Ons
We intro the Big 5. CPI dipped from 8.2% to 7.7% on lower Food, Energy, Auto, and Medical Services with Shelter higher.
The market got pumped up by the downtick in headline and core CPI from September to October. This is a natural reaction as the market has been on edge to the upside and downside of late. However, tomorrow the world will get back to the reality of the threats ahead as we move into a period of cyclical uncertainty. The cumulative effects of these CPI releases remind us that we need context around what is going on with household budgets. The consumer still sees his bill higher at the cash register even if it is going up slower than last month. Lower inflation and the Fed’s plan to keep that trend going still needs for be framed against what comes with weaker demand (lower profits, higher unemployment, questions around valuation, etc.). That exercise will resume quickly enough.
In this commentary I break out the “Big 5” inflation categories and their relative weights in the CPI index. Most are obvious: Food, Energy, Shelter, Medical—but I also include my own version of the Auto-related CPI line items WHY? to provide a clearer picture of consumer experience. When you add up the line items that go directly into autos (services and goods together: 12.4%), the lines almost carry the same weight as Food. And this is before putting gas in the tank (See Automotive Inflation: More Than Meets the Eye).
Note on the chart format below: I break out the CPI trends starting back at the end of 2020 and roll forward each quarter from 4Q20 to 2Q22. From 2Q22, I included monthly data, as well as the most recent CPI index weightings. Most weighting tend to stay the same or make only small moves each month. I list totals for some categories (per BLS). Highlighted subcategories represent important standalone line items (they may not add up to totals). I roll up “Auto related” using line items from the Transportation goods and services categories. This simplified format makes it easy to track the main buckets across time. (Remember, there are multiple pages of small font line items in the BLS monthly releases!). These lists whittle that down.
Together, the Big 5 categories comprised approximately 75% of the total index in October: Shelter at 32.6%, Food at 13.7%, Energy at 8.0%, Medical Services/Commodities at 8.4%, and Auto-related at 12.4%. Further below I include a chart with some other consumer bellwether expense lines that take the total closer to 90% of the index weightings.
Key Takeaways
Headline and Core CPI: Core is down from the multi-decade high of September, which was a big problem for markets last month. The headline CPI of 7.7% is very high in absolute terms but tailing off from 9.1% in June. We have not had a 7% handle since Feb 2022 (7.9%). CPI jumped to 8% handles in March and has been in the 8% range since then except for a 9.1% move in June. As we head into the winter, the energy lines will be a wildcard given the peak heating season for natural gas and the uncertainty around broader supply-demand for oil.
Food: Double-digit food inflation intuitively is a problem for household budgets. This is where mix shifts come into play in store aisles. As the holiday season approaches, this is not a great thing for some industries, issuers, and retail equities. I included a picture of Spam at the top of the piece as a reminder that there is always a mix shift to analyze. Nothing against Hormel or Spam since I was a major consumer as a kid (I liked it lightly fried with onions. My father went for the “freshly keyed” spam with its glistening gelatinous coating—it was a Marine thing).
Consumer price consciousness in such markets means tough economic decisions before you get to the cash register. This is a reminder that when inflation flows even to the 7% headline range, both the price and the total are going up in the old “Price x Volume” equation. $50 either buys less goods or very different goods at lower prices. That flows into wage expectations as the consumer strives to keep up, and wage increases influence a lot of the goods and services costs that employers will seek to recoup in price.
Shelter: The expectation for lower house prices and lower rents are logical enough, but employment is strong and wage expectations remain a source of concern for the household and the employer. Unions (notably in freight and logistics) have high wage and benefit expectations to go with some emotion that comes with the ugly inflation trends.
Total Shelter CPI rose sequentially to 6.9% and Rent (Primary residence) ticked higher to 7.5%. Owners’ Equivalent Rent (OER) also moved higher to 6.9%. Rents don’t change overnight and those with low mortgages locked in are not doing anything if they can avoid it. The result has been lagging movement in these metrics. With the market-clearing price for a home also heading lower, this is not the time to plan the empty nester trade if possible. Housing will be getting a lot more attention in future commentaries (See Market Menagerie: Housing Questions to Ponder).
Automotive: Autos will be getting a lot of press now that the normalization of used car prices is finally underway. I read through car dealer earnings reports and transcripts to get added flavor on the retail chain and used car planning. Many dealers had posted trailing margin “home runs” for those who had inventory and channels to source more used cars during the earlier spike. Those unit margins will now be heading lower. Slowly, the prices of late model used cars vs. new cars will get back to a more logical economic relationship. The tight supply of vehicles is correcting while financing is more expensive. This will be an area to watch closely.
For CPI, the market sees double-digit inflation in Vehicle Insurance, Maintenance/Repair, and Parts/Equipment. Motor vehicle ownership is an expensive part of consumer life. A part that goes well beyond the new and used vehicle line. For example, if oil goes up, tire prices go up (in the Parts/Equipment line), and pricing power is uniform across the aftermarket by the tire makers. Similarly, staffing and skill set costs are going up in maintenance and repair in a world where the car is increasingly software heavy. Auto repair is often about diagnostics. That is a more skilled worker in demand across multiple industries.
Energy: It’s interesting to note that Energy is a smaller share of CPI than Auto related, but then you remember that the gasoline goes in the tank. The Auto-Gasoline part of household economics remains a strain. Further, the upward pressure on natural gas and natural gas liquids flows in many directions beyond the gas tank (cars or diesel in trucks). That includes the propane tank next to the house just as fuel oil in the home heating oil tank (a major factor in New England). Natural Gas and downstream derivatives show up in many products’ Cost of Sales lines.
In the US, the reality is that natural gas is a major feedstock in the petrochemical chain that is often overlooked in the energy commentary. That cost pressure is a major source of pain as these costs flow into consumer goods. As noted in the chart, natural gas costs flow into the electricity bill (+14.1%) and piped gas (+20%). The rate of inflation there is down but still very high as the country heads into the winter season. There is a lot of room for dialogue on what a cold winter might mean for both the US and Europe. Energy costs hit households hard at time when food is up and jobs may be going the wrong way. These costs also serve to fuel wage demands.
Medical: Healthcare has lost some its political visibility it seems in recent periods with COVID easing somewhat and no one in the Oval Office determined to undo Obamacare. The slow inflation creep in Medical Services at 6.9% of the CPI index (note: Medical Services and Medical commodities e.g., drugs are two different categories in the CPI bucket.) has been alarming but did tick down sequentially. The Health Insurance line is much smaller but punches above its weight class in household sentiment. For the last four months, this line had run up into the 20% handle range. Manpower shortages in healthcare, a post-COVID brain drain, and manpower erosion are starting to weigh on costs as wage demands increase, so this will be a line and topic to watch
Some other very visible household CPI line items…
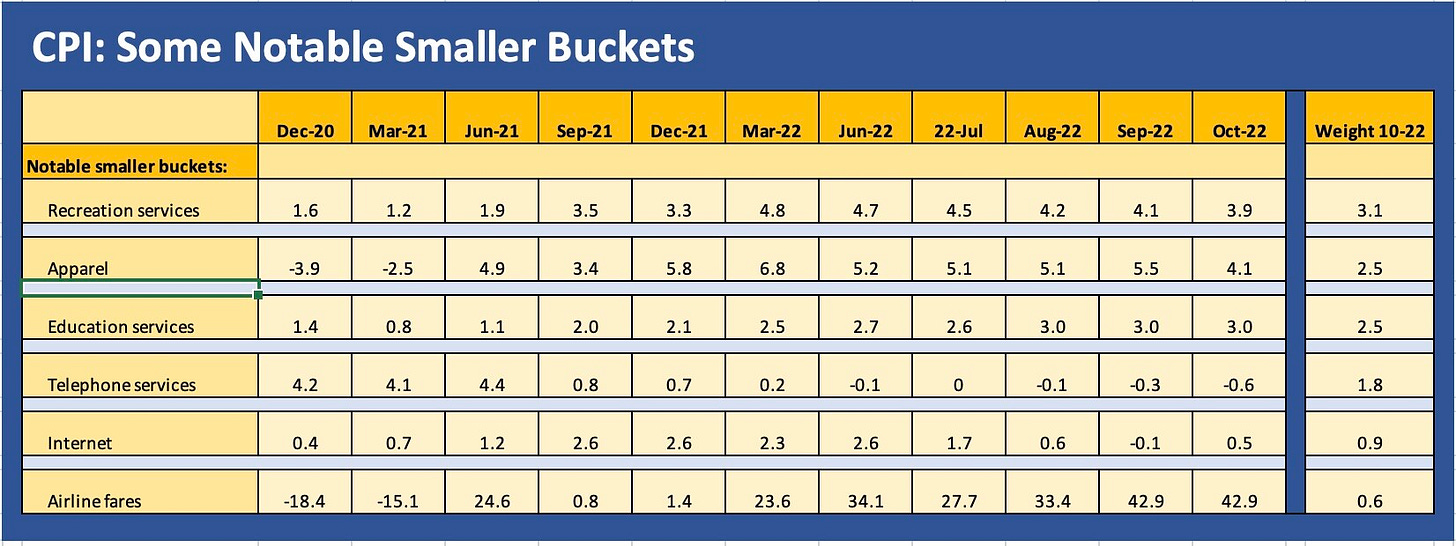
I covered the main events above, but the chart below breaks out some of the add-ons that need to be watched in everyday life for the typical household: Apparel, Recreation, Education, Telephone, Internet and Airfare. Apparel jumped higher from 2021 but inflation is slowing to levels more in line with wage growth. The same is true for Recreation, but the service jobs profile in those trades could be ripe for more wage and cost pressure. This labor cost will need to flow into pricing. The Telephone and Internet lines show minimal inflation and even deflation by these metrics. This could help explain some weak equity performance in the space.
Apparel jumped higher from 2021 but inflation is slowing to levels more in line with wage growth. The same is true for Recreation, but the service jobs profile in those trades could be ripe for more wage and cost pressure. This labor cost will need to flow into pricing. The Telephone and Internet lines show minimal inflation and even deflation by these metrics. This could help explain some weak equity performance in the space.


